Aaj ka trend
•
0 likes•63 views

- Gold and silver prices declined on Tuesday due to a stronger US dollar, with gold falling by as much as 2.15% and silver dropping near key support levels. - Most base metals also fell, with copper hitting a one-month low due to a strike at the Antamina mine in Peru and declining oil prices weighing on industrial metals. - Crude oil and natural gas prices also declined sharply by over 2% and 3% respectively on ongoing oversupply concerns and forecasts of mild weather decreasing demand.

Recommended
More Related Content
What's hot
What's hot (20)
Viewers also liked
Viewers also liked (15)
Similar to Aaj ka trend
Similar to Aaj ka trend (20)
Aaj ka trend
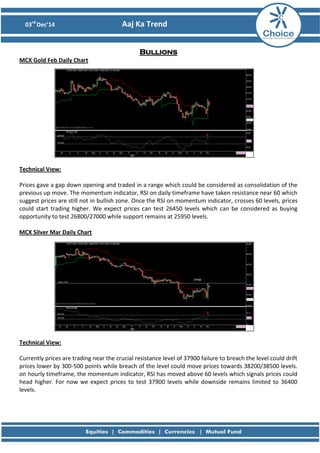
- 1. 03rd Dec’14 Aaj Ka Trend Bullions MCX Gold Feb Daily Chart Technical View: Prices gave a gap down opening and traded in a range which could be considered as consolidation of the previous up move. The momentum indicator, RSI on daily timeframe have taken resistance near 60 which suggest prices are still not in bullish zone. Once the RSI on momentum indicator, crosses 60 levels, prices could start trading higher. We expect prices can test 26450 levels which can be considered as buying opportunity to test 26800/27000 while support remains at 25950 levels. MCX Silver Mar Daily Chart Technical View: Currently prices are trading near the crucial resistance level of 37900 failure to breach the level could drift prices lower by 300-500 points while breach of the level could move prices towards 38200/38500 levels. on hourly timeframe, the momentum indicator, RSI has moved above 60 levels which signals prices could head higher. For now we expect prices to test 37900 levels while downside remains limited to 36400 levels.
- 2. 03rd Dec’14 Aaj Ka Trend Fundamental News: Gold tumbles 2% after Monday's sharp rally. Gold prices tumbled sharply on Tuesday, as a broadly stronger U.S. dollar dampened the appeal of the precious metal On the Comex division of the New York Mercantile Exchange, gold futures for February delivery fell by as much as 2.15% to touch a daily low of $1,191.80 a troy ounce, before trading at $1,195.30 during U.S. morning hours, down $22.80, or 1.87%. A day earlier, Comex gold prices fell by as much as 2.86% to $1,141.70 an ounce, the weakest level since November 7, before rallying to settle at a five-week high of $1,218.10, up $42.60, or 3.62%. Pivot Levelsfor the Day: S1 S2 S3 Pivot R1 R2 R3 Gold 26018 25847 25467 26227 26398 26607 26987 Silver 35643 35128 34141 36115 36630 37102 38089 Recommendation: Gold Buy on dips Silver Buy
- 3. 03rd Dec’14 Aaj Ka Trend Base Metals MCX Copper Feb Hourly Chart Technical Views: Prices have taken support near the 50% retracement level of the previous up move which suggested prices could head higher while near that that level prices have formed bullish engulfing candlestick which would give positive confirmation. The momentum indicator, RSI has taken support near 40 levels on hourly timeframe which also indicates once prices are trading above 396 levels prices can head higher near 405 levels. MCX Aluminum Dec Hourly Chart MCX Lead Dec Hourly Chart MCX Nickel Dec Daily Chart MCX Zinc Dec Hourly Chart
- 4. 03rd Dec’14 Aaj Ka Trend Fundamental News: Copper Falls on Antamina Mine Strike While Oil Weighs on Metals. Copper for delivery in three months on the London Metal Exchange fell as much as 1.2 percent to $6,481.25 a metric ton, the lowest since March 25. Aluminum in London dropped as much as 0.5 percent to $2,033 a ton. Nickel and zinc also declined on the LME, while tin was unchanged. Pivot Levels for the Day: S1 S2 S3 Pivot R1 R2 R3 Copper 397.1 393.5 387.2 399.7 403.4 406.0 412.2 Aluminum 120.5 118.9 114.6 123.2 124.8 127.5 131.8 Lead 124.8 123.7 121.0 126.3 127.5 129.0 131.6 Nickel 999.9 991.8 974.1 1009.5 1017.6 1027.2 1044.9 Zinc 135.7 134.7 132.1 137.4 138.3 140.0 142.7 Recommendation: Copper Buy Aluminum Sell on Rallies Lead Neutral Nickel Neutral Zinc Neutral
- 5. 03rd Dec’14 Aaj Ka Trend Energy MCX Crude Dec Daily Chart: Technical Views: Prices drifted lower achieving both the short term targets. We now remain cautious as prices are trading near the downtrend line above which prices could rally towards 4350 levels while failure to breach the levels could drift prices towards 4180 levels. Favored view remains buy as on daily timeframe prices have formed hammer candlestick which would give bullishness to prices. MCX Natural Gas Dec Hourly Chart: Technical Views: Prices opened on a flat note but in the second half of the trading session prices drifted lower below the lower band of the consolidation formation which gives negative confirmation for prices. We expect prices can test 235 levels while upside remains capped at 246.40 levels. the momentum indicator, RSI remained below 40 levels which suggest lack of momentum in prices.
- 6. 03rd Dec’14 Aaj Ka Trend Fundamental News: West Texas Intermediate and Brent oil prices tumbled sharply on Tuesday, as a broadly stronger U.S. dollar and ongoing concerns over a global supply glut weighed. On the New York Mercantile Exchange, crude oil for delivery in January fell by as much as 3.27% to touch a daily low of $66.74 a barrel, before trading at $67.50 during U.S. morning hours, down $1.50, or 2.17%.. A day earlier, Nymex oil futures fell by as much as 3.6% to $63.72 a barrel, a level not seen since July 2009, before rallying to settle at $69.00, up $2.85, or 4.31%, as market players closed out bets on lower prices. Natural gas futures tumble to 4-week low as mild weather weighs. U.S. natural gas prices fell for the fourth consecutive session on Tuesday to hit the lowest level in more than four weeks as forecasts for above-normal temperatures to settle in across much of the U.S. in early December weighed. Pivot Levels for the Day: S1 S2 S3 Pivot R1 R2 R3 Crude 4152 4093 3936 4250 4309 4407 4564 Natural Gas 236 232 220 244 248 255 267 Recommendation: Crude Buy Natural Gas Sell
- 7. 03rd Dec’14 Aaj Ka Trend SumeetBagadia (Associate Director) sumeet.bagadia@choiceindia.com Ritesh Patel (Research Associate) ritesh.patel@choiceindia.com DeveyaGaglani (Research Advisor) deveya.gaglani@chocieindia.com For Private Circulation Only Website: www.choiceindia.com https://twitter.com/ChoiceBroking http://www.slideshare.net/choiceindiabroking https://www.youtube.com/user/ChoiceBroking https://plus.google.com/115293033595831069270/posts https://www.facebook.com/pages/Choice-Equity-Broking-Pvt-Ltd/352491718249644 https://www.linkedin.com/company/choice-international-limited?trk=parent_company_logo
- 8. 03rd Dec’14 Aaj Ka Trend This is solely for information of clients of Choice Broking and does not construe to be an investment advice. It is also not intended as an offer or solicitation for the purchase and sale of any financial instruments. Any action taken by you on the basis of the information contained herein is your responsibility alone and Choice Broking its subsidiaries or its employees or associates will not be liable in any manner for the consequences of such action taken by you. We have exercised due diligence in checking the correctness and authenticity of the information contained in this recommendation, but Choice Broking or any of its subsidiaries or associates or employees shall not be in any way responsible for any loss or damage that may arise to any person from any inadvertent error in the information contained in this recommendation or any action taken on basis of this information. Technical analysis studies market psychology, price patterns and volume levels. It is used to forecast future price and market movements. Technical analysis is complementary to fundamental analysis and news sources. The recommendations issued herewith might be contrary to recommendations issued by Choice Broking in the company research undertaken as the recommendations stated in this report is derived purely from technical analysis. Choice Broking has based this document on information obtained from sources it believes to be reliable but which it has not independently verified; Choice Broking makes no guarantee, representation or warranty and accepts no responsibility or liability as to its accuracy or completeness. The opinions contained within the report are based upon publicly available information at the time of publication and are subject to change without notice. The information and any disclosures provided herein are in summary form and have been prepared for informational purposes. The recommendations and suggested price levels are intended purely for trading purposes. The recommendations are valid for the day of the report however trading trends and volumes might vary substantially on an intraday basis and the recommendations may be subject to change. The information and any disclosures provided herein may be considered confidential. Any use, distribution, modification, copying, forwarding or disclosure by any person is strictly prohibited. The information and any disclosures provided herein do not constitute a solicitation or offer to purchase or sell any security or other financial product or instrument. The current performance may be unaudited. Past performance does not guarantee future returns. There can be no assurance that investments will achieve any targeted rates of return, and there is no guarantee against the loss of your entire investment. POTENTIAL CONFLICT OF INTEREST DISCLOSURE (as on date of report) Disclosure of interest statement – • Analyst interest of the stock /Instrument(s): - No. • Firm interest of the stock / Instrument (s): - No. Disclaimer