Aaj ka trend 01.10.14
•
0 likes•56 views

Gold and silver prices moved lower due to a stronger US dollar, with gold hitting a nine-month low and silver dropping 19% over the past three months. Copper futures also edged lower due to weaker-than-expected Chinese manufacturing data, adding to concerns over China's economy. Crude oil futures took a beating as investors ditched the commodity on worries about ample global supply and soft demand. Most metals were expected to continue moving lower, with recommendations to sell gold and silver on rallies.

Recommended
More Related Content
What's hot
What's hot (20)
Viewers also liked
Viewers also liked (14)
Similar to Aaj ka trend 01.10.14
Aaj ka trend 01.10.14
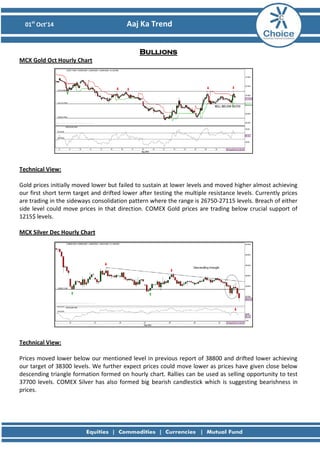
- 1. 01st Oct’14 Aaj Ka Trend Bullions MCX Gold Oct Hourly Chart Technical View: Gold prices initially moved lower but failed to sustain at lower levels and moved higher almost achieving our first short term target and drifted lower after testing the multiple resistance levels. Currently prices are trading in the sideways consolidation pattern where the range is 26750-27115 levels. Breach of either side level could move prices in that direction. COMEX Gold prices are trading below crucial support of 1215$ levels. MCX Silver Dec Hourly Chart Technical View: Prices moved lower below our mentioned level in previous report of 38800 and drifted lower achieving our target of 38300 levels. We further expect prices could move lower as prices have given close below descending triangle formation formed on hourly chart. Rallies can be used as selling opportunity to test 37700 levels. COMEX Silver has also formed big bearish candlestick which is suggesting bearishness in prices.
- 2. 01st Oct’14 Aaj Ka Trend Fundamental News: • Gold futures hit a fresh nine-month low on Tuesday, as a broadly stronger U.S. dollar dampened the appeal of the precious metal. • Gold futures are on track for a 9.2% drop in the three months ending September 30, while silver prices are almost 19% lower since the end of June, amid speculation a strengthening economic recovery in the U.S. would prompt the Federal Reserve to hike rates sooner and faster than previously expected.. Pivot Levels for the Day: S1 S2 S3 Pivot R1 R2 R3 Gold 26890 26651 26271 27031 27270 27411 27791 Silver 37970 37425 36192 38658 39203 39891 41124 Recommendation: Gold Buy above 27130 Silver Sell on Rallies
- 3. 01st Oct’14 Aaj Ka Trend Base Metals MCX Copper Nov 4 hour Chart Technical Views: Copper prices have taken resistance near the super trend level on 4 hour chart and drifted lower while the momentum indicator has also given negative confirmation by forming negative reversal near 60 levels on 4 hour chart. We expect prices should come down near 413 as long as 421 levels are capped on higher side while rallies can be used as selling opportunity. MCX Aluminum Oct Hourly Chart MCX Lead Oct Hourly Chart MCX Nickel Oct Hourly Chart MCX Zinc Oct Hourly Chart
- 4. 01st Oct’14 Aaj Ka Trend Fundamental News: • Copper futures edged lower on Tuesday, as weaker than expected Chinese manufacturing data added to concerns over the health of the world's second largest economy. • China’s final HSBC Purchasing Managers Index for September came in at 50.2, weaker than a preliminary reading of 50.5 and down from August's 50.3 figure. • Copper traders consider shifts in the HSBC PMI an indicator of China's copper demand, as the industrial metal is widely used by the sector. Pivot Levels for the Day: S1 S2 S3 Pivot R1 R2 R3 Copper 414.2 412.3 407.3 432.3 419.2 422.3 427.3 Aluminum 118.7 118.3 117.3 119.3 119.7 120.3 121.3 Lead 127.4 126.5 124.6 128.4 129.3 130.3 132.2 Nickel 1010.7 1004.6 987.1 1022.1 1028.2 1039.6 1057.1 Zinc 140.5 139.9 138.5 141.4 142.0 142.8 144.3 Recommendation: Copper Sell Aluminum Sell on rallies Lead Neutral Nickel Sell Zinc Buy on dips
- 5. 01st Oct’14 Aaj Ka Trend Energy MCX Crude Oct Hourly Chart: Technical Views: Crude prices initially moved higher but failed to sustain at higher levels and drifted lower in the second half of the trading session. Bias has changed to bearish as vertical fall in the crude prices suggests weakness in prices and rallies can be used as selling opportunity to test 5600/5500 levels. Close below 91.30$ on NYMEX crude can test 90.00$ in the coming trading session. MCX Natural Gas Oct Hourly Chart: Technical Views: Natural gas prices moved higher as mentioned in our previous report almost achieving our short term target. Outlook remains bullish with no change in Bias as prices have traded in sideways in the yesterdays trading session similar to bullish lag pattern which suggest move above 260 can test 265 levels with 255 can be considered as support level.
- 6. 01st Oct’14 Aaj Ka Trend Fundamental News: • Crude futures took a beating on Tuesday, the last day of the third quarter, as investors ditched the commodity on concerns that the global market is awash in crude while demand remains soft. • Investors finished the third quarter abandoning oil positions on concerns that the global oil supply remains very ample and far outstrips demand. • Oil has seen some support in the past on perceptions that the U.S. economy may offset softening demand in Europe and Asia, but a disappointing consumer confidence report released earlier exacerbated the selloff. Pivot Levels for the Day: S1 S2 S3 Pivot R1 R2 R3 Crude 5588 5502 5268 5736 5822 5970 6204 Natural Gas 211.7 231.0 226.5 235.5 216.2 240.0 244.5 Recommendation: Crude Sell on Rallies Natural Gas Buy
- 7. 01st Oct’14 Aaj Ka Trend Sumeet Bagadia (Associate Director) sumeet.bagadia@choiceindia.com Ritesh Patel (Research Associate) ritesh.patel@choiceindia.com Deveya Gaglani (Research Advisor) deveya.gaglani@chocieindia.com For Private Circulation Only Website: www.choiceindia.com https://twitter.com/ChoiceBroking http://www.slideshare.net/choiceindiabroking https://www.youtube.com/user/ChoiceBroking https://plus.google.com/115293033595831069270/posts https://www.facebook.com/pages/Choice-Equity-Broking-Pvt-Ltd/352491718249644 https://www.linkedin.com/company/choice-international-limited?trk=parent_company_logo
- 8. 01st Oct’14 Aaj Ka Trend Disclaimer This is solely for information of clients of Choice India and does not construe to be an investment advice. It is also not intended as an offer or solicitation for the purchase and sale of any financial instruments. Any action taken by you on the basis of the information contained herein is your responsibility alone and Choice India its subsidiaries or its employees or associates will not be liable in any manner for the consequences of such action taken by you. We have exercised due diligence in checking the correctness and authenticity of the information contained in this recommendation, but Choice India or any of its subsidiaries or associates or employees shall not be in any way responsible for any loss or damage that may arise to any person from any inadvertent error in the information contained in this recommendation or any action taken on basis of this information. Technical analysis studies market psychology, price patterns and volume levels. It is used to forecast future price and market movements. Technical analysis is complementary to fundamental analysis and news sources. The recommendations issued herewith might be contrary to recommendations issued by Choice India in the company research undertaken as the recommendations stated in this report is derived purely from technical analysis. Choice India has based this document on information obtained from sources it believes to be reliable but which it has not independently verified; Choice India makes no guarantee, representation or warranty and accepts no responsibility or liability as to its accuracy or completeness. The opinions contained within the report are based upon publicly available information at the time of publication and are subject to change without notice. The information and any disclosures provided herein are in summary form and have been prepared for informational purposes. The recommendations and suggested price levels are intended purely for trading purposes. The recommendations are valid for the day of the report however trading trends and volumes might vary substantially on an intraday basis and the recommendations may be subject to change. The information and any disclosures provided herein may be considered confidential. Any use, distribution, modification, copying, forwarding or disclosure by any person is strictly prohibited. The information and any disclosures provided herein do not constitute a solicitation or offer to purchase or sell any security or other financial product or instrument. The current performance may be unaudited. Past performance does not guarantee future returns. There can be no assurance that investments will achieve any targeted rates of return, and there is no guarantee against the loss of your entire investment. POTENTIAL CONFLICT OF INTEREST DISCLOSURE (as on date of report) Disclosure of interest statement – • Analyst interest of the stock /Instrument(s): - No. • Firm interest of the stock / Instrument (s): - No.
- 9. 01st Oct’14 Aaj Ka Trend