Currency highlights 29.09.14
•
0 likes•79 views

The document summarizes the technical views and economic indicators for various currency pairs including USDINR, EURINR, GBPINR, and JPYINR for 29th September 2014. It notes that USDINR is in a sideways range bounded by support at 61.35 and resistance at 61.70. EURINR remains in a strong downtrend. GBPINR is exhibiting a sideways trend. JPYINR also continues its bearish trend with prices failing to sustain at higher levels. Various technical indicators like moving averages, MACD, RSI, and ADX are highlighted for each currency pair. Economic data from the US, Eurozone, and UK are also listed with their expected impact

Recommended
More Related Content
What's hot
What's hot (20)
Viewers also liked
Similar to Currency highlights 29.09.14
Similar to Currency highlights 29.09.14 (16)
Currency highlights 29.09.14
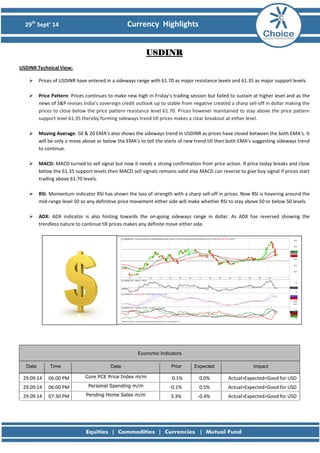
- 1. 29th Sept’ 14 Currency Highlights USDINR USDINR Technical View: Prices of USDINR have entered in a sideways range with 61.70 as major resistance levels and 61.35 as major support levels. Price Pattern: Prices continues to make new high in Friday’s trading session but failed to sustain at higher level and as the news of S&P revises India’s sovereign credit outlook up to stable from negative created a sharp sell-off in dollar making the prices to close below the price pattern resistance level 61.70. Prices however maintained to stay above the price pattern support level 61.35 thereby forming sideways trend till prices makes a clear breakout at either level. Moving Average: 50 & 20 EMA’s also shows the sideways trend in USDINR as prices have closed between the both EMA’s. It will be only a move above or below the EMA’s to tell the starts of new trend till then both EMA’s suggesting sideways trend to continue. MACD: MACD turned to sell signal but now it needs a strong confirmation from price action. If price today breaks and close below the 61.35 support levels then MACD sell signals remains valid else MACD can reverse to give buy signal if prices start trading above 61.70 levels. RSI: Momentum indicator RSI has shown the loss of strength with a sharp sell-off in prices. Now RSI is hovering around the mid-range level 50 so any definitive price movement either side will make whether RSI to stay above 50 or below 50 levels. ADX: ADX indicator is also hinting towards the on-going sideways range in dollar. As ADX has reversed showing the trendless nature to continue till prices makes any definite move either side. Economic Indicators Date Time Data Prior Expected Impact 29.09.14 06:00 PM Core PCE Price Index m/m 0.1% 0.0% Actual>Expected=Good for USD 29.09.14 06:00 PM Personal Spending m/m -0.1% 0.5% Actual>Expected=Good for USD 29.09.14 07:30 PM Pending Home Sales m/m 3.3% -0.4% Actual>Expected=Good for USD
- 2. 29th Sept’ 14 Currency Highlights EURINR EURINR Technical View: Prices of EURINR are still in a strong downtrend again prices failed to closed at higher levels as we have mentioned in earlier report. Price Pattern: EURINR prices exactly acted as mentioned in the Friday’s “Currency Highlights” report. As prices failed to sustain at higher level with sharp sell-off in EURINR confirming our previous view that downtrend continues in prices till no major upward reversal price pattern is seen. Moving Average: 50 & 20 EMA’s are also confirming the same thing of continuation of downtrend with prices are successfully closing each day below the both EMA’s confirming the downtrend till prices do not successfully close above the both EMA’s on hourly basis. MACD: MACD turned to buy signal in Friday’s trading session as prices rallied in the first half of the trading session but again reverse to give sell signal going with strong downtrend in price. RSI: RSI also acted in the similar manner with prices refusing to stay higher. RSI reversed from the over brought levels and reversed not only to show the loss of momentum but also closed below the mid-range level 50. ADX: Trend decider indicator ADX is showing the loss of strength in trend. But as soon the prices moves lower ADX will again rise to read above 25 levels showing a strong trending nature for the pair. Economic Indicators Date Time Data Prior Expected Impact 29.09.14 All Day German Prelim CPI m/m 0.0% -0.1% Actual>Expected=Good for EUR 29.09.14 12:30pm Spanish Flash CPI y/y -0.5% -0.3% Actual>Expected=Good for EUR 29.09.14 Tentative Italian 10-y Bond Auction 2.39|1.3 No consistent effect
- 3. 29th Sept’ 14 Currency Highlights GBPINR GBPINR Technical View: As mentioned in the earlier report pound prices failed to close above the technical “Rectangle” pattern giving GBPINR to resume its sideways trend. Moving Average: Pound prices are now continuous trading both above and below the 50 & 20 EMA’s giving the sideways trend for prices. Now only a definite and strong price action will make GBPINR to decide its trend with respect to both EMA’s. Till then the same sideways range to continue in GBPINR prices. MACD: MACD indicator is now giving an earlier clue for the weakness in pair. If in today’s trading session prices starts to trade below the Friday’s low of 100.13 levels then MACD sell signal will add strong confirmation. RSI: RSI on the below chart has shown the loss of momentum with prices failed to closed above technical rectangle pattern. RSI is also now reading well below the mid-range level 50 suggesting the breakout to happen in downward direction. If prices again continue to trade in sideways fashion then RSI will read between 60 to 40 levels range of the sideways market. ADX: ADX is now the only indicator strongly showing the trendless nature for the pair. As ADX is now reading at lower levels it will soon starts to read values above 25 levels with prices finally making a trending move either side. Economic Indicators Date Time Data Prior Expected Impact 29.09.14 02:00 PM Net Lending to Individuals m/m 3.4B 3.1B Actual>Expected=Good for GBP 29.09.14 02:00 PM M4 Money Supply m/m 0.3% 0.4% Actual>Expected=Good for GBP 29.09.14 02:00 PM Mortgage Approvals 67K 66K Actual>Expected=Good for GBP
- 4. 29th Sept’ 14 Currency Highlights JPYINR JPYINR Technical View: YEN prices also showed how it is failing at higher level confirming our view of strong bearishness in the pair continues. Moving Average: In Friday’s trading session prices are continuously failing to close above the 50 & 20 EMA’s on hourly chart showing the strong depreciation in yen continues till no major upward price reversal happens. MACD: MACD indicator buy signal is also on verge to reverse its signal to sell. If prices today start’s trading below the Friday’s low of 56.34 levels then MACD sell signal will add confirmation to bearishness continuation in yen prices. RSI: Momentum indicator RSI is clearly showing the ongoing bearishness in JPYINR. As RSI has again moved below the mid- range level 50 suggesting strong weakness in price. ADX: ADX indicator continues to show its trendless nature as its refusing to read at higher values. Now ADX indicator will be very watchful to get a view for the next strong trending movement in JPYINR. Economic Indicators Date Time Data Prior Expected Impact 29.09.14 No Data For JPY Today
- 5. 29th Sept’ 14 Currency Highlights Amit Pawar (Research Associate) amit.pawar@choiceindia.com Rohan Shinde (Research Associate) rohan.shinde@choiceindia.com Deveya Gaglani (Research Advisor) deveya.gaglani@chocieindia.com For Private Circulation Only Website: www.choiceindia.com https://twitter.com/ChoiceBroking http://www.slideshare.net/choiceindiabroking https://www.youtube.com/user/ChoiceBroking https://plus.google.com/115293033595831069270/posts https://www.facebook.com/pages/Choice-Equity-Broking-Pvt-Ltd/352491718249644 https://www.linkedin.com/company/choice-international-limited?trk=parent_company_logo
- 6. 29th Sept’ 14 Currency Highlights Disclaimer This is solely for information of clients of Choice India and does not construe to be an investment advice. It is also not intended as an offer or solicitation for the purchase and sale of any financial instruments. Any action taken by you on the basis of the information contained herein is your responsibility alone and Choice India its subsidiaries or its employees or associates will not be liable in any manner for the consequences of such action taken by you. We have exercised due diligence in checking the correctness and authenticity of the information contained in this recommendation, but Choice India or any of its subsidiaries or associates or employees shall not be in any way responsible for any loss or damage that may arise to any person from any inadvertent error in the information contained in this recommendation or any action taken on basis of this information. Technical analysis studies market psychology, price patterns and volume levels. It is used to forecast future price and market movements. Technical analysis is complementary to fundamental analysis and news sources. The recommendations issued herewith might be contrary to recommendations issued by Choice India in the company research undertaken as the recommendations stated in this report is derived purely from technical analysis. Choice India has based this document on information obtained from sources it believes to be reliable but which it has not independently verified; Choice India makes no guarantee, representation or warranty and accepts no responsibility or liability as to its accuracy or completeness. The opinions contained within the report are based upon publicly available information at the time of publication and are subject to change without notice. The information and any disclosures provided herein are in summary form and have been prepared for informational purposes. The recommendations and suggested price levels are intended purely for trading purposes. The recommendations are valid for the day of the report however trading trends and volumes might vary substantially on an intraday basis and the recommendations may be subject to change. The information and any disclosures provided herein may be considered confidential. Any use, distribution, modification, copying, forwarding or disclosure by any person is strictly prohibited. The information and any disclosures provided herein do not constitute a solicitation or offer to purchase or sell any security or other financial product or instrument. The current performance may be unaudited. Past performance does not guarantee future returns. There can be no assurance that investments will achieve any targeted rates of return, and there is no guarantee against the loss of your entire investment. POTENTIAL CONFLICT OF INTEREST DISCLOSURE (as on date of report) Disclosure of interest statement – • Analyst interest of the stock /Instrument(s): - No. • Firm interest of the stock / Instrument (s): - No.