Equity bazaar 07.10.14
•
0 likes•55 views

The document provides a technical analysis of the Nifty, Bank Nifty, and Petronet LNG stock. For Nifty and Bank Nifty, it notes they traded in a narrow range and are below their 50 and 100 EMAs, with the MACD signaling a downtrend. It recommends selling Nifty below 7950 and Bank Nifty below 15350. For Petronet LNG, it observes a bearish flag pattern forming and recommends selling below 188, with support at 175.

Recommended
More Related Content
Viewers also liked
Viewers also liked (16)
Similar to Equity bazaar 07.10.14
Similar to Equity bazaar 07.10.14 (20)
Equity bazaar 07.10.14
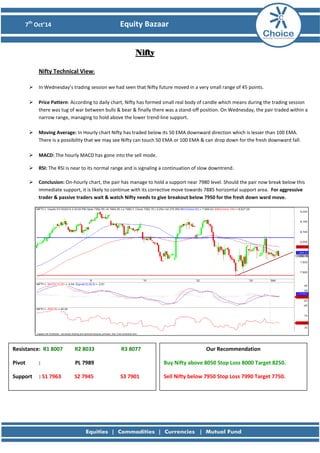
- 1. 7th Oct’14 Equity Bazaar Nifty Nifty Technical View: In Wednesday’s trading session we had seen that Nifty future moved in a very small range of 45 points. Price Pattern: According to daily chart, Nifty has formed small real body of candle which means during the trading session there was tug of war between bulls & bear & finally there was a stand-off position. On Wednesday, the pair traded within a narrow range, managing to hold above the lower trend-line support. Moving Average: In Hourly chart Nifty has traded below its 50 EMA downward direction which is lesser than 100 EMA. There is a possibility that we may see Nifty can touch 50 EMA or 100 EMA & can drop down for the fresh downward fall. MACD: The hourly MACD has gone into the sell mode. RSI: The RSI is near to its normal range and is signaling a continuation of slow downtrend. Conclusion: On-hourly chart, the pair has manage to hold a support near 7980 level. Should the pair now break below this immediate support, it is likely to continue with its corrective move towards 7885 horizontal support area. For aggressive trader & passive traders wait & watch Nifty needs to give breakout below 7950 for the fresh down ward move. Resistance: R1 8007 R2 8033 R3 8077 Pivot : PL 7989 Support : S1 7963 S2 7945 S3 7901 Our Recommendation Buy Nifty above 8050 Stop Loss 8000 Target 8250. Sell Nifty below 7950 Stop Loss 7990 Target 7750.
- 2. 7th Oct’14 Equity Bazaar Bank Nifty Bank Nifty Technical View: Wednesday’s Bank Nifty future opened down and moved narrow range for the whole trading day before the last hour where we saw some selling to make day low and give closing around 15375. Price Pattern: Bank Nifty has formed small real body of candle which means during trading session none of buyers and sellers were ready to dominate the market. Moving Average: In hourly chart, The Bank Nifty is trading below the 50 EMA & 100 EMA. The 50 EMA has been acting as instant resistance. MACD: The hourly MACD has yet to confirm the selling crossover. RSI: The RSI is near to its normal range and is signaling a continuation of slow downtrend. Conclusion: Bank Nifty could trade in narrow range. The Bank Nifty is currently consolidating around this level. The strong resistance is at 15741 (100 EMA) levels & lower support of 15375 levels as shown by the red upward line. The charts suggest that the stock has given breakout & down fall can continue but for confirmation one should wait for breakout below 15375 levels for belligerent trader & for flaccid traders wait & watch policy is good in this situation. Resistance: R1 15451 R2 15528 R3 15654 Pivot : PL 15401 Support : S1 15325 S2 15276 S3 15150 Our Recommendation Buy BNF above 15500 Stop Loss 15450 Target: 15900. Sell BNF below 15350 Stop Loss 15450 Target: 15000.
- 3. 7th Oct’14 Equity Bazaar Stock of the Day Petronet LNG Bank View: After a sharp correction in Petronet LNG’s is in short term uptrend and closed above it’s 50 hour EMA. Chart Pattern: On hourly chart, the pair now seems to be forming a “Bearish Flag Pattern” which marks distribution in a narrow range before sharp down move. Hence, from current levels upside seems limited till Rs.195 levels strong resistance, encompassing a psychological level and 61.8% Fibonacci Retracement. Moving Average: In Hourly chart Petronet LNG has traded in between narrow range of its 50 & 100 EMA. MACD: The MACD on the hourly charts has turned into quite positive divergence (12days sma trades above 26 days sma) with could be a sign of distribution. RSI: RSI reversed from oversold region, supported by little short covering. Conclusion: The charts suggest that Petronet LNG trades in sinking track consequently spring can be used as selling but the stock has given breakout on down side so wait for breakout & then opportunities to test sophisticated levels for the day. For short term there is a possibility of down fall rally and the next support would be watch around Rs.175 level. Resistance : R1 193 R2 196 R3 202 Pivot : PL190 Support : S1 187 S2 184 S3 178 Our Recommendation Sell Petronet LNG below 188 Stop Loss 195 Target: 175
- 4. 7th Oct’14 Equity Bazaar Derivative Analysis FIIS Data: FII’s are the net Seller on 1st October 2014 is Rs 63.24 Cr and Dll’s are the net Buyer on 1st October 2014 is Rs 155.69 Cr. Option Data: 8200 CE has the highest OI with 54 lakhs and 8100 CE has the second highest OI with 49 lakhs and 7800 PE has the highest OI with 58 lakhs and 7900 PE has the second highest OI with 47 lakhs. Open Interest: The above options data shows nifty has now a strong support at 7900 and resistance at 8100 the trend change level as per option data is 8000. Intraday Option Strategy: (A) Buy Nifty 7900 calls and Sell Nifty 8200 puts if buy level is breached. (B) Sell Nifty 8200 calls and Buy Nifty 7800 puts if sell level is breached.
- 5. 7th Oct’14 Equity Bazaar S3S2S1PR1R2R3TrendActionACC 1342.431370.181380.921397.931408.671425.681453.43DownSellAMBUJACEM 203.05207.35209.00211.65213.30215.95220.25DownSellASIANPAINT 606.45619.5625.60632.55638.65645.60658.65DownSellAXISBANK 363.48370.98375.47378.48382.97385.98393.48UPBuyBAJAJ-AUTO 2260.782303.132319.622345.482361.972387.832430.18DownSellBANKBARODA 845.68871.03884.82896.38910.17921.73947.08SidewayNo ActionBHEL 192.63196.38197.92200.13201.67203.88207.63DownSellBPCL 626.83641.38647.12655.93661.67670.48685.03DownSellBHARTIARTL 392.7398.4400.80404.10406.50409.80415.50DownSellCAIRN 286.3296.55300.15306.80310.40317.05327.30DownSellCIPLA 605615.3619.80625.60630.10635.90646.20DownSellCOALINDIA 332.45338.5341.55344.55347.60350.60356.65UPBuyDLF 144147.4148.90150.80152.30154.20157.60DownSellDRREDDY 3057.83140.83170.603223.803253.603306.803389.80DownSellGAIL 411.72427.47433.18443.22448.93458.97474.72DownSellGRASIM 3342.33426.153460.003510.003543.853593.853677.70DownSellHCLTECH 1652.031694.181717.171736.331759.321778.481820.63UPBuyHDFCBANK 845.25855.9861.95866.55872.60877.20887.85UPBuyHEROMOTOCO 2733.92809.152842.052884.402917.302959.653034.90DownSellHINDALCO 143.93149.68152.47155.43158.22161.18166.93DownSellHINDUNILVR 709.08724.28730.22739.48745.42754.68769.88DownSellHDFC 1013.451031.451040.901049.451058.901067.451085.45UPBuyITC 352.52359.17361.63365.82368.28372.47379.12DownSellICICIBANK 1382.281406.281417.571430.281441.571454.281478.28DownSellIDFC 128.4132.65134.45136.90138.70141.15145.40DownSellINDUSINDBK 566.18587.08594.47607.98615.37628.88649.78DownSellINFY 3533.853671.83759.553809.753897.503947.704085.65UPBuyJINDALSTEL 151.5160.8165.80170.10175.10179.40188.70SidewayNo ActionKOTAKBANK 982.53995.881003.771009.231017.121022.581035.93UPBuyLT 1401.381426.881436.871452.381462.371477.881503.38DownSellLUPIN 1345.371367.471377.131389.571399.231411.671433.77DownSellM&M 1298.221339.221364.431380.221405.431421.221462.22UPBuyMARUTI 2763.172883.922927.433004.673048.183125.423246.17DownSellNMDC 157.6161.75164.35165.90168.50170.05174.20UPBuyNTPC 135.52137.42138.23139.32140.13141.22143.12DownSellONGC 387.4396.05399.45404.70408.10413.35422DownSellPOWERGRID 129.62132.92134.43136.22137.73139.52142.82DownSellPNB 843.08861.08870.17879.08888.17897.08915.08SidewayNo ActionRELIANCE 893.73913.33920.27932.93939.87952.53972.13DownSellSSLT 259.05265.7268.30272.35274.95279.00285.65DownSellSBIN 2346.252388.052405.702429.852447.502471.652513.45DownSellSUNPHARMA 826.65842.6851.70858.55867.65874.50890.45UPBuyTCS 2641.532706.532741.072771.532806.072836.532901.53UPBuyTATAMOTORS 486.83494.98498.87503.13507.02511.28519.43SidewayNo ActionTATAPOWER 75.378.479.6081.5082.7084.6087.70DownSellTATASTEEL 426.77438.67443.73450.57455.63462.47474.37DownSellTECHM 2369.5524402480.402510.452550.852580.902651.35UPBuyULTRACEMCO 2570.152607.052627.902643.952664.802680.852717.75UPBuyWIPRO 571.4590.95603.35610.50622.90630.05649.60UPBuyZEEL 298.03305.73309.62313.43317.32321.13328.83SidewayNo Action
- 6. 7th Oct’14 Equity Bazaar Amit Pawar (Research Associate) amit.pawar@choiceindia.com Rohan Shinde (Research Associate) rohan.shinde@choiceindia.com Deveya Gaglani (Research Advisor) deveya.gaglani@chocieindia.com For Private Circulation Only Website: www.choiceindia.com https://twitter.com/ChoiceBroking https://www.youtube.com/user/ChoiceBroking http://www.slideshare.net/choiceindiabroking https://plus.google.com/115293033595831069270/posts https://www.facebook.com/pages/Choice-Equity-Broking-Pvt-Ltd/352491718249644 https://www.linkedin.com/company/choice-international-limited?trk=parent_company_logo
- 7. 7th Oct’14 Equity Bazaar Disclaimer This is solely for information of clients of Choice India and does not construe to be an investment advice. It is also not intended as an offer or solicitation for the purchase and sale of any financial instruments. Any action taken by you on the basis of the information contained herein is your responsibility alone and Choice India its subsidiaries or its employees or associates will not be liable in any manner for the consequences of such action taken by you. We have exercised due diligence in checking the correctness and authenticity of the information contained in this recommendation, but Choice India or any of its subsidiaries or associates or employees shall not be in any way responsible for any loss or damage that may arise to any person from any inadvertent error in the information contained in this recommendation or any action taken on basis of this information. Technical analysis studies market psychology, price patterns and volume levels. It is used to forecast future price and market movements. Technical analysis is complementary to fundamental analysis and news sources. The recommendations issued herewith might be contrary to recommendations issued by Choice India in the company research undertaken as the recommendations stated in this report is derived purely from technical analysis. Choice India has based this document on information obtained from sources it believes to be reliable but which it has not independently verified; Choice India makes no guarantee, representation or warranty and accepts no responsibility or liability as to its accuracy or completeness. The opinions contained within the report are based upon publicly available information at the time of publication and are subject to change without notice. The information and any disclosures provided herein are in summary form and have been prepared for informational purposes. The recommendations and suggested price levels are intended purely for trading purposes. The recommendations are valid for the day of the report however trading trends and volumes might vary substantially on an intraday basis and the recommendations may be subject to change. The information and any disclosures provided herein may be considered confidential. Any use, distribution, modification, copying, forwarding or disclosure by any person is strictly prohibited. The information and any disclosures provided herein do not constitute a solicitation or offer to purchase or sell any security or other financial product or instrument. The current performance may be unaudited. Past performance does not guarantee future returns. There can be no assurance that investments will achieve any targeted rates of return, and there is no guarantee against the loss of your entire investment. POTENTIAL CONFLICT OF INTEREST DISCLOSURE (as on date of report) Disclosure of interest statement – • Analyst interest of the stock /Instrument(s): - No. • Firm interest of the stock / Instrument (s): - No.