
Recommended
More Related Content
What's hot
What's hot (20)
Similar to Equities Commodities Currencies Trend
Similar to Equities Commodities Currencies Trend (20)
Recently uploaded
Recently uploaded (20)
Equities Commodities Currencies Trend
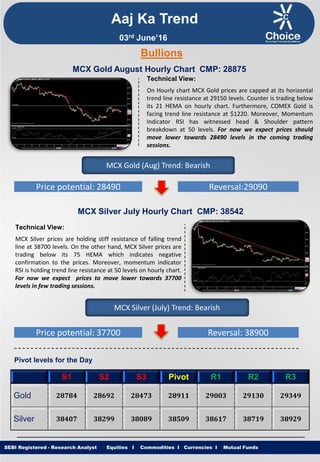
- 1. Equities I Commodities I Currencies I Mutual Funds Aaj Ka Trend Technical View: On Hourly chart MCX Gold prices are capped at its horizontal trend line resistance at 29150 levels. Counter is trading below its 21 HEMA on hourly chart. Furthermore, COMEX Gold is facing trend line resistance at $1220. Moreover, Momentum Indicator RSI has witnessed head & Shoulder pattern breakdown at 50 levels. For now we expect prices should move lower towards 28490 levels in the coming trading sessions. SEBI Registered - Research Analyst Equities I Commodities I Currencies I Mutual Funds Bullions MCX Gold August Hourly Chart CMP: 28875 MCX Gold (Aug) Trend: Bearish Price potential: 28490 Reversal:29090 MCX Silver July Hourly Chart CMP: 38542 Technical View: MCX Silver prices are holding stiff resistance of falling trend line at 38700 levels. On the other hand, MCX Silver prices are trading below its 75 HEMA which indicates negative confirmation to the prices. Moreover, momentum indicator RSI is holding trend line resistance at 50 levels on hourly chart. For now we expect prices to move lower towards 37700 levels in few trading sessions. MCX Silver (July) Trend: Bearish Price potential: 37700 Reversal: 38900 Pivot levels for the Day S1 S2 S3 Pivot R1 R2 R3 Gold 28784 28692 28473 28911 29003 29130 29349 Silver 38407 38299 38089 38509 38617 38719 38929 03rd June’16
- 2. Equities I Commodities I Currencies I Mutual Funds Technical View: On Hourly chart MCX Copper has taken support of its horizontal trend line at 307.80 levels. Furthermore, Counter is trading above its 21 HEMA on hourly time frame. Moreover, Hammer Bullish candlestick pattern is visible on daily chart. On the other hand, momentum indicator RSI is showing strength near its support of 40 levels on hourly chart. For now we expect prices to move higher towards 318 levels in coming trading sessions. SEBI Registered - Research Analyst Equities I Commodities I Currencies I Mutual Funds MCX Copper June hourly Chart CMP: 309.10 MCX Copper (June) Trend: Bullish Price potential: 318 Reversal: 305 MCX Crude Oil June. Hourly Chart CMP: 3314 Technical View: On Hourly chart MCX Crude Oil prices have given breakdown of its rising channel formation at 3277 levels. Counter has retest its trend line resistance till 3331 levels. On the other hand counter is trading below its 100 HEMA on MCX Crude Oil hourly chart. Moreover, Momentum indicator RSI is facing trend line resistance at 50 levels on hourly chart. For now we expect prices to move lower towards 3225 levels in coming trading sessions. MCX Crude Oil (June) Trend: Bearish Price potential: 3225 Reversal: 3365 Pivot levels for the Day S1 S2 S3 Pivot R1 R2 R3 Copper 308.7 307.3 305.1 309.4 310.8 311.6 313.7 Crude 3257 3205 3116 3294 3346 3383 3472 Base Metal Energy Aaj Ka Trend 03rd June’16
- 3. Equities I Commodities I Currencies I Mutual FundsSEBI Registered - Research Analyst Equities I Commodities I Currencies I Mutual Funds Other Base Metals & Energy S1 S2 S3 Pivot R1 R2 R3 Trend Copper 308.7 307.3 305.1 309.4 310.8 311.6 313.7 Aluminum 103.1 102.2 99.6 104.8 105.7 107.4 110.0 Lead 115.1 114.3 112.3 116.4 117.2 118.4 120.5 Nickel 569.1 565.1 558.2 572.0 576.0 578.9 585.8 Zinc 132.2 131.3 129.1 133.5 134.4 135.7 137.9 Natural Gas 155.6 151.4 144.7 158.1 162.3 164.8 171.5 Fundamental News: Gold rose slightly in early Asia on Thursday as investors continued to assess the prospects of a rate hike as early as this month by the Federal Reserve. Gold futures inched higher in European trade on Thursday, reversing modest overnight losses as market players looked ahead to key U.S. employment data for more clues on the Federal Reserve’s next move. U.S. private employers increased hiring in May and new applications for jobless benefits fell last week, further boosting the economic outlook for the second quarter. Another report on Thursday showed planned layoffs by U.S.-based employers fell 53 percent to a five-month low last month. The steady stream of upbeat data suggest the economy is regaining momentum after growth slowed sharply at the start of the year, which could allow the Federal Reserve to raise interest rates later this month or in July. Gold futures stayed higher in North American trade on Thursday, as investors digested a pair of U.S. employment reports for clues about the Federal Reserve's next interest rate hike. Oil prices reversed gains in North American trade on Thursday, falling to the lowest levels of the session after a key meeting of major oil producers in Vienna ended without an agreement to limit production. As widely expected, the Organization of the Petroleum Exporting Countries(OPEC) failed to place a ceiling on oil production at their meeting on Thursday in Vienna. West Texas Intermediate oil futures pulled further back from intraday lows in North America trade on Thursday, after data showed that oil supplies in the U.S. fell less than expected. As crude prices plummeted last summer, Steve Pruett, chief executive of a small west Texas oilfield developer, idled a drilling rig, opting to pay $21,000 a day to store it rather than dig more wells and risk bigger losses. Aaj Ka Trend 03rd June’16
- 4. Equities I Commodities I Currencies I Mutual FundsSEBI Registered - Research Analyst Equities I Commodities I Currencies I Mutual Funds International Market Commodity Closing Price Gold 1210.41 Silver 15.98 Crude Oil 49.12 Brent Crude Oil 50.03 Natural Gas 2.41 COMEX/NYMEX/ICE ( Precious Metals & Energy) Currency & Commodity Index Currency (Spot) Current Price USD / INR 67.29 Dollar Index 95.56 EUR / USD 1.1152 CRB Index* 188.02 Closing as on 02.06.16 *Closing as on 02.06.16 LME (Base Metals) ( $ per tones) Commodity Closing Price Copper 4608 Aluminum 1540 Zinc 1982 Lead 1706 Nickel 8379 SHFE (Base Metals) (Yuan per tones) Commodity Closing Price Copper 35430 Aluminum 11890 Zinc 15050 Lead 12750 Closing as on 02.06.16 Closing as on 02.06.16 LME INVENTORY DATA Aaj Ka Trend 27-May-16 30-May-16 31-May-16 01-June-16 02-June-16 Aluminium -5900 0 -4900 -8925 -4500 Copper -2225 0 -2025 2625 -825 Lead -25 0 225 -100 -100 Nickel 1848 0 -978 -258 -1500 Zinc -2025 0 -2300 -250 -1725 03rd June’16
- 5. Equities I Commodities I Currencies I Mutual Funds This is solely for information of clients of Choice Broking and does not construe to be an investment advice. It is also not intended as an offer or solicitation for the purchase and sale of any financial instruments. Any action taken by you on the basis of the information contained herein is your responsibility alone and Choice Broking its subsidiaries or its employees or associates will not be liable in any manner for the consequences of such action taken by you. We have exercised due diligence in checking the correctness and authenticity of the information contained in this recommendation, but Choice Broking or any of its subsidiaries or associates or employees shall not be in any way responsible for any loss or damage that may arise to any person from any inadvertent error in the information contained in this recommendation or any action taken on basis of this information. Technical analysis studies market psychology, price patterns and volume levels. It is used to forecast future price and market movements. Technical analysis is complementary to fundamental analysis and news sources. The recommendations issued herewith might be contrary to recommendations issued by Choice Broking in the company research undertaken as the recommendations stated in this report is derived purely from technical analysis. Choice Broking has based this document on information obtained from sources it believes to be reliable but which it has not independently verified; Choice Broking makes no guarantee, representation or warranty and accepts no responsibility or liability as to its accuracy or completeness. The opinions contained within the report are based upon publicly available information at the time of publication and are subject to change without notice. The information and any disclosures provided herein are in summary form and have been prepared for informational purposes. The recommendations and suggested price levels are intended purely for trading purposes. The recommendations are valid for the day of the report however trading trends and volumes might vary substantially on an intraday basis and the recommendations may be subject to change. The information and any disclosures provided herein may be considered confidential. Any use, distribution, modification, copying, forwarding or disclosure by any person is strictly prohibited. The information and any disclosures provided herein do not constitute a solicitation or offer to purchase or sell any security or other financial product or instrument. The current performance may be unaudited. Past performance does not guarantee future returns. There can be no assurance that investments will achieve any targeted rates of return, and there is no guarantee against the loss of your entire investment. POTENTIAL CONFLICT OF INTEREST DISCLOSURE (as on date of report) Disclosure of interest statement – • Analyst interest of the stock /Instrument(s): - No. • Firm interest of the stock / Instrument (s): - No. Disclaimer Contact Us Amit Pathania Research Associate amit.pathania@choiceindia.com Rohan Patil Research Associate rohan.patil@choiceindia.com www.choiceindia.comcustomercare@choiceindia.com SEBI Registered - Research Analyst Equities I Commodities I Currencies I Mutual Funds Aaj Ka Trend 03rd June’16 Neeraj Yadav Research Advisor neeraj.yadav@choiceindia.com Anish Vyas Senior Research Associate anish.vyas@choiceindia.com Amit Pathania Digitally signed by Amit Pathania DN: cn=Amit Pathania, o=Choice Equity Broking Pvt. ltd, ou=Research Department, email=amit.pathania@choiceindia.com, c=IN Date: 2016.06.03 08:43:12 +05'30'