
Recommended
More Related Content
What's hot
What's hot (20)
Viewers also liked
Viewers also liked (18)
Similar to Currency high lights 30.09.16
Similar to Currency high lights 30.09.16 (20)
Recently uploaded
Recently uploaded (20)
Currency high lights 30.09.16
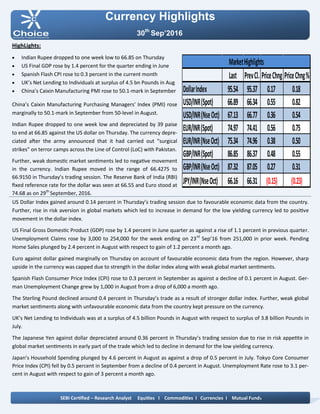
- 1. Currency Highlights 30th Sep’2016 HighLights: Indian Rupee dropped to one week low to 66.85 on Thursday US Final GDP rose by 1.4 percent for the quarter ending in June Spanish Flash CPI rose to 0.3 percent in the current month UK’s Net Lending to Individuals at surplus of 4.5 bn Pounds in Aug China’s Caixin Manufacturing PMI rose to 50.1-mark in September China’s Caixin Manufacturing Purchasing Managers' Index (PMI) rose marginally to 50.1-mark in September from 50-level in August. Indian Rupee dropped to one week low and depreciated by 39 paise to end at 66.85 against the US dollar on Thursday. The currency depre- ciated after the army announced that it had carried out "surgical strikes" on terror camps across the Line of Control (LoC) with Pakistan. Further, weak domestic market sentiments led to negative movement in the currency. Indian Rupee moved in the range of 66.4275 to 66.9150 in Thursday’s trading session. The Reserve Bank of India (RBI) fixed reference rate for the dollar was seen at 66.55 and Euro stood at 74.68 as on 29th September, 2016. US Dollar Index gained around 0.14 percent in Thursday’s trading session due to favourable economic data from the country. Further, rise in risk aversion in global markets which led to increase in demand for the low yielding currency led to positive movement in the dollar index. US Final Gross Domestic Product (GDP) rose by 1.4 percent in June quarter as against a rise of 1.1 percent in previous quarter. Unemployment Claims rose by 3,000 to 254,000 for the week ending on 23rd Sep’16 from 251,000 in prior week. Pending Home Sales plunged by 2.4 percent in August with respect to gain of 1.2 percent a month ago. Euro against dollar gained marginally on Thursday on account of favourable economic data from the region. However, sharp upside in the currency was capped due to strength in the dollar index along with weak global market sentiments. Spanish Flash Consumer Price Index (CPI) rose to 0.3 percent in September as against a decline of 0.1 percent in August. Ger- man Unemployment Change grew by 1,000 in August from a drop of 6,000 a month ago. The Sterling Pound declined around 0.4 percent in Thursday’s trade as a result of stronger dollar index. Further, weak global market sentiments along with unfavourable economic data from the country kept pressure on the currency. UK’s Net Lending to Individuals was at a surplus of 4.5 billion Pounds in August with respect to surplus of 3.8 billion Pounds in July. The Japanese Yen against dollar depreciated around 0.36 percent in Thursday’s trading session due to rise in risk appetite in global market sentiments in early part of the trade which led to decline in demand for the low yielding currency. Japan’s Household Spending plunged by 4.6 percent in August as against a drop of 0.5 percent in July. Tokyo Core Consumer Price Index (CPI) fell by 0.5 percent in September from a decline of 0.4 percent in August. Unemployment Rate rose to 3.1 per- cent in August with respect to gain of 3 percent a month ago. SEBI Certified – Research Analyst Equities I Commodities I Currencies I Mutual Funds Last PrevCl. PriceChng PriceChng% DollarIndex 95.54 95.37 0.17 0.18 USD/INR(Spot) 66.89 66.34 0.55 0.82 USD/INR(NseOct) 67.13 66.77 0.36 0.54 EUR/INR(Spot) 74.97 74.41 0.56 0.75 EUR/INR(NseOct) 75.34 74.96 0.38 0.50 GBP/INR(Spot) 86.85 86.37 0.48 0.55 GBP/INR(NseOct) 87.32 87.05 0.27 0.31 JPY/INR(NseOct) 66.16 66.31 (0.15) (0.23) MarketHighlights
- 2. Technical View: On daily chart JPYINR prices have been trading in sym- metrical triangle pattern. However, price has faced re- sistance near 67.10 levels on daily chart. Moreover, any further movement can been seen in the prices if JPYINR has given breakout above 67.10 levels o daily chart. Furthermore, prices have been trading above its 50 DE- MA, which suggest medium term trend is positive. On daily chart momentum indicator RSI reading is at 55 levels which is also strong horizontal support now its point out for positive breath in the pair. So for trading perspective, one could use buy above level of 67.10 with SL of 66.50 for Target of 67.80. Pivot levels for the Day Technical View: On daily USDINR prices have been trading in falling channel formation from past few weeks. The pair has formed bearish candle stick with appealing volumes. On the other hand, prices have been facing resistance of its upper band of channel pattern at 67.10 levels on dai- ly. Moreover, prices have been trading below 21 DEMA which gives the sign of bearishness in the prices. A momentum indictor RSI has traded below 40 levels, which suggest further weakness in the prices. So for trading perspective, one could sell in range 67.20 with SL of 67.50 for target of 66.40 Currency Highlights 30th Sep’2016 USDINR JPYINR SEBI Certified – Research Analyst Equities I Commodities I Currencies I Mutual Funds S3 S2 S1 Pivot R1 R2 R3 USDINR 65.93 66.47 66.80 67.01 67.34 67.55 68.09 JPYINR 64.97 65.52 65.84 66.07 66.39 66.62 67.17
- 3. Pivot levels for the Day Currency Highlights 30th Sep’2016 GBPINR EURINR Technical View: On daily chart EURINR price have been trading in descending triangle pattern from past months. On the other hand, price has taken support near its lower band of triangle pattern at 74.20 levels on daily chart. Moreover, prices have been trading above its 21 DE- MA, which suggest short term trend remains bullish. On daily chart momentum oscillator RSI have been trad- ing above 40 which suggest bullishness in the prices. A momentum indicator MACD has shown positive cross- over on daily chart, which add more bullishness in the prices. For now we can expect prices should move higher to- wards 75.90 levels in the coming trading session. Technical View: On daily GBPINR price has been trading in falling chan- nel pattern and price has faced resistance near 88 levels on daily chart. Moreover, prices have been trading below 21 DEMA, which suggest short term trend remains weak. The price has given breakdown of horizontal trend line at 87.30 levels on daily chart. A momentum indicator MADC has given negative Cross over on daily chart, which gives the sign of bearishness in the prices. The momentum indictor RSI has been trading below 40 levels on daily chart. Which suggest lack of strength in the prices. For now we expect prices should move lower towards 86.40 levels coming trading sessions. SEBI Certified – Research Analyst Equities I Commodities I Currencies I Mutual Funds S3 S2 S1 Pivot R1 R2 R3 GBPINR 86.00 86.66 87.02 87.32 87.68 87.98 88.64 EURINR 74.28 74.77 75.05 75.26 75.54 75.75 76.24
- 4. Currency Highlights SEBI Certified – Research Analyst Equities I Commodities I Currencies I Mutual Funds 30th Sep’2016 Economic Indicators Date Time Data Prior Expected Impact 30.09.16 1:30 AM Fed Chair Yellen Speaks 0.0% 0.0% More hawkish than expected = Good for currency ; 30.09.16 5:30 AM BOJ Gov Kuroda Speaks More hawkish than expected = Good for currency; 30.09.16 7:15 AM Caixin Manufacturing PMI 50 51 Actual > Forecast = Good for currency; 30.09.16 2:00 PM Current Account -32.6B -30.5B Actual > Forecast = Good for currency; GBPINR 30.09.16 6:00 PM GDP m/m 0.6% Actual > Forecast = Good for currency; GBPINR 30.09.16 7:15 PM Chicago PMI 51.5 52.1 Actual > Forecast = Good for currency; USDINR 30.09.16 7:30 PM Revised UoM Consumer Sentiment 89.8 90.10 Actual > Forecast = Good for currency; USDINR 30.09.16 7:30 PM Revised UoM Inflation Ex- pectations 2.3% Actual > Forecast = Good for currency; USDINR
- 5. Currency Highlights 30th Sep’2016 SEBI Certified – Research Analyst Equities I Commodities I Currencies I Mutual Funds Amit Pathania Digitally signed by Amit Pathania DN: cn=Amit Pathania, o=Choice Equity Broking Pvt. ltd, ou=Research Department, email=amit.pathania@choiceindia.com, c=IN Date: 2016.09.30 09:05:27 +05'30'