Downloaded 5,718 times
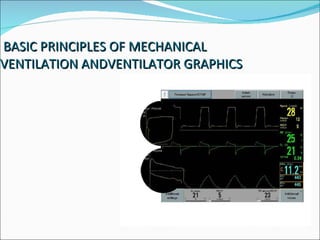
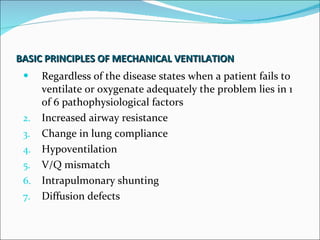
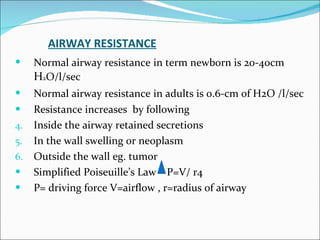
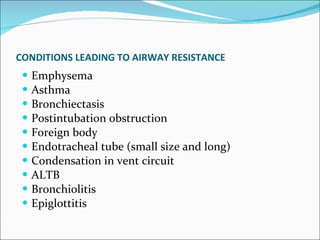
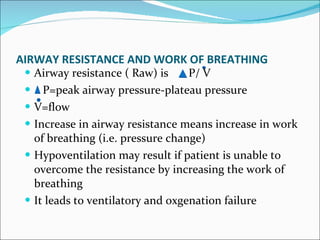
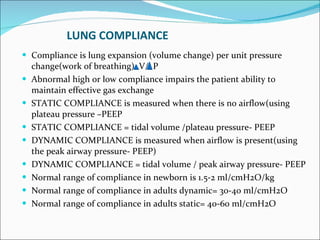
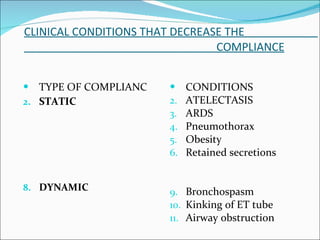
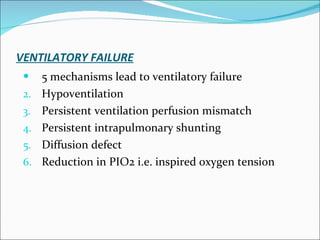
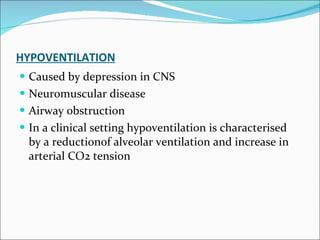
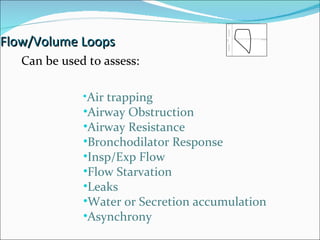
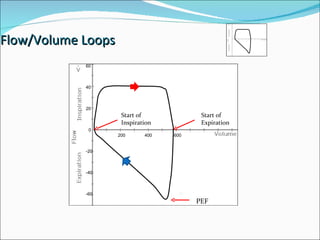
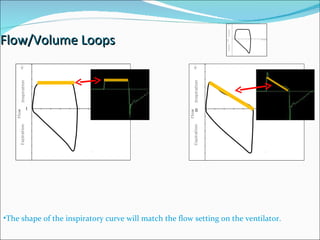
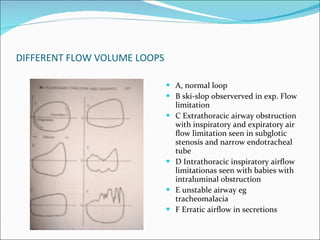


The document discusses basic principles of mechanical ventilation including factors that can lead to ventilatory failure, airway resistance, lung compliance, hypoventilation, V/Q mismatch, intrapulmonary shunting, and diffusion defects. It also covers different types of ventilator waveforms including pressure, volume, flow and pressure/volume loops which can be used to assess a patient's respiratory status and response to therapy.


