Downloaded 304 times
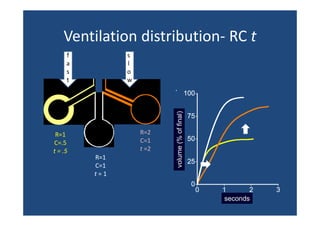
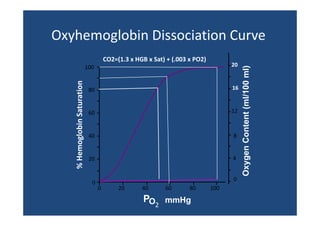
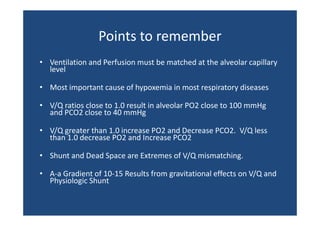
![Local ↑ V/Q above ~1 has minimal
effect on [O2]
160
23
PaO2
(mmHg)
O2
content
21 ( /
(ml/100 ml)
)
22
120
20
80
19
18
40
17
16
0
0.001
0.01
0.1
1
10
V/Q
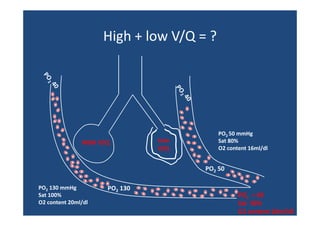
Thus ↑ V/Q in one part of lung can’t compensate for ↓ elsewhere
15
100](https://image.slidesharecdn.com/ventilation-perfusion-ratio-and-clinical-importance-131215104418-phpapp02/85/Pneumology-Ventilation-perfusion-ratio-and-clinical-importance-19-320.jpg)
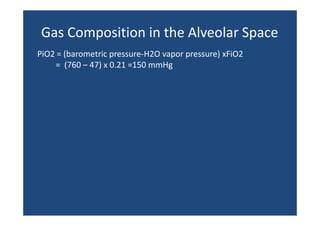
![Shunt equation
Shunt equation
Qt x CaO2 = [(Qt – Qs) x Cc’O2] + [Qs x CvO2]
Qs Cc ' O2 − CaO 2
=
Qt Cc ' O2 − CvO 2](https://image.slidesharecdn.com/ventilation-perfusion-ratio-and-clinical-importance-131215104418-phpapp02/85/Pneumology-Ventilation-perfusion-ratio-and-clinical-importance-28-320.jpg)


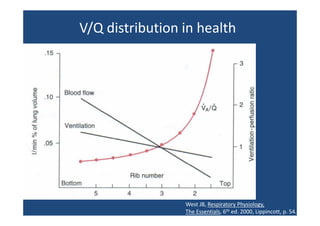
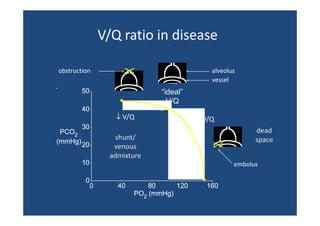
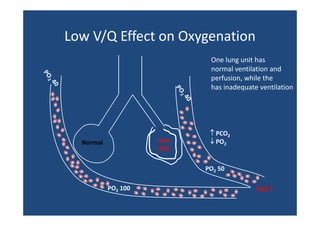
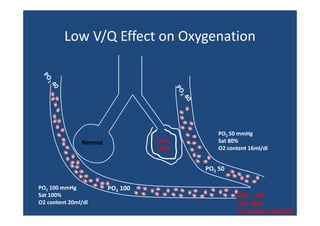
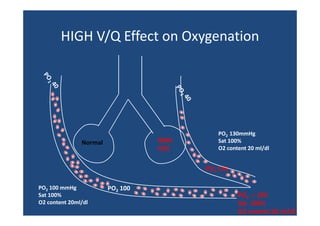
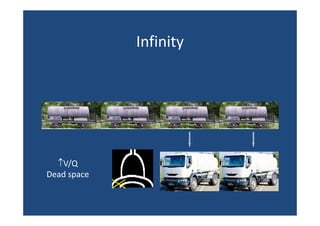
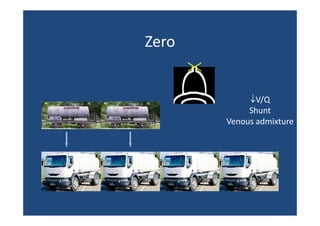
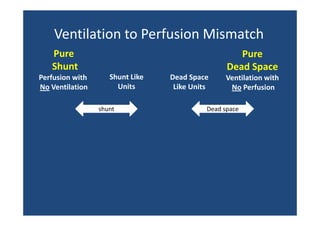
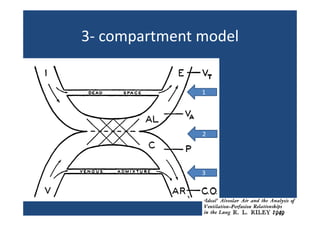
The document discusses ventilation-perfusion (V/Q) relationships in health and disease, highlighting the spatial and physiological variations in ventilation and blood flow in the lungs. It emphasizes the impacts of V/Q mismatches on gas exchange, explaining how different ratios of ventilation to perfusion affect oxygen and carbon dioxide levels in the blood. Clinical implications of V/Q ratios are outlined, including causes of hypoxemia and the effects of gravity and other factors on lung perfusion.


![PERI-PROSTHETIC FRACTURE NAIL-PLATE CONSTRUCT [NPC].pptx](https://cdn.slidesharecdn.com/ss_thumbnails/drarunkumardrmohamedashrafperiprostheticfrasturenail-plateconstructnpc-260209164459-7e9d15a1-thumbnail.jpg?width=640&height=640&fit=bounds)


