Downloaded 329 times


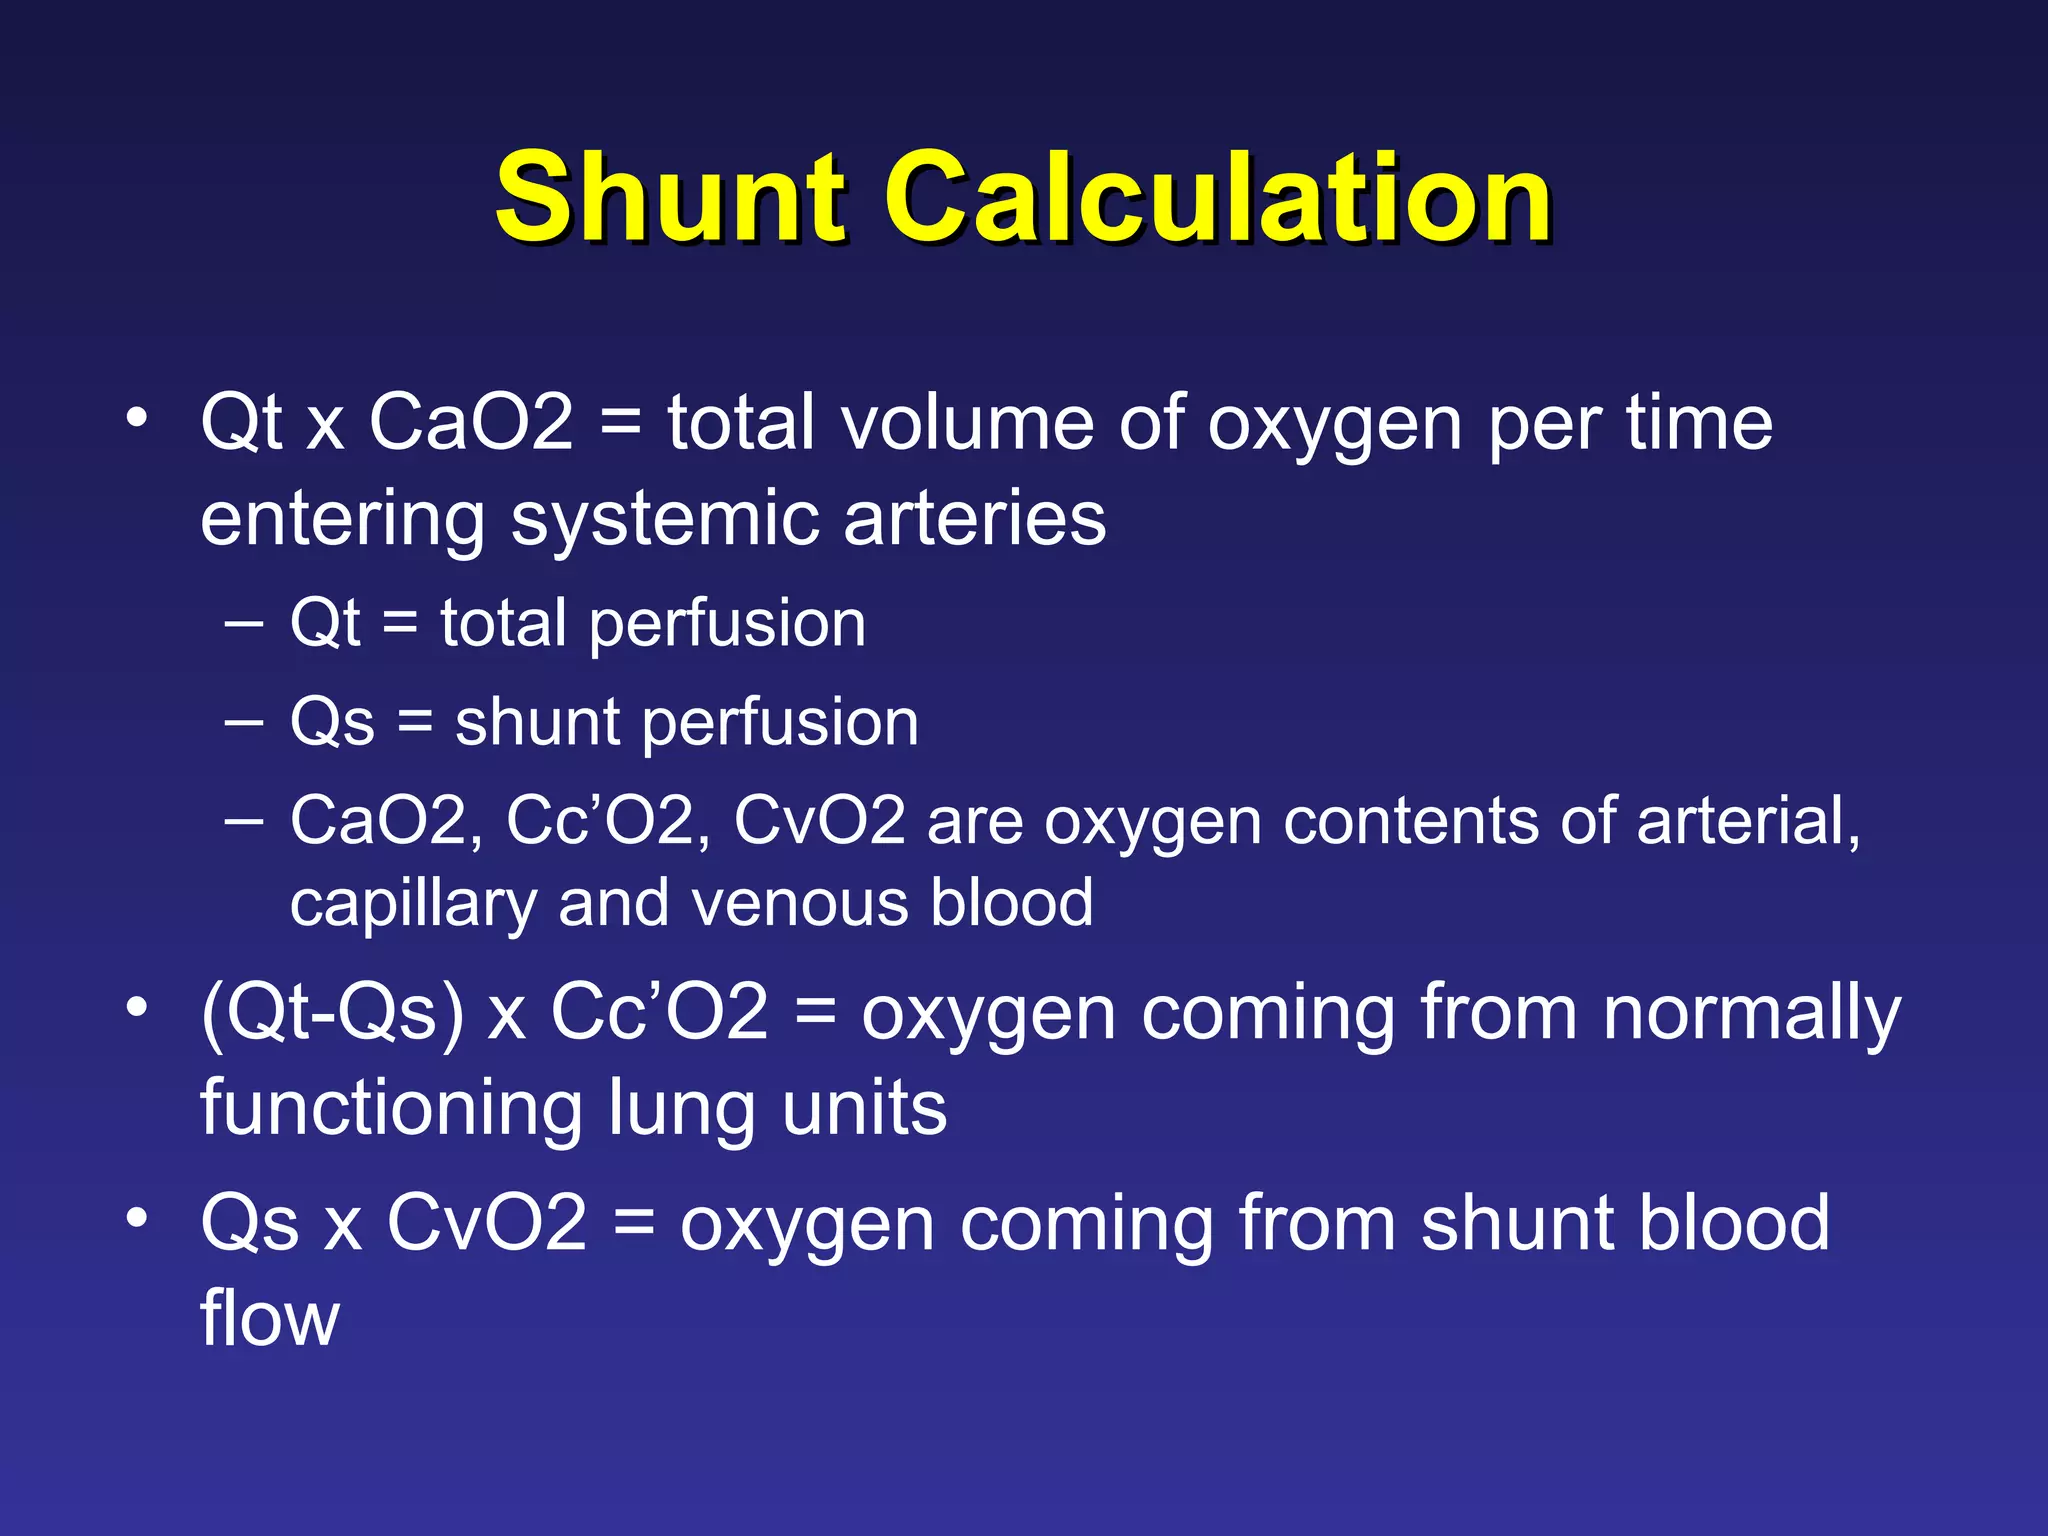

![Shunt Equation Qt x CaO2 = [(Qt – Qs) x CcO2] + [Qs x CvO2] 2 2 ' 2 2 ' CvO O Cc CaO O Cc Qt Qs ](https://image.slidesharecdn.com/ventilationperfusionmatching-100330220500-phpapp01/75/Ventilation-Perfusion-Matching-30-2048.jpg)

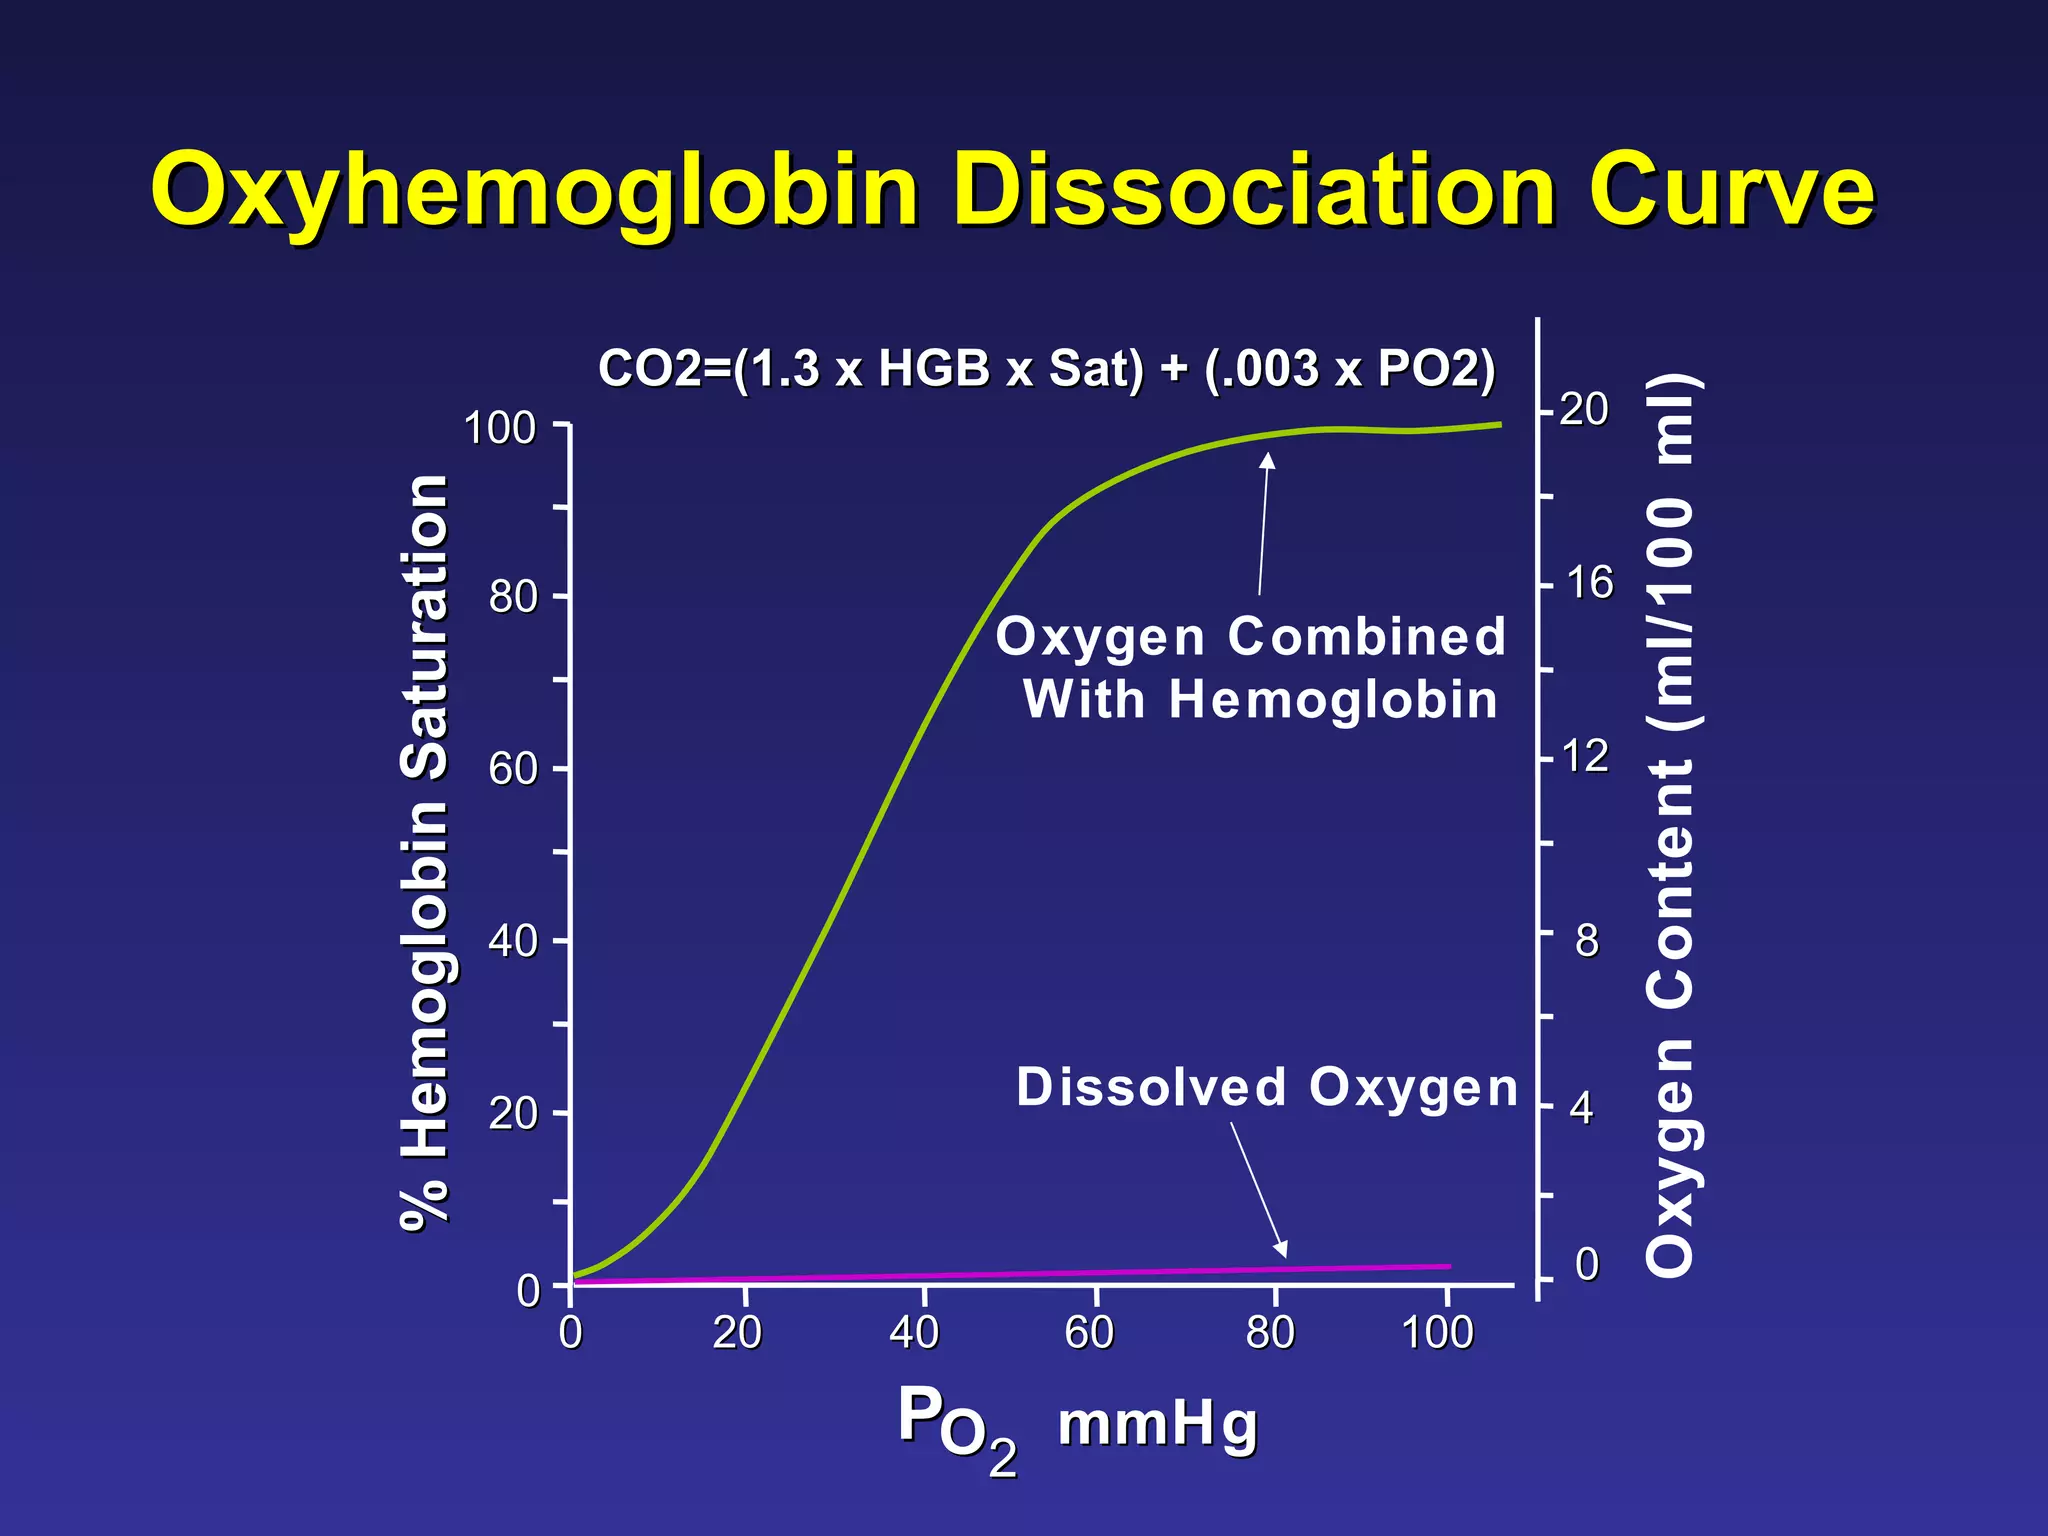
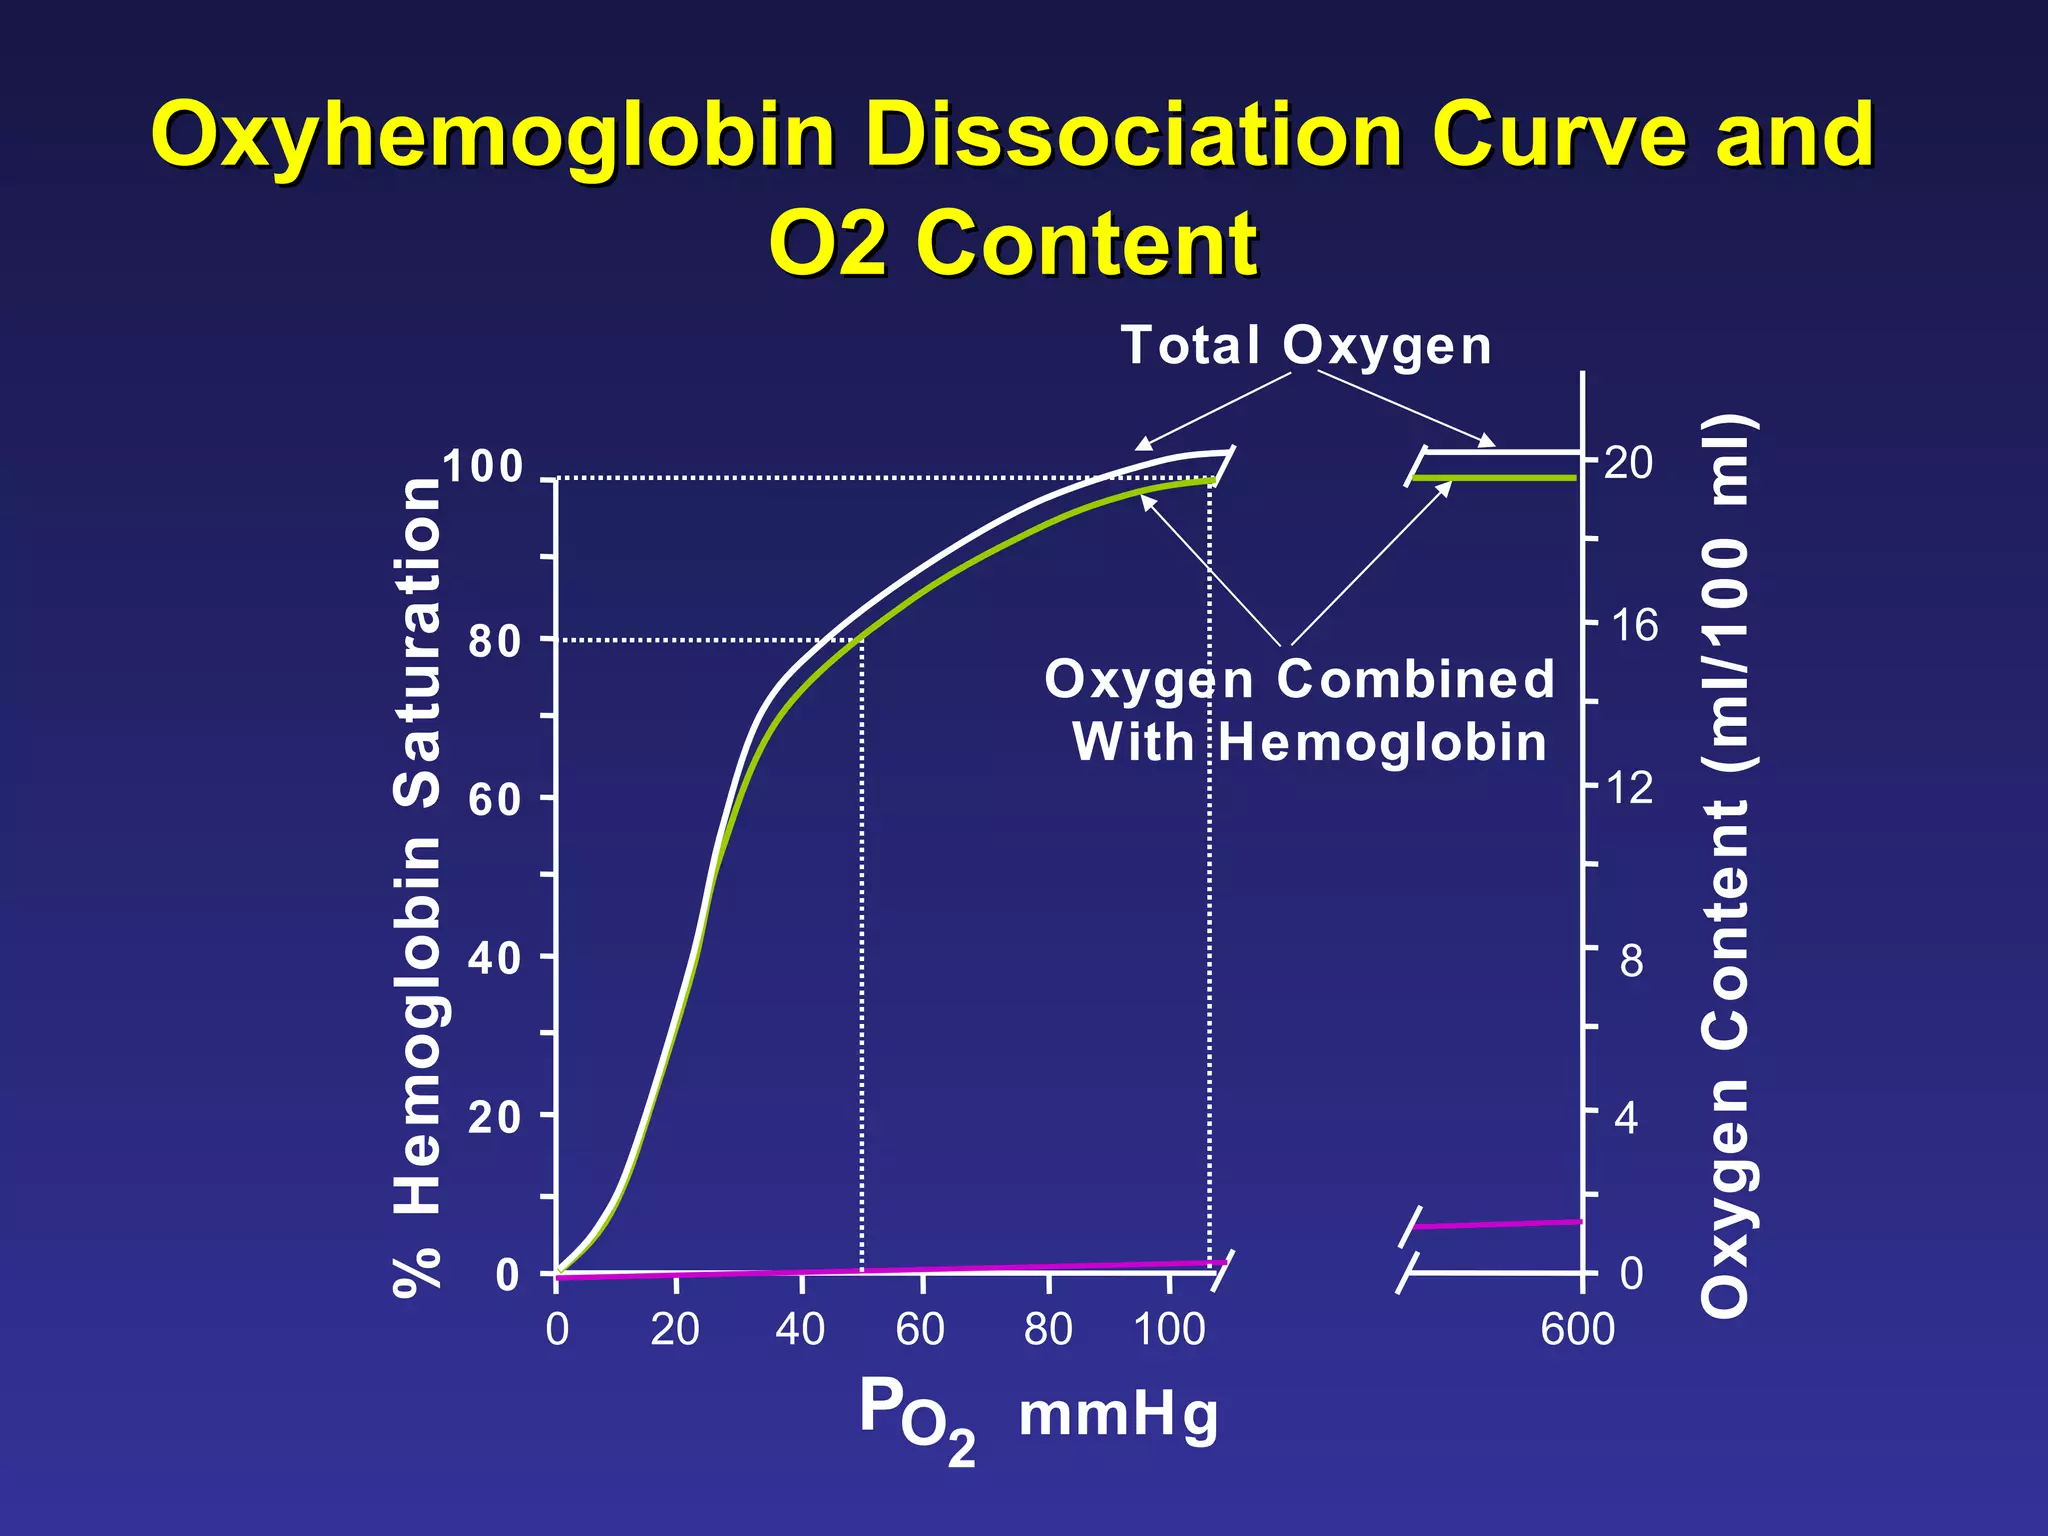
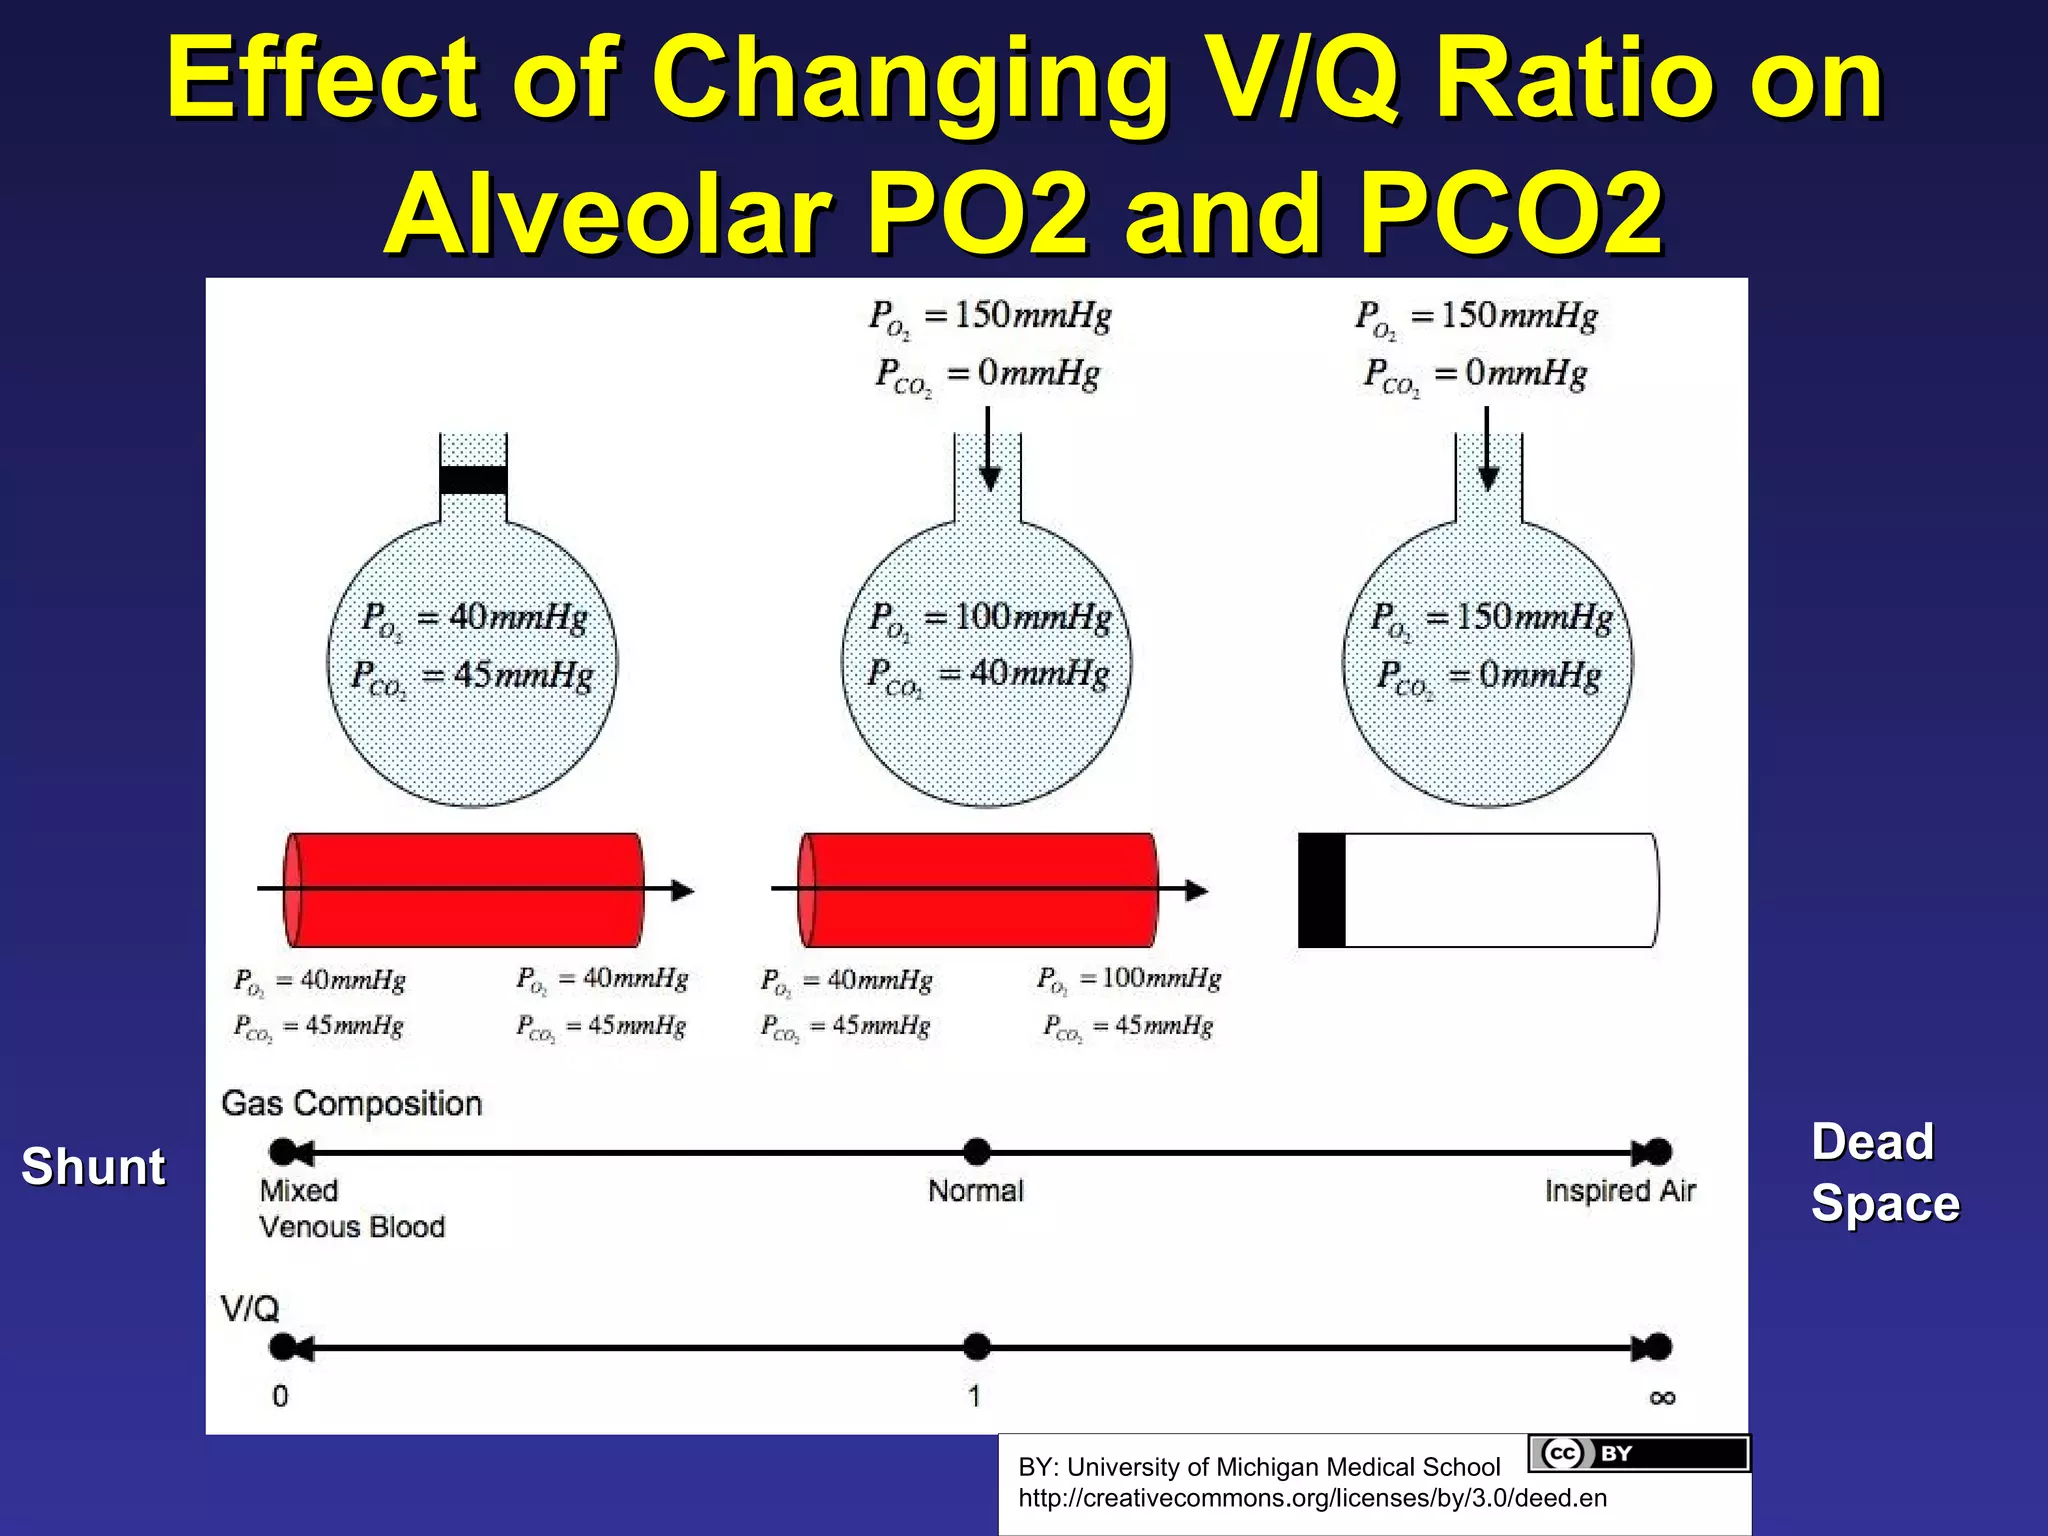
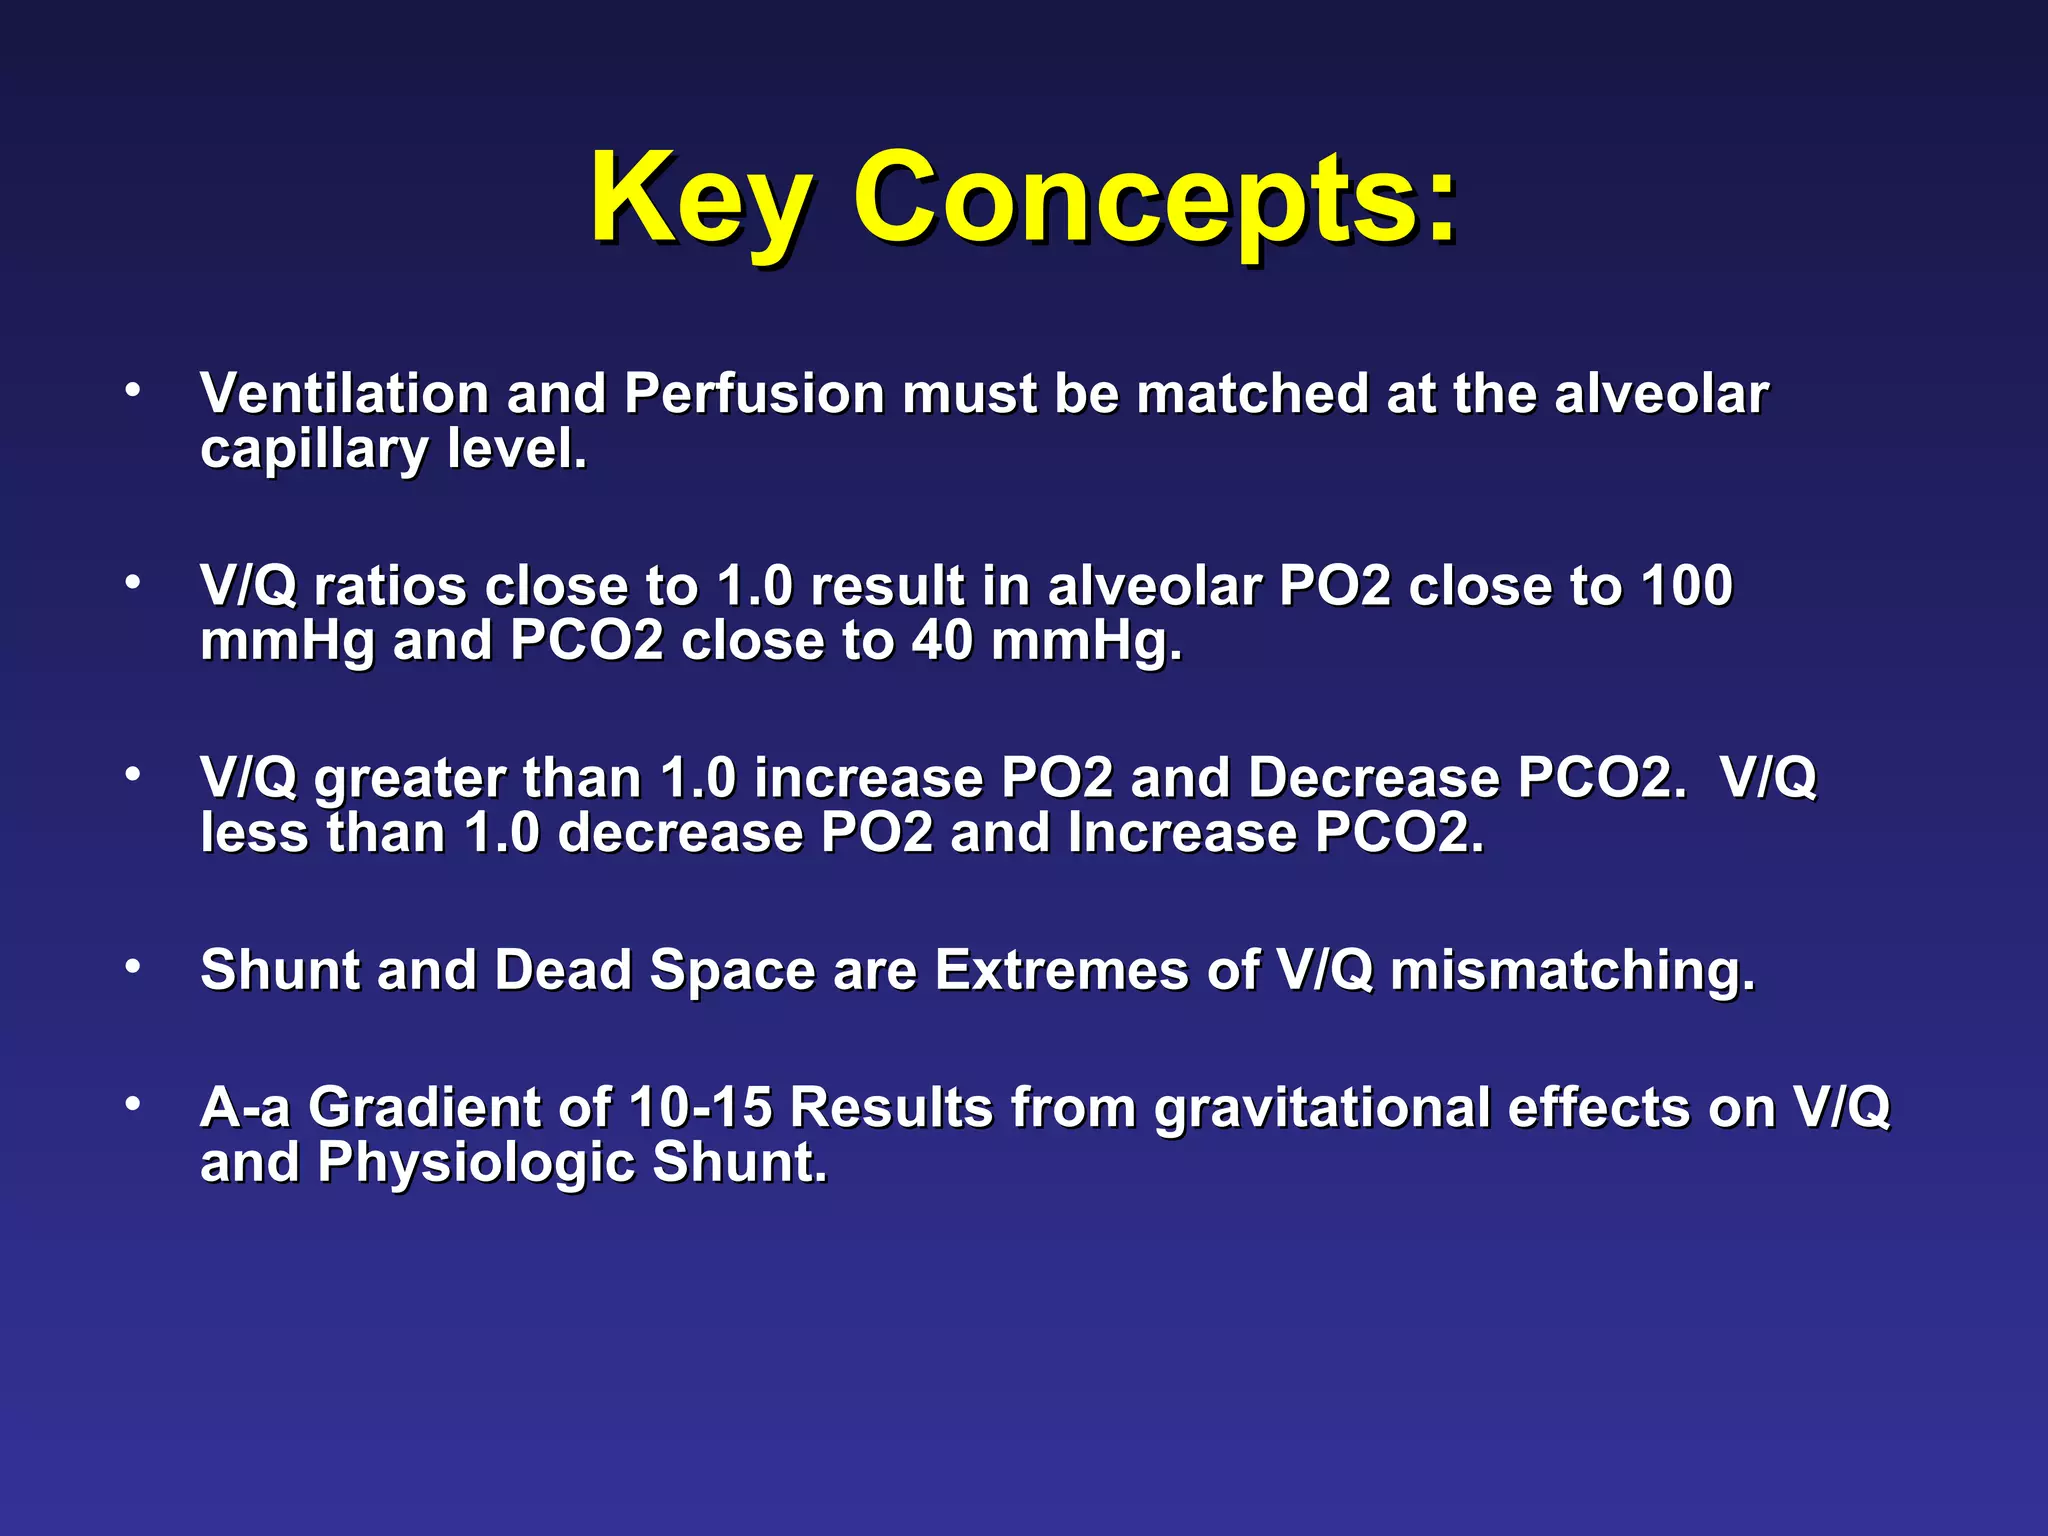
![A-a O2 gradient In a totally efficient lung unit with matched V/Q, alveolar and capillary PO2 would be equal. Admixture of venous blood (or of blood from low V/Q lung units) will decrease the arterial PaO2, without effecting alveolar O2 (PAO2). Calculate the PAO2 using the alveolar gas equation, then subtract the arterial PaO2: [(PiO 2 ) – (PaCO 2 /R)] –PaO2. The A-a O2 gradient (or difference) is < 10-15 mmHg in normal subjects Why is it not 0?](https://image.slidesharecdn.com/ventilationperfusionmatching-100330220500-phpapp01/75/Ventilation-Perfusion-Matching-34-2048.jpg)


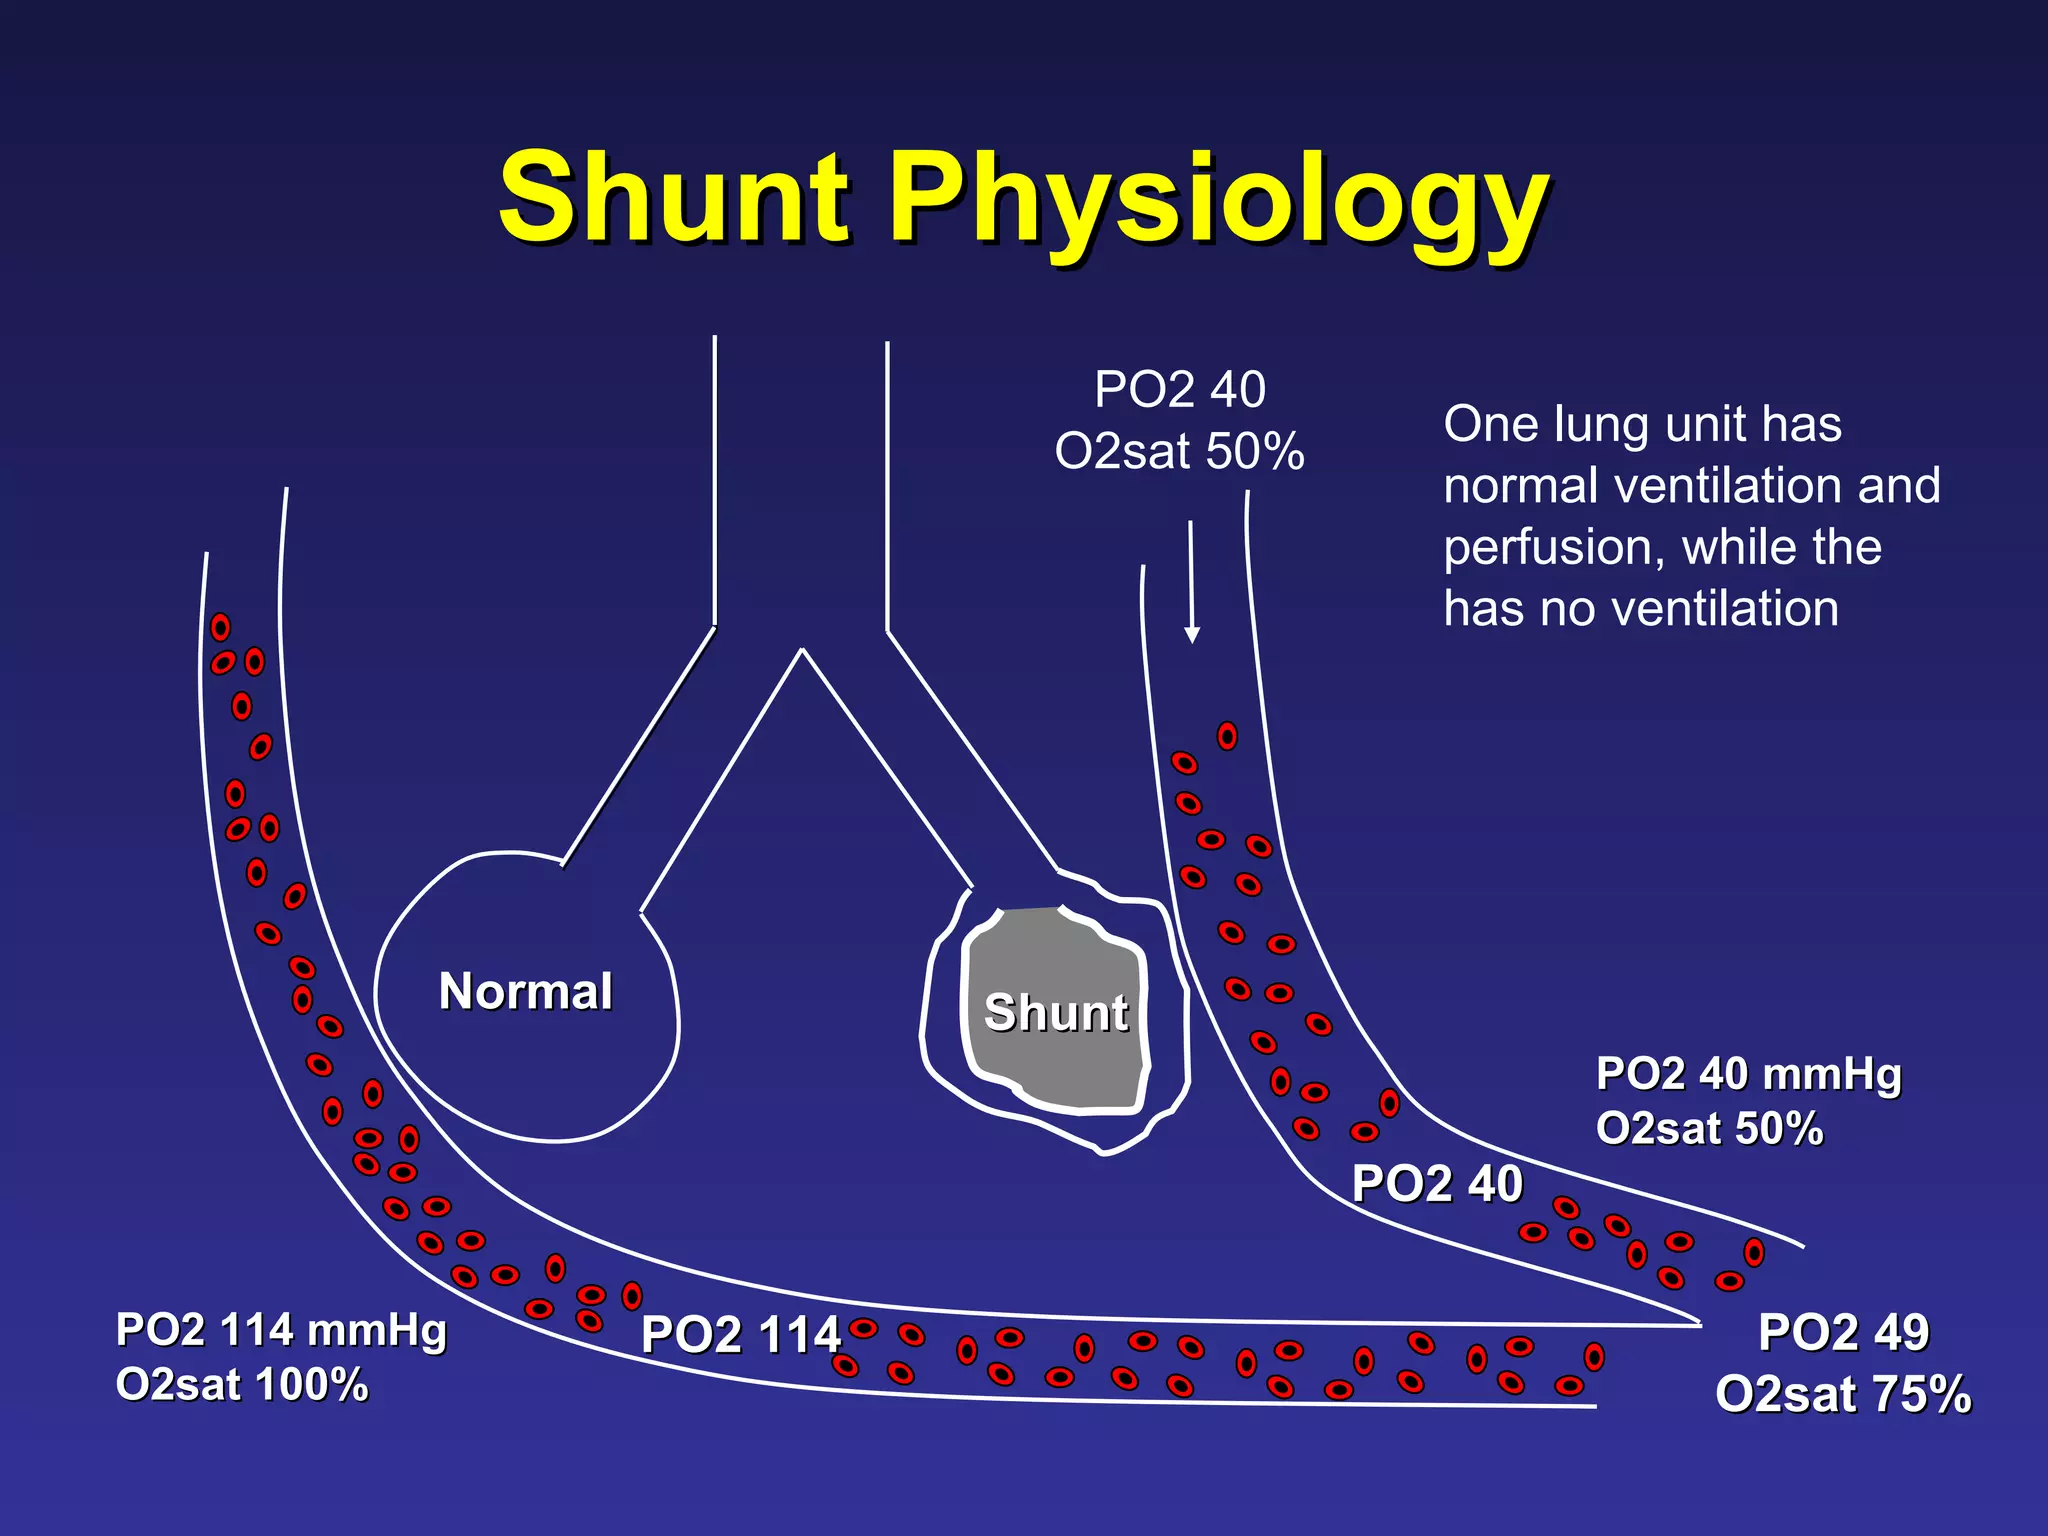
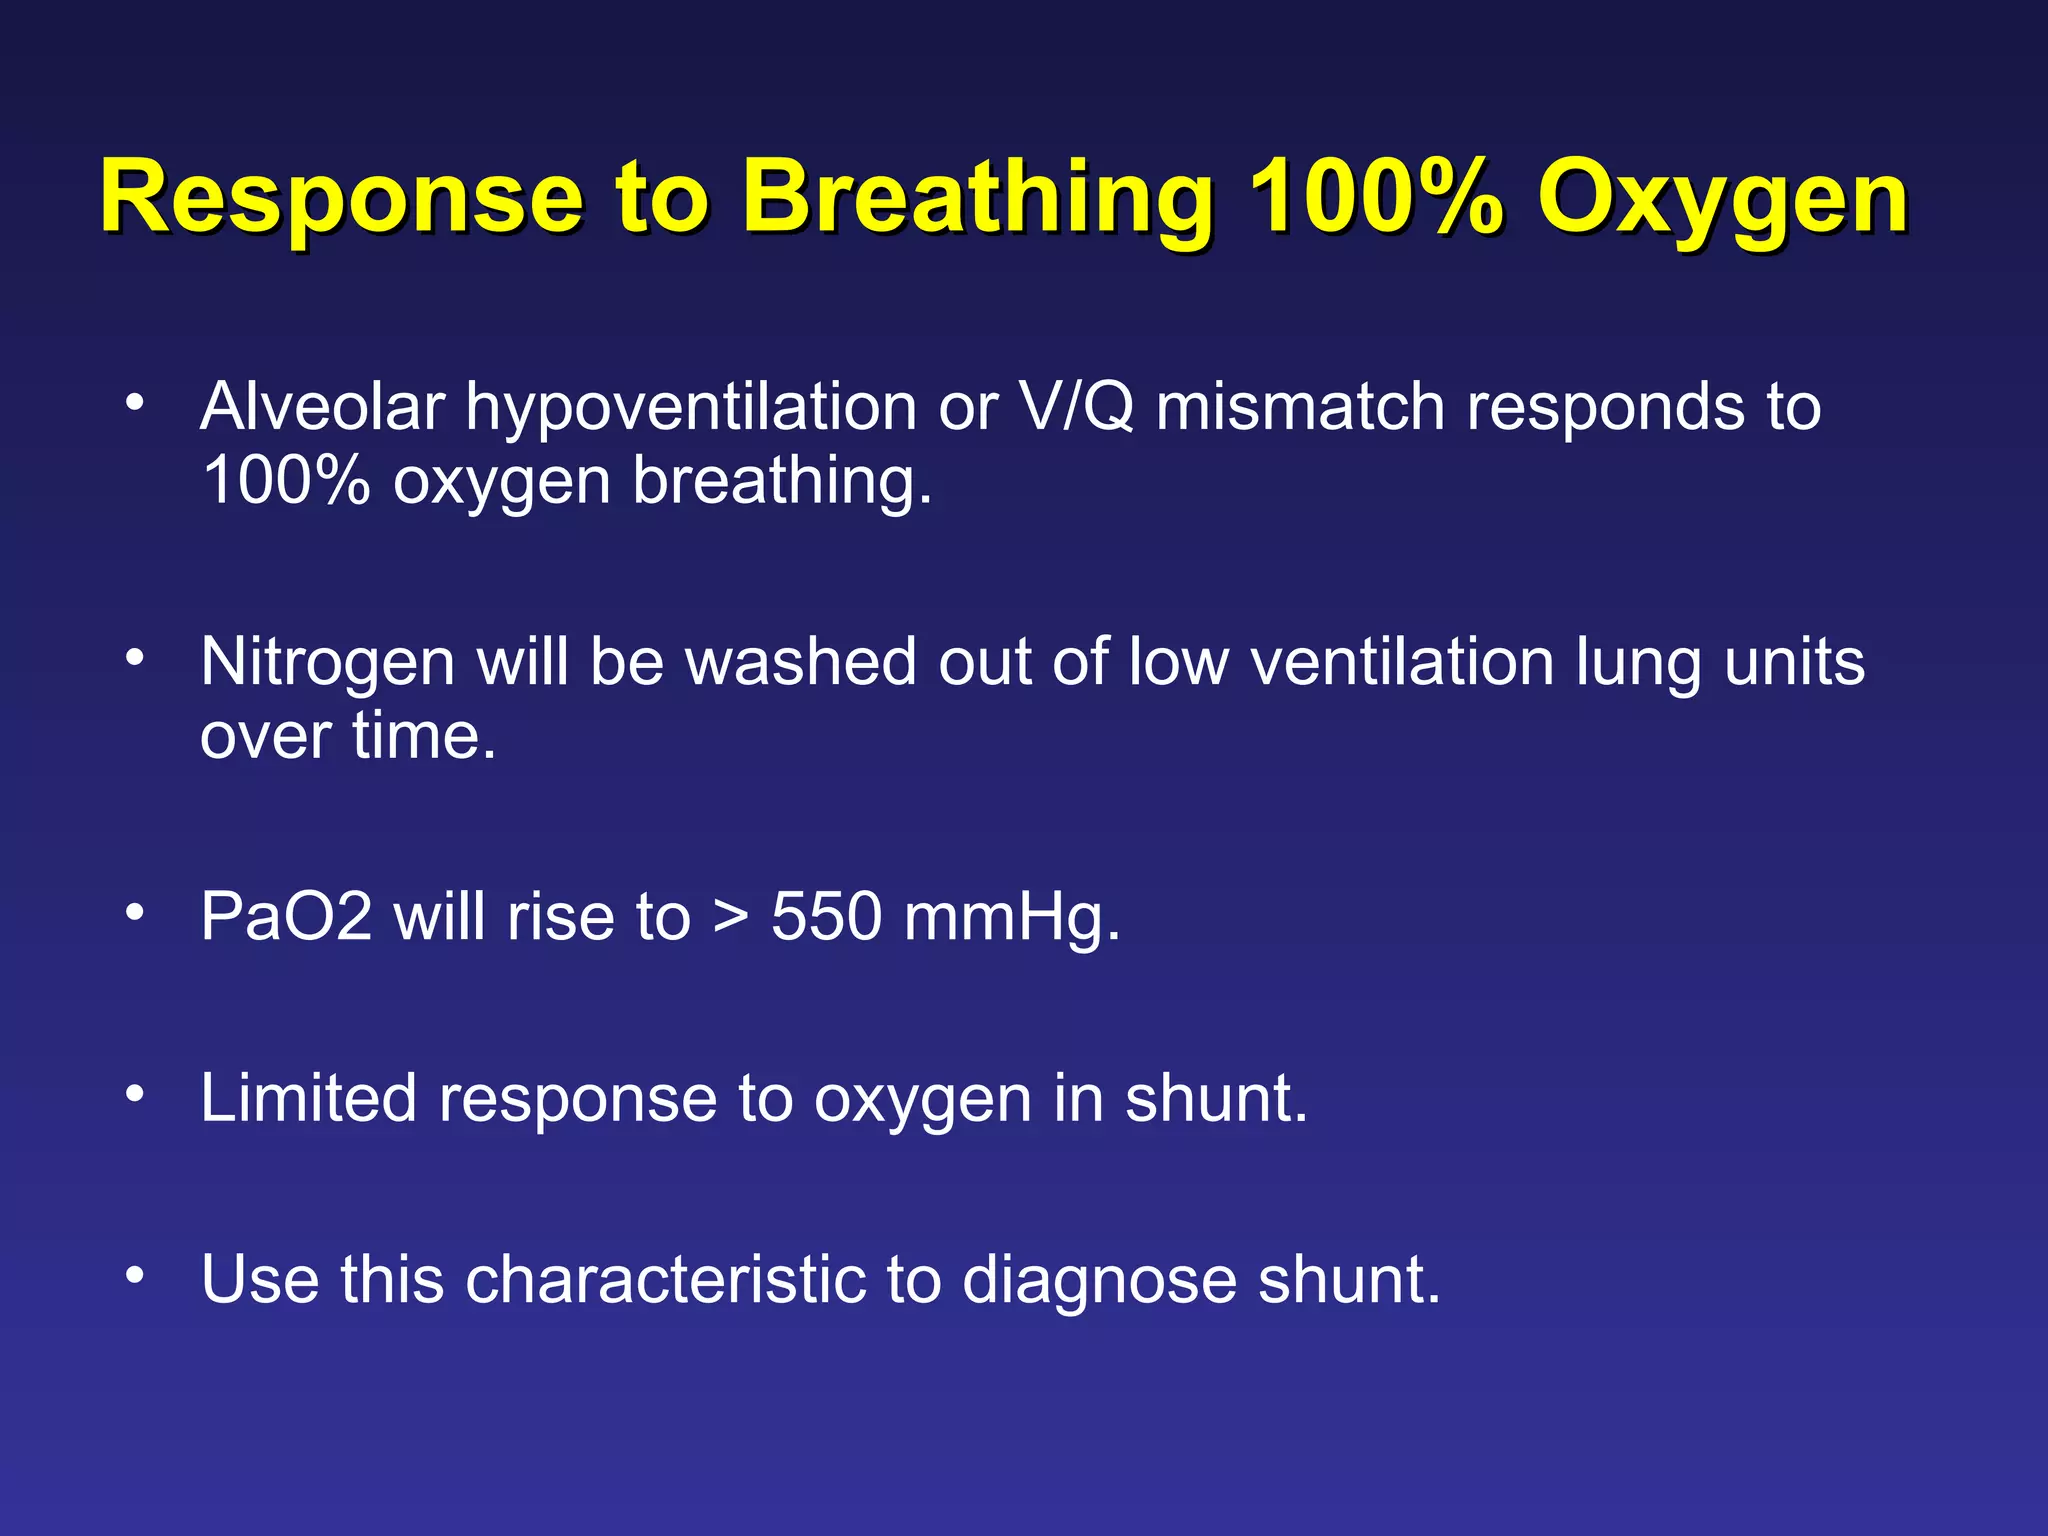
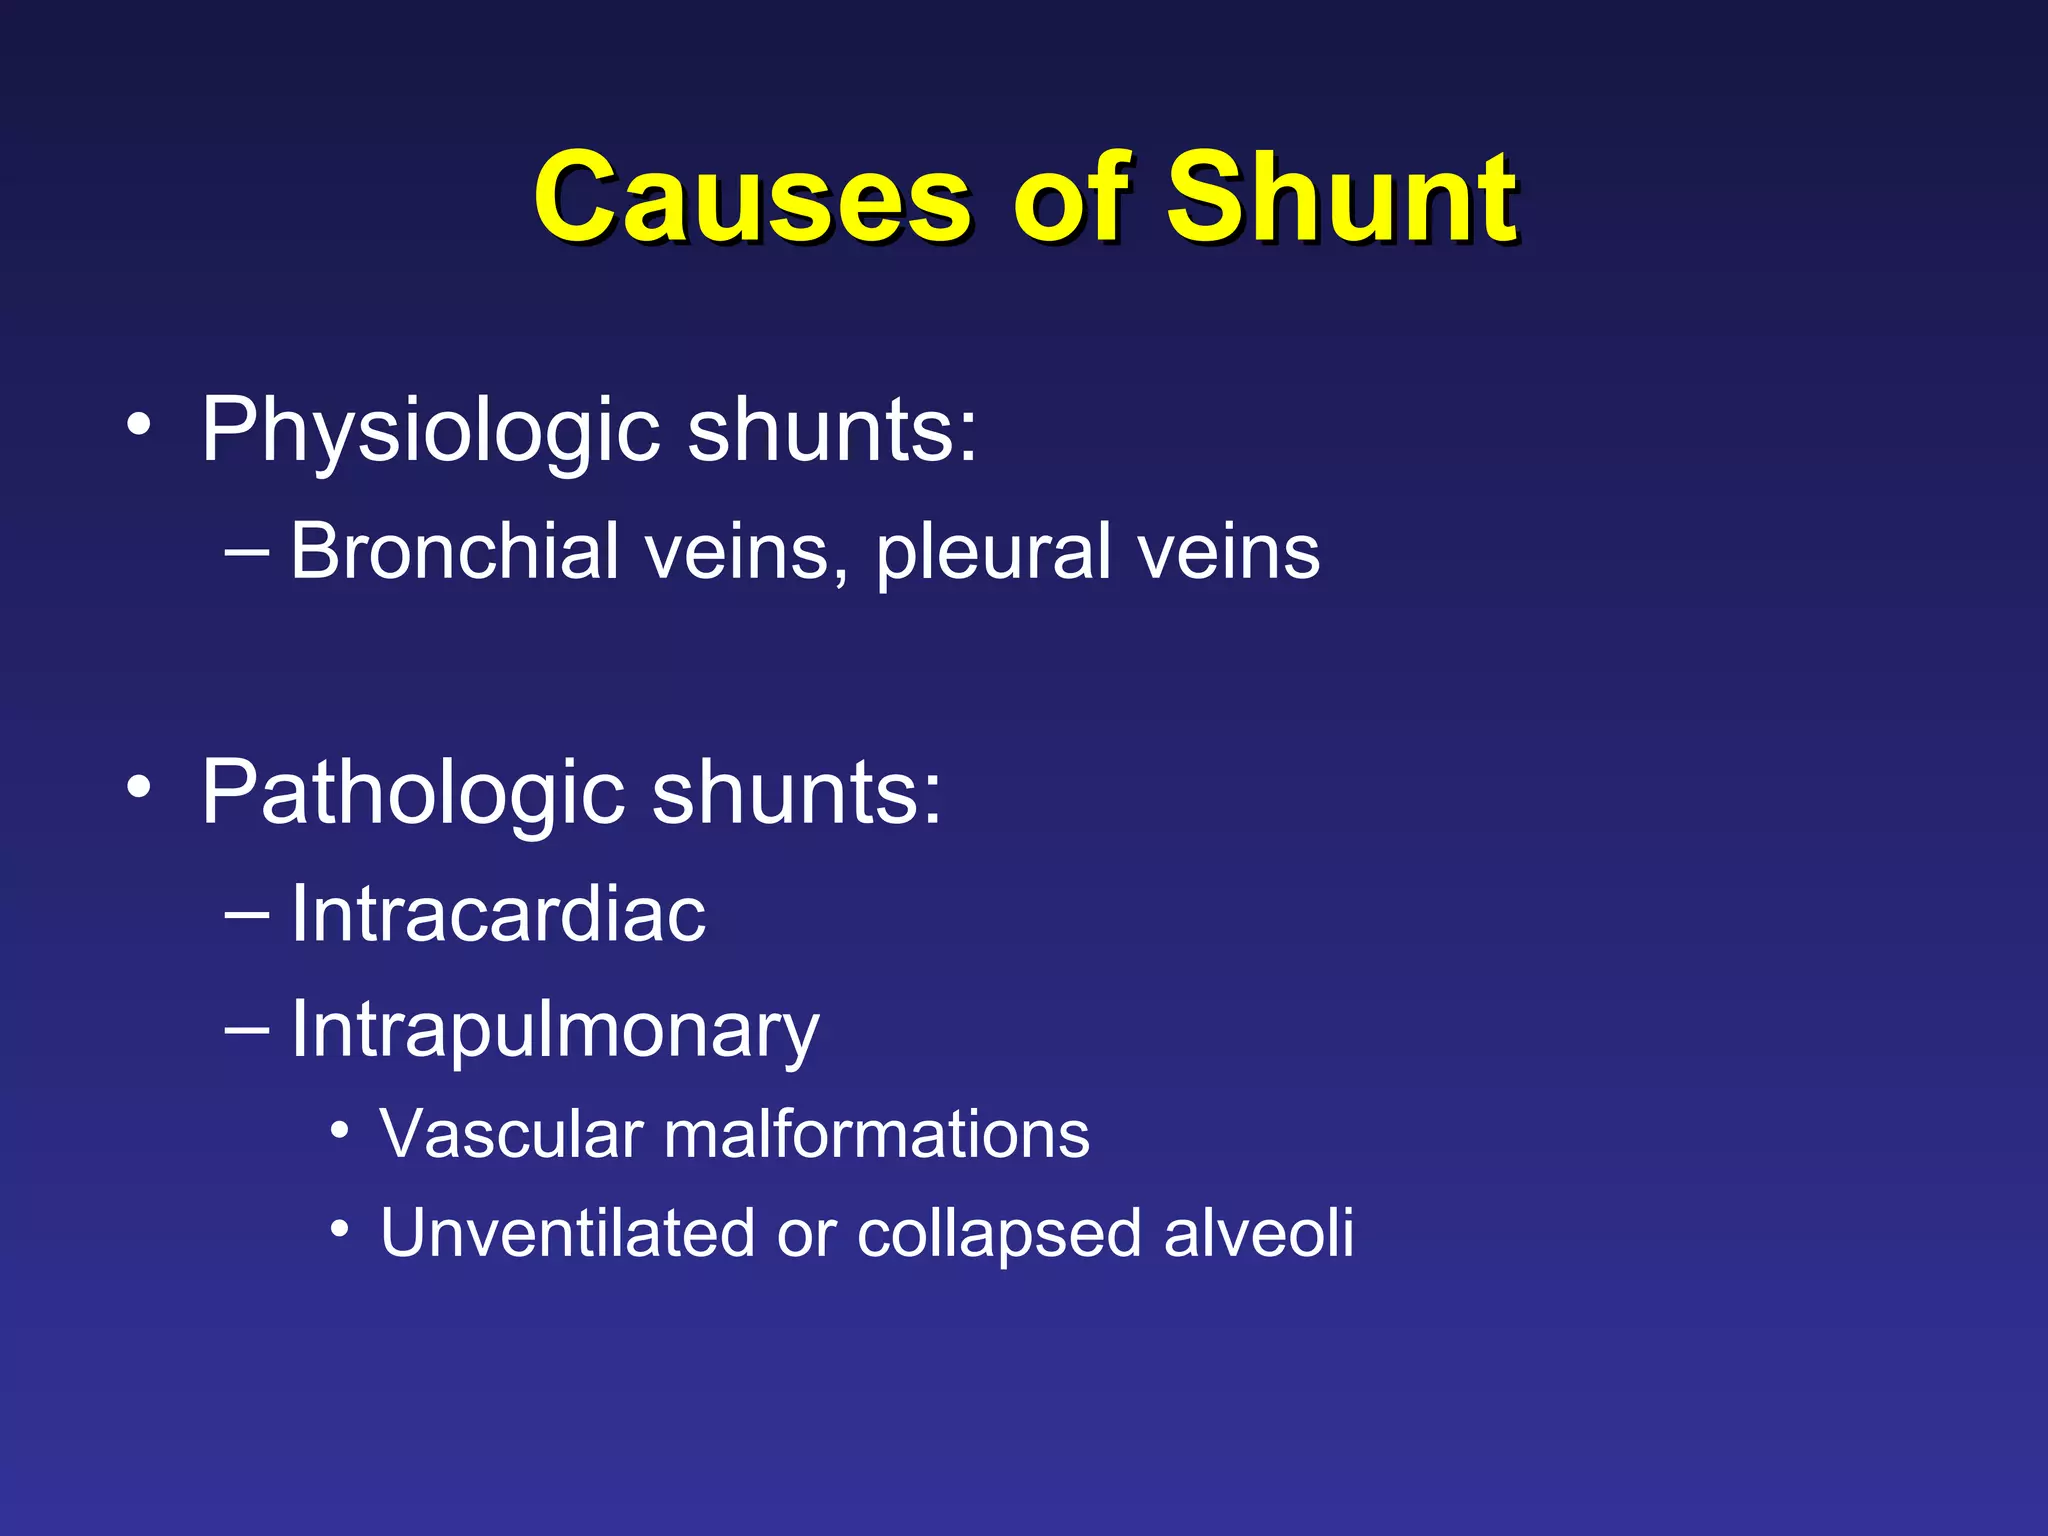
The document provides an overview of ventilation and perfusion matching in the lungs. It discusses how inadequate matching between ventilation and blood flow can lead to hypoxemia. Specifically, it covers the consequences of shunt physiology where blood is perfused but not ventilated, resulting in low oxygen levels. It also addresses how gravity affects regional differences in ventilation and perfusion in the upright posture.


![Mechanical ventilation[1]](https://cdn.slidesharecdn.com/ss_thumbnails/mechanicalventilation1-150109002450-conversion-gate01-thumbnail.jpg?width=640&height=640&fit=bounds)


