Downloaded 117 times


![Helium Dilution Method(for TLC & FRC)*[He]initial = 10%VS(initial) = 2 L[He]final = 5% (assume)Final Vol = VS + VLC1xV1 = C2xV2[He]initial x VS= [He]final x (VS +VL)](https://image.slidesharecdn.com/respiration2upload-110620133006-phpapp01/85/Respiration2-upload-9-320.jpg)
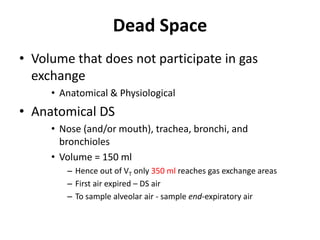
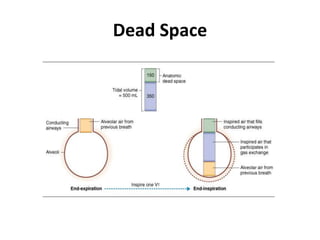
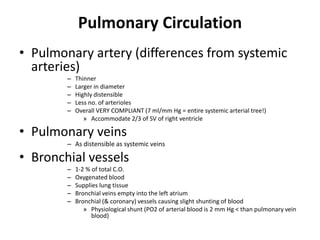
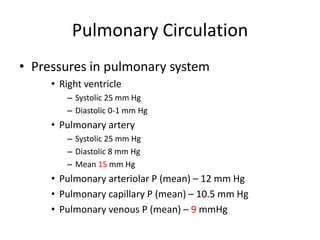
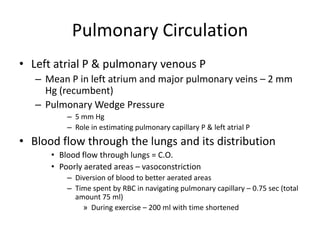
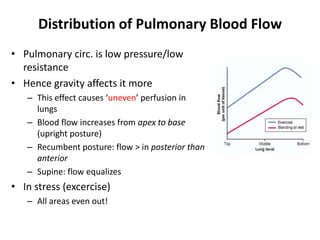
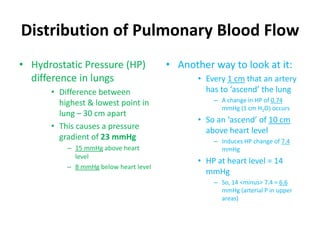
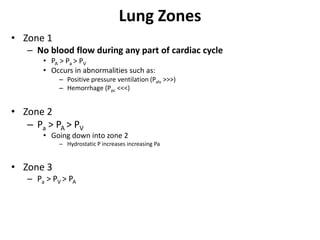
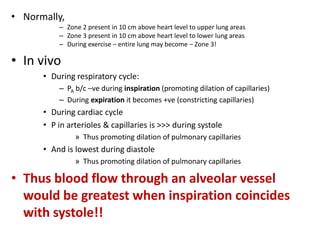
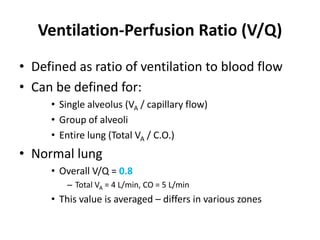
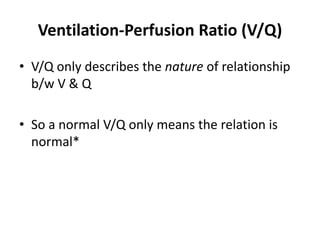
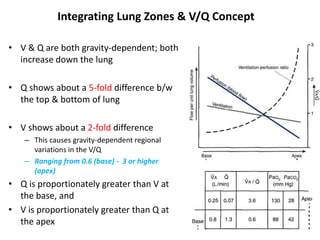
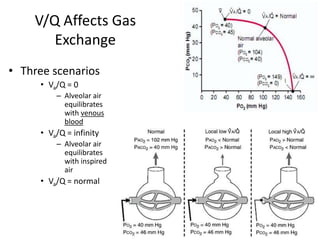
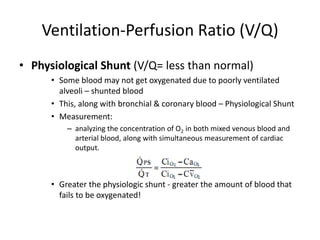
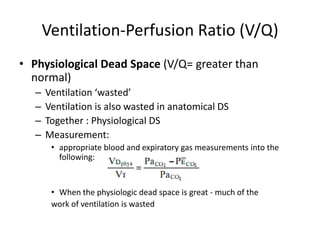
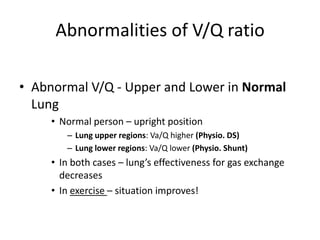
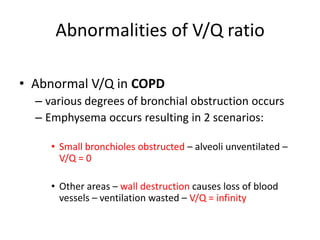

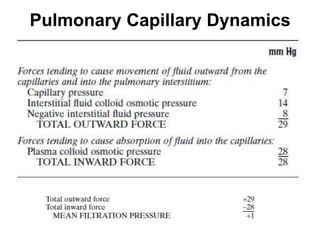


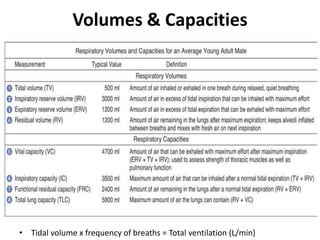
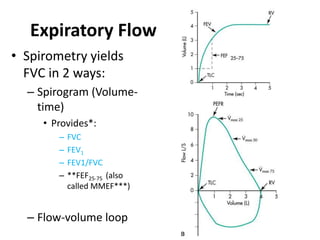
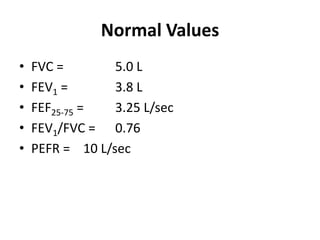
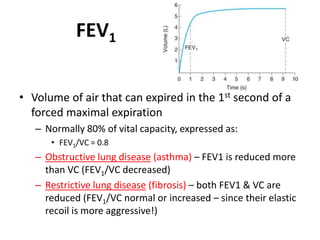
This document summarizes key concepts in pulmonary physiology including: - Ventilation is defined as tidal volume times breathing rate and alveolar ventilation accounts for dead space. - The spirometry tests FVC, FEV1, and FEV1/FVC ratio are used to diagnose obstructive and restrictive lung diseases. - The pulmonary circulation has low pressures and is highly compliant, distributing blood flow depending on ventilation, gravity, and exercise demands to optimize gas exchange. - The ventilation-perfusion ratio describes the matching of ventilation and blood flow throughout the lungs and abnormalities can lead to physiologic shunts or dead space.


