Download as PDF, PPTX
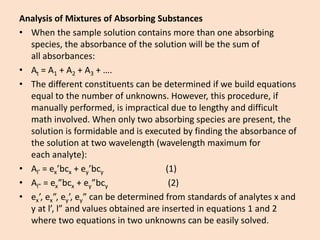
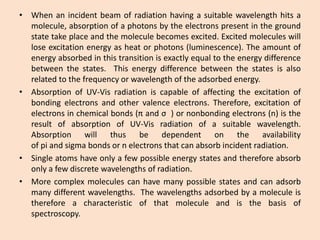
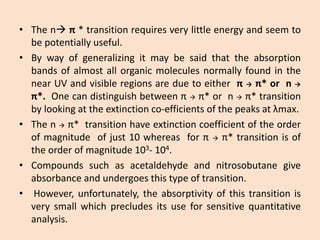
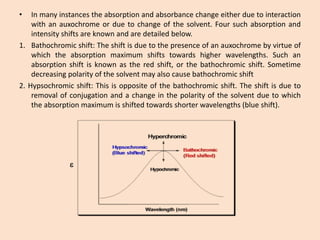
![•Absorbancesharesalinearrelationshipwithsampleconcentration.Ontheotherhand,therelationshipbetweentransmittanceandsampleconcentrationisanon-linearone.Itisthereforeeasiertouseabsorbanceasanindexofsampleconcentration.
•ThequantityI/I0isknownastransmittanceandisdenotedbyT(amountoflightwhichescapesabsorptionandistransmitted).
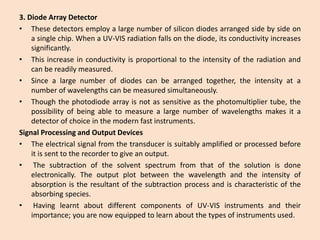
•Thus,therelationshipbetweenAbsorbanceandtransmittanceisgivenby;
A=-log(I/I0)=-logT
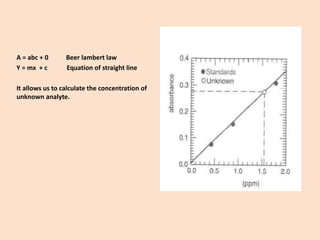
Standardcurve:
Forquantitativeanalysis,astandardcurveorcalibrationcurveispreparedinwhichabsorbance(A)ataspecificwavelength(λ)isplottedagainsttheconcentrationinaseriesofstandards[sameanalyte,knownconcentration(c)].
As‘A’isproportionaltotheC,itshouldbeastraightlinepassingthroughtheorigin.](https://image.slidesharecdn.com/uv-visspectroscopy-141106101530-conversion-gate02/85/Uv-vis-spectroscopy-20-320.jpg)

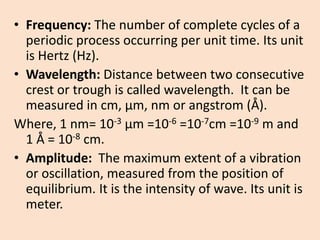
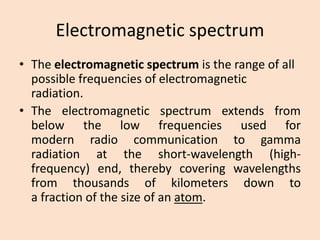
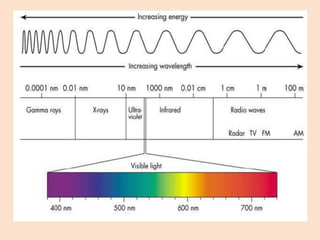
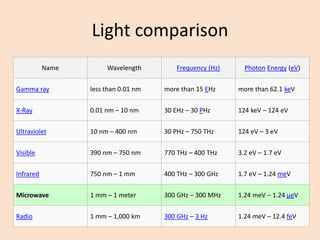
UV-Vis spectroscopy involves using spectroscopy to study the interaction between electromagnetic radiation and matter. It summarizes that UV-Vis spectroscopy uses electromagnetic waves in the UV and visible spectral regions to analyze molecules and their electronic transitions. The document discusses the wave and particle theories of light, the electromagnetic spectrum, Beer-Lambert law which relates absorbance to concentration, and limitations of the Beer-Lambert law such as deviations at high/low concentrations and due to fluorescence or turbidity.


