Download as PDF, PPTX
![UV Visible Spectroscopy – How to use
UV vis. Spectrophotometer
Mr. Sagar Kishor Savale
[Department of Pharmaceutics]
avengersagar16@gmail.com
2015-2016
Department of Pharmacy (Pharmaceutics) | Sagar savale
03/06/2016 sagar savale 1](https://image.slidesharecdn.com/uvvisiblespectroscoy-howtouseduvspectrophotometer-160604063517/75/UV-visible-Spectroscoy-How-to-used-UV-Spectrophotometer-1-2048.jpg)
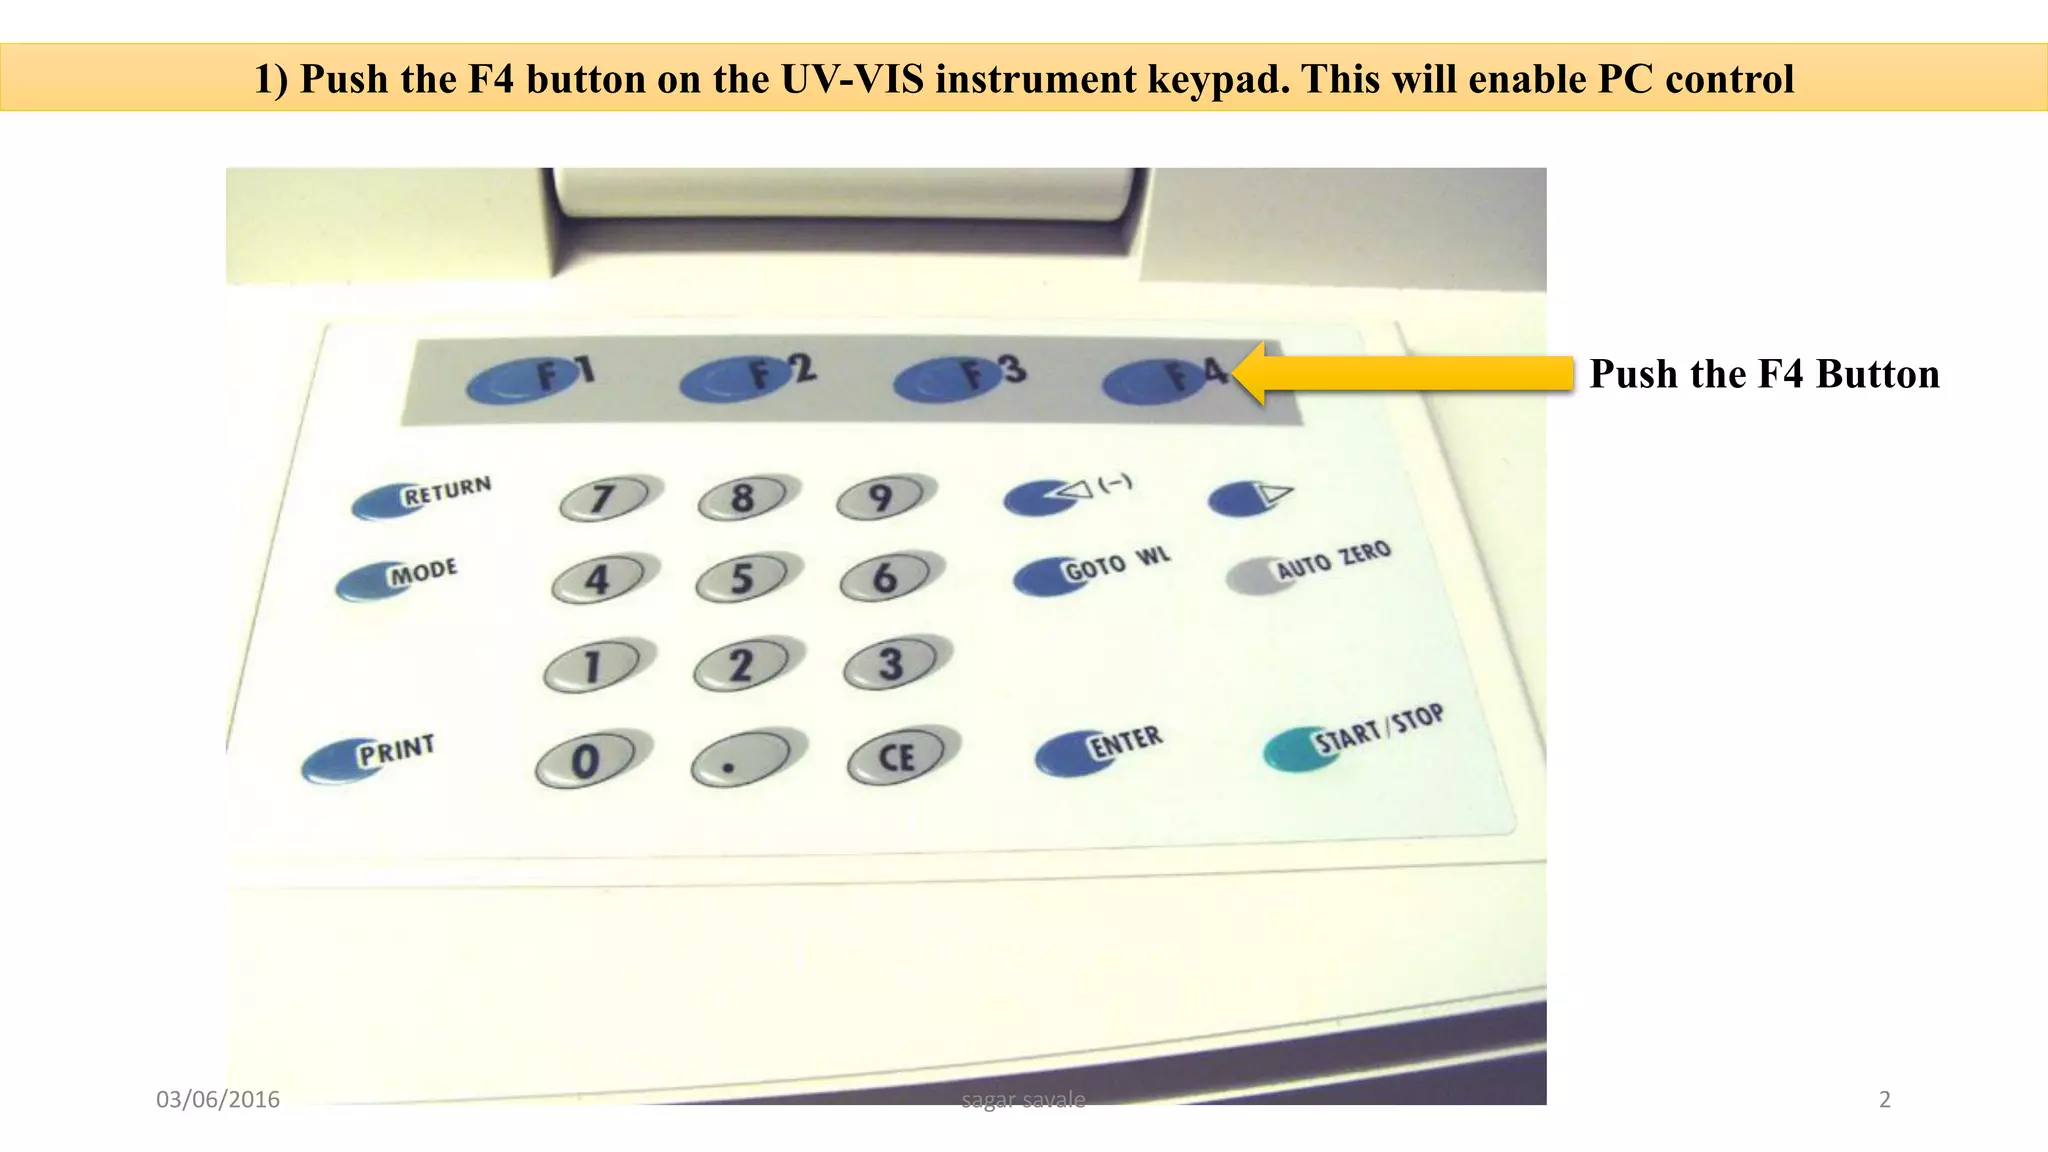
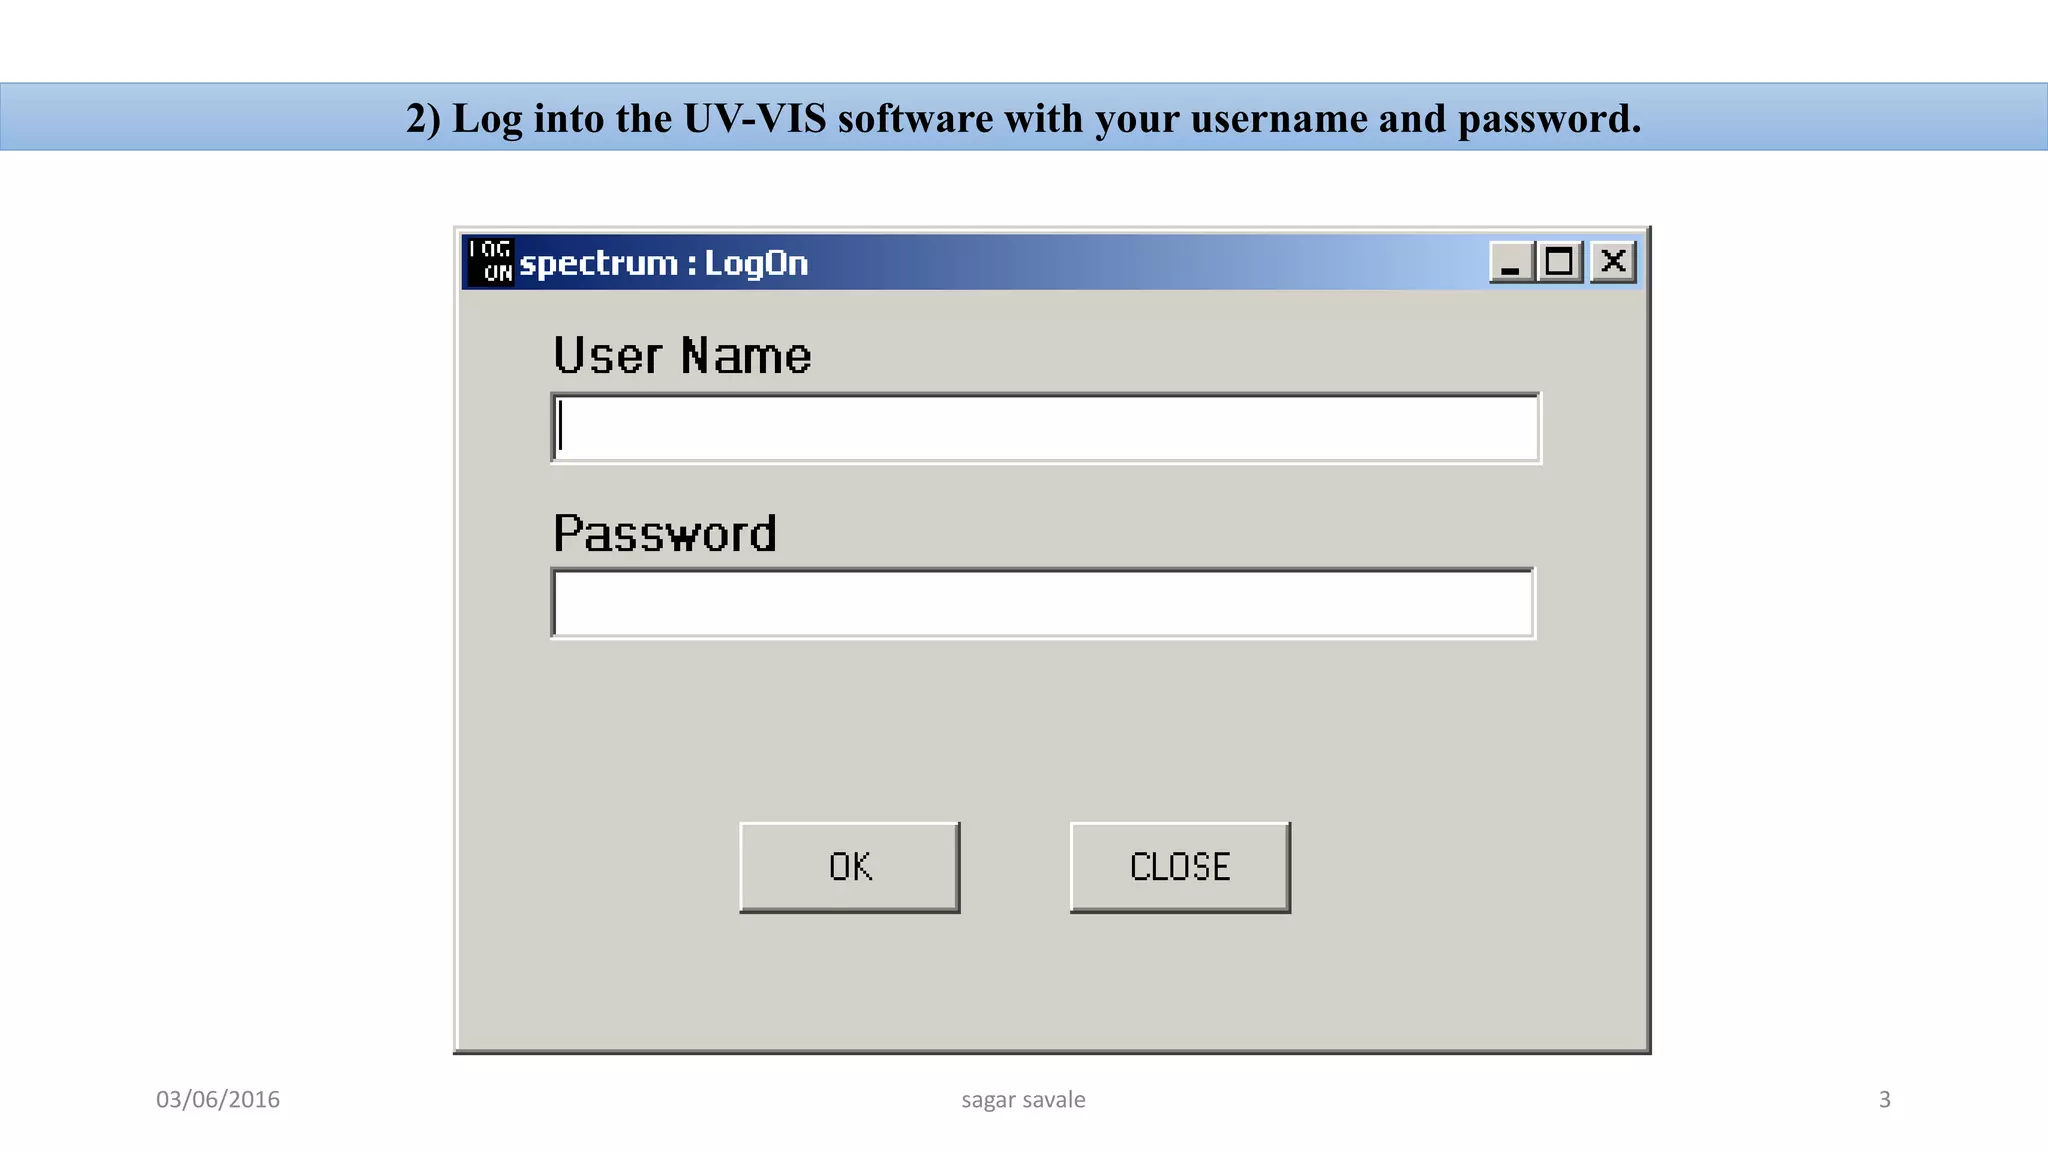
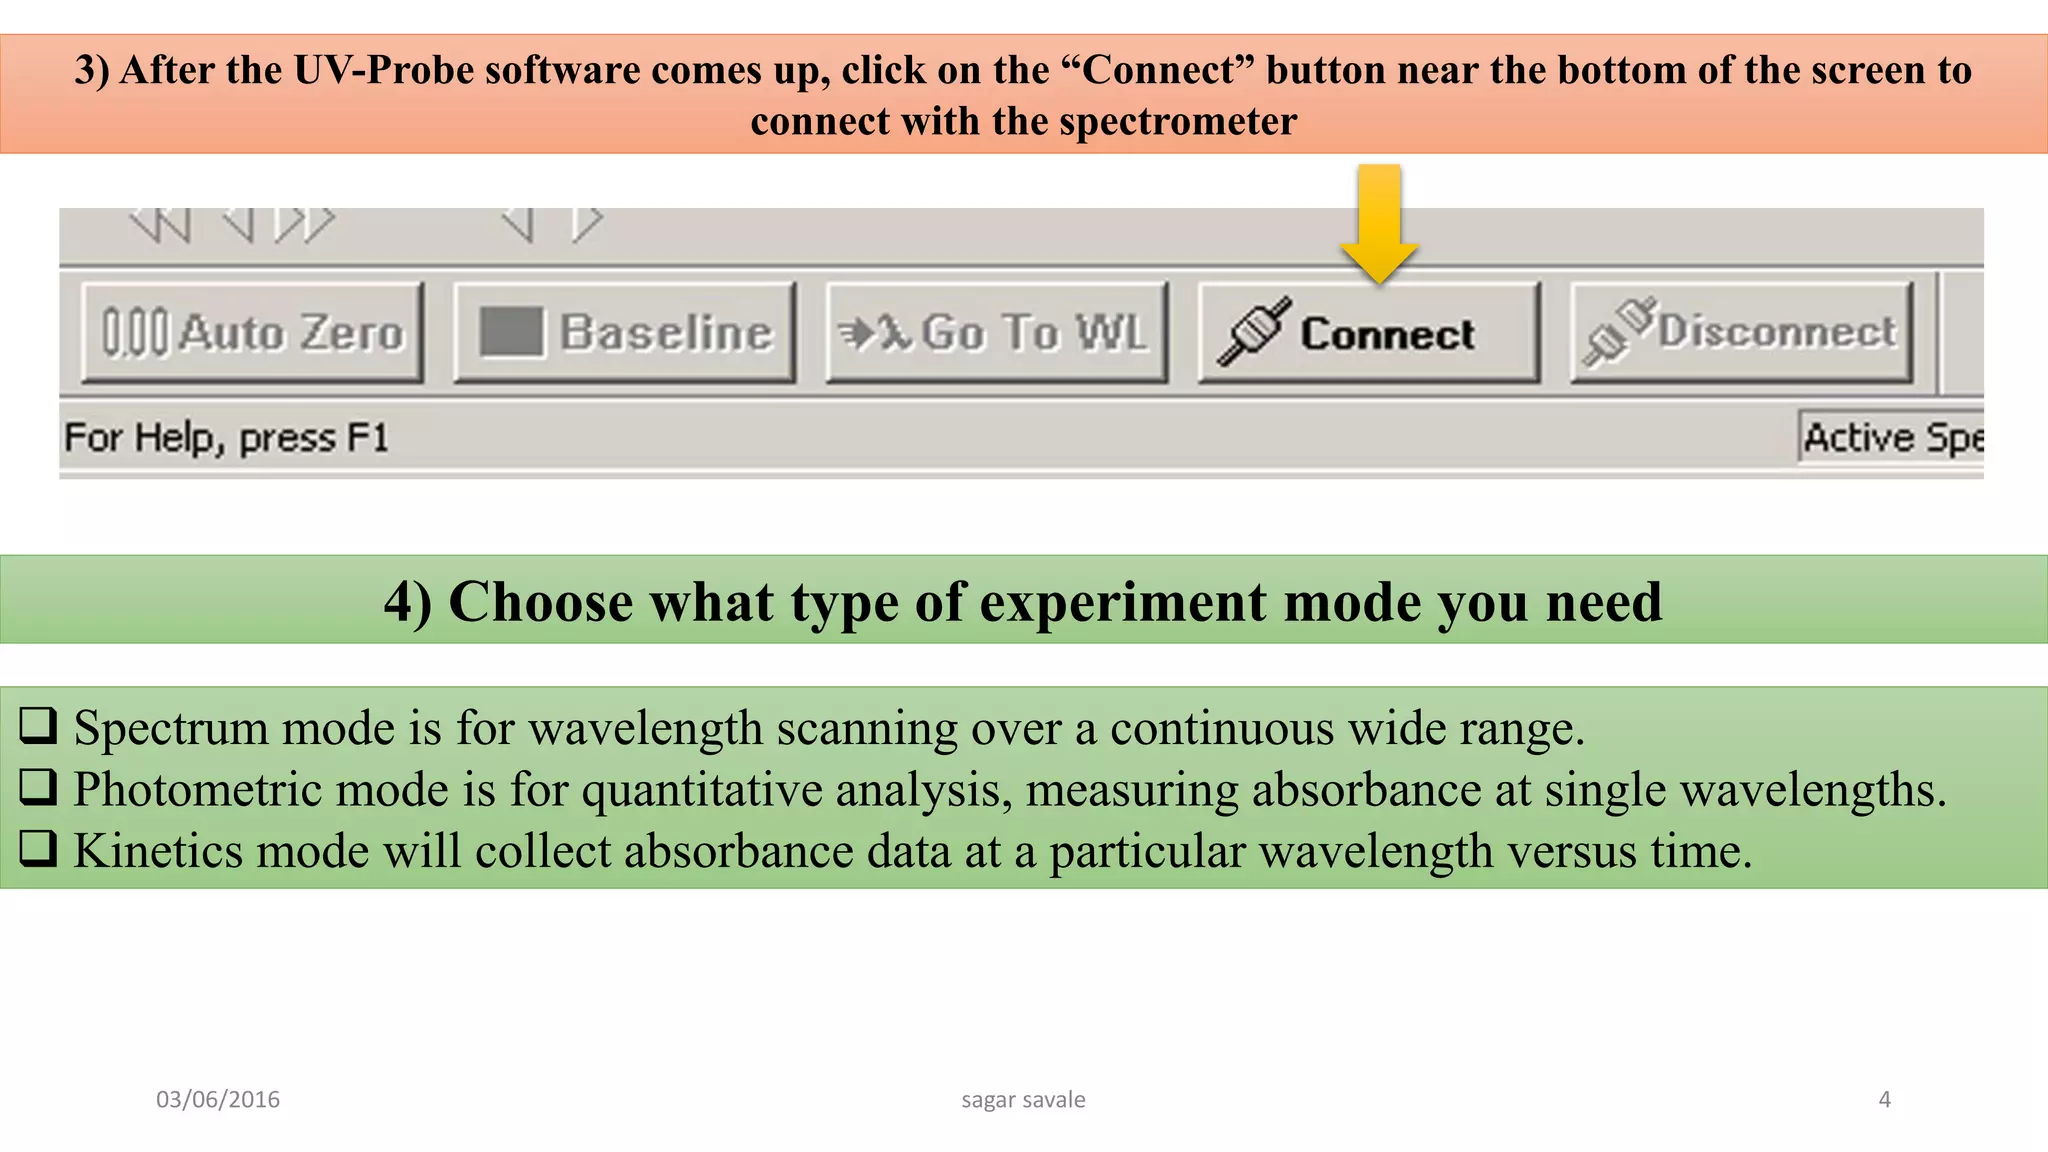
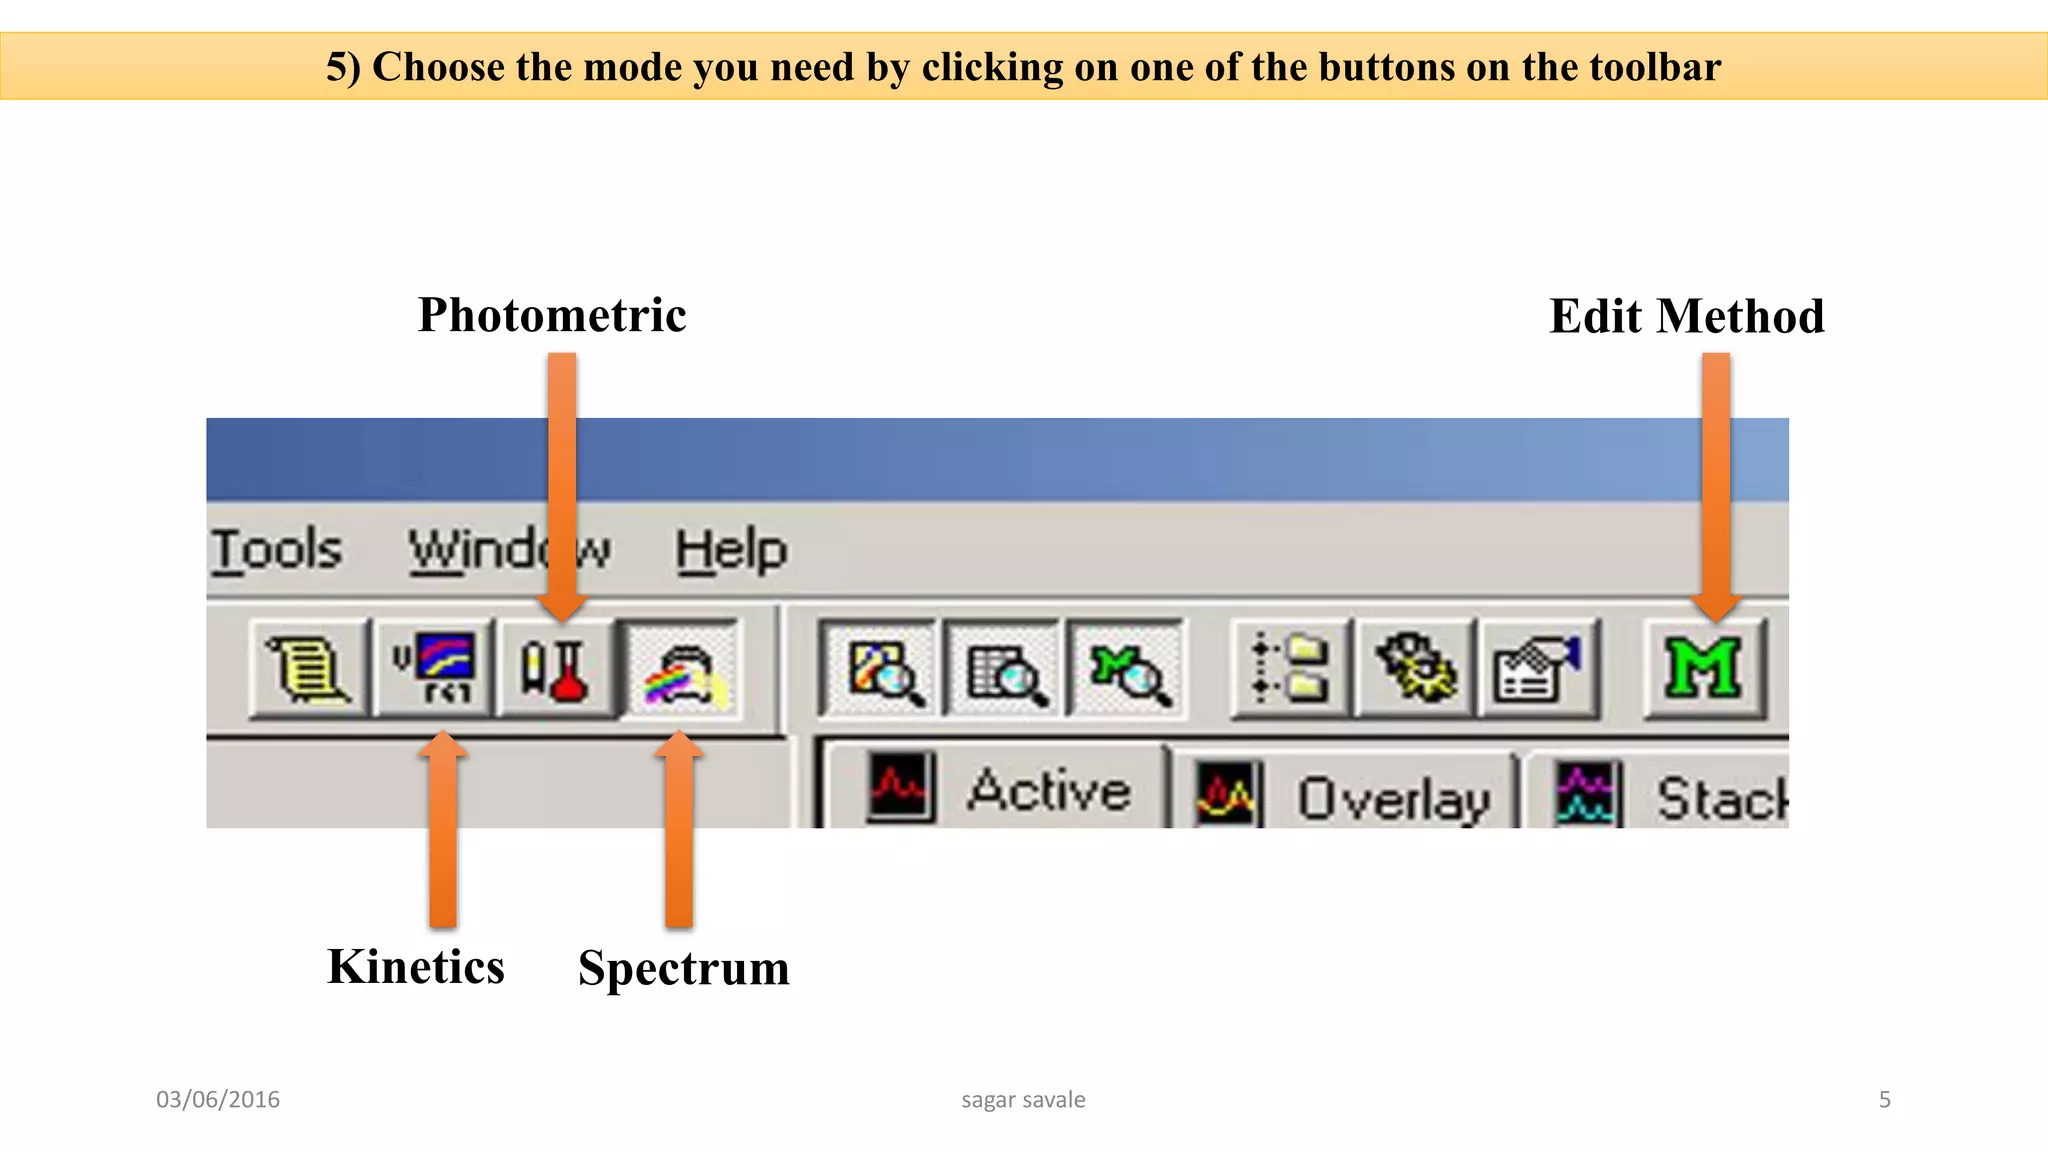
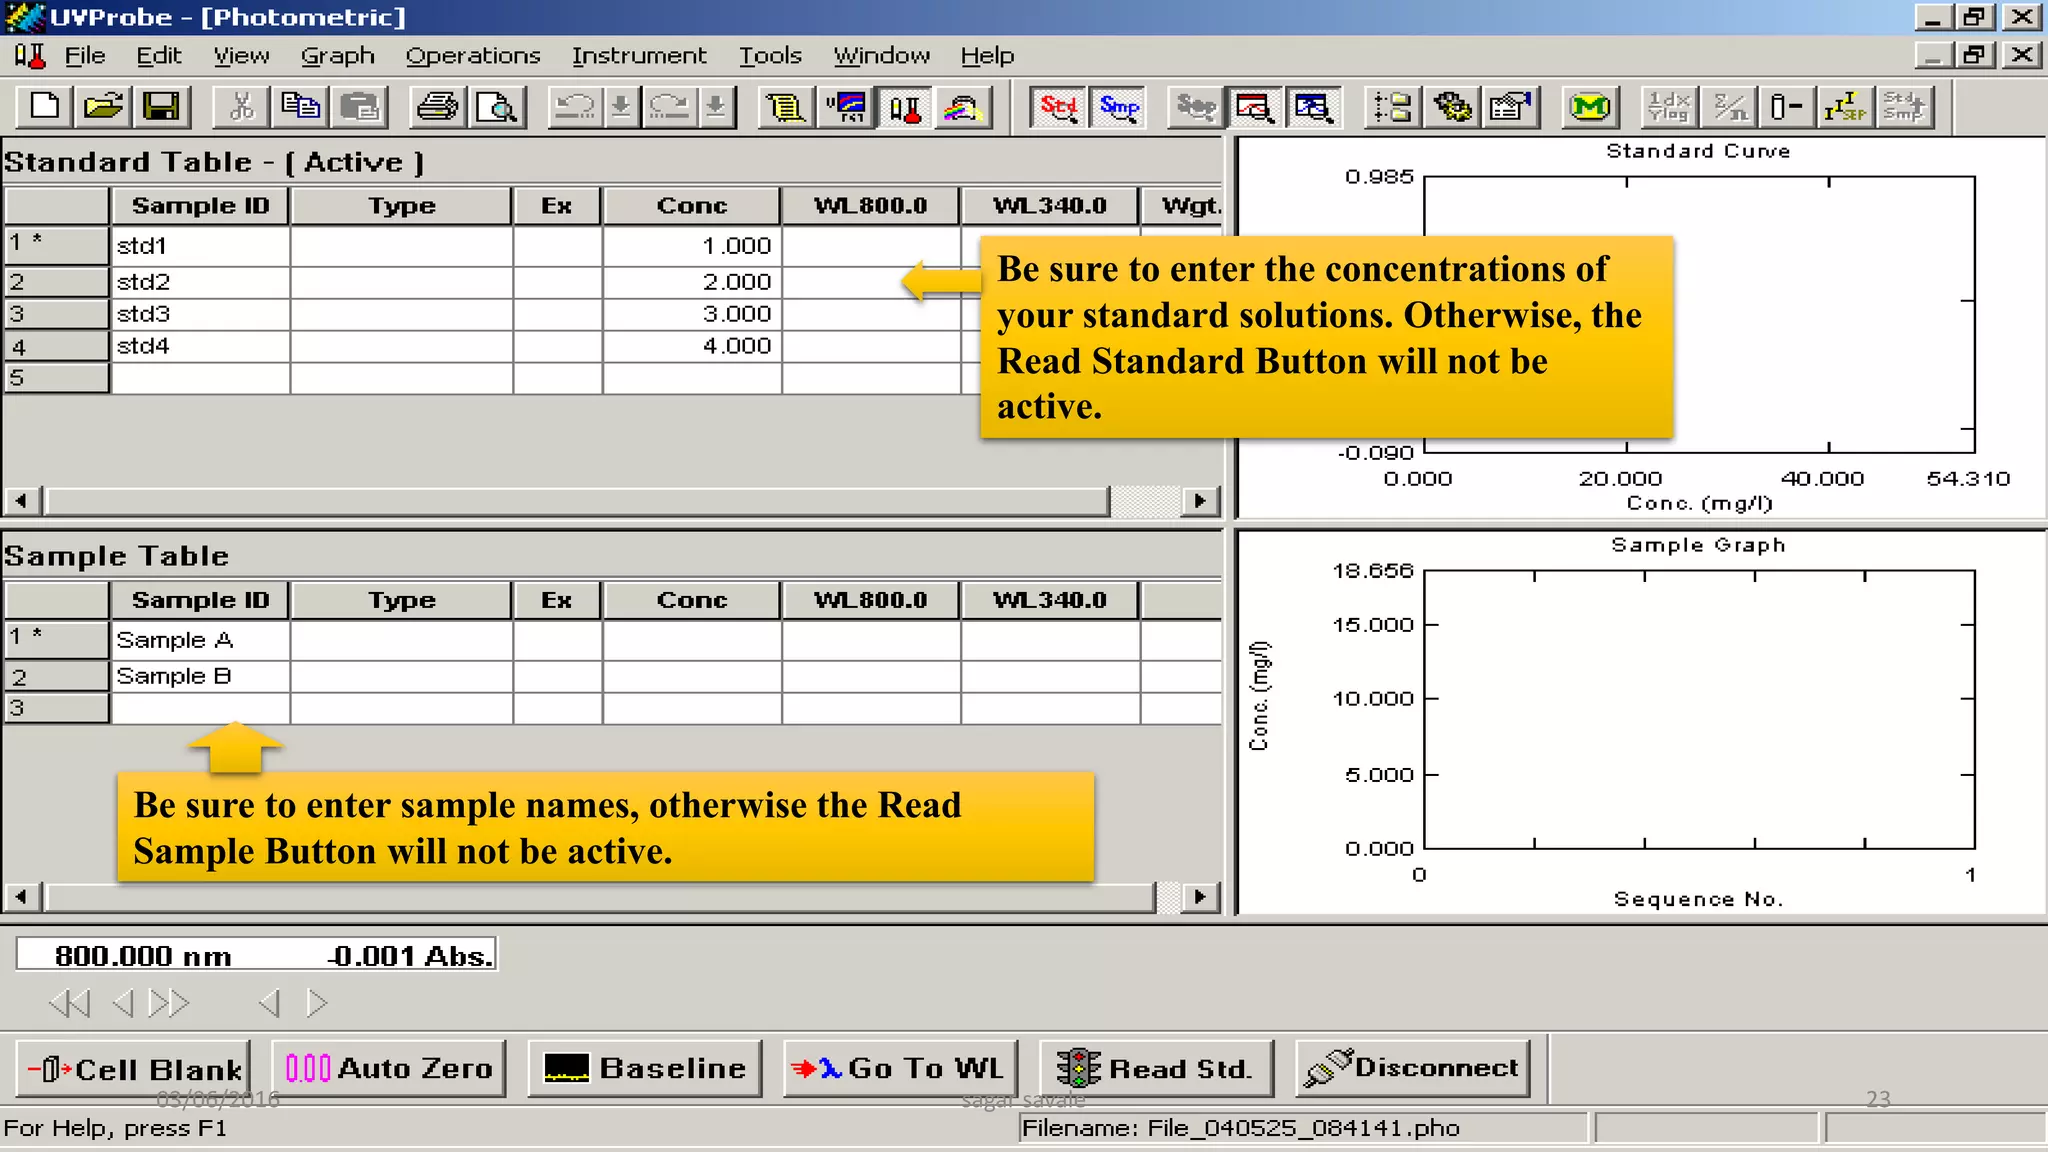
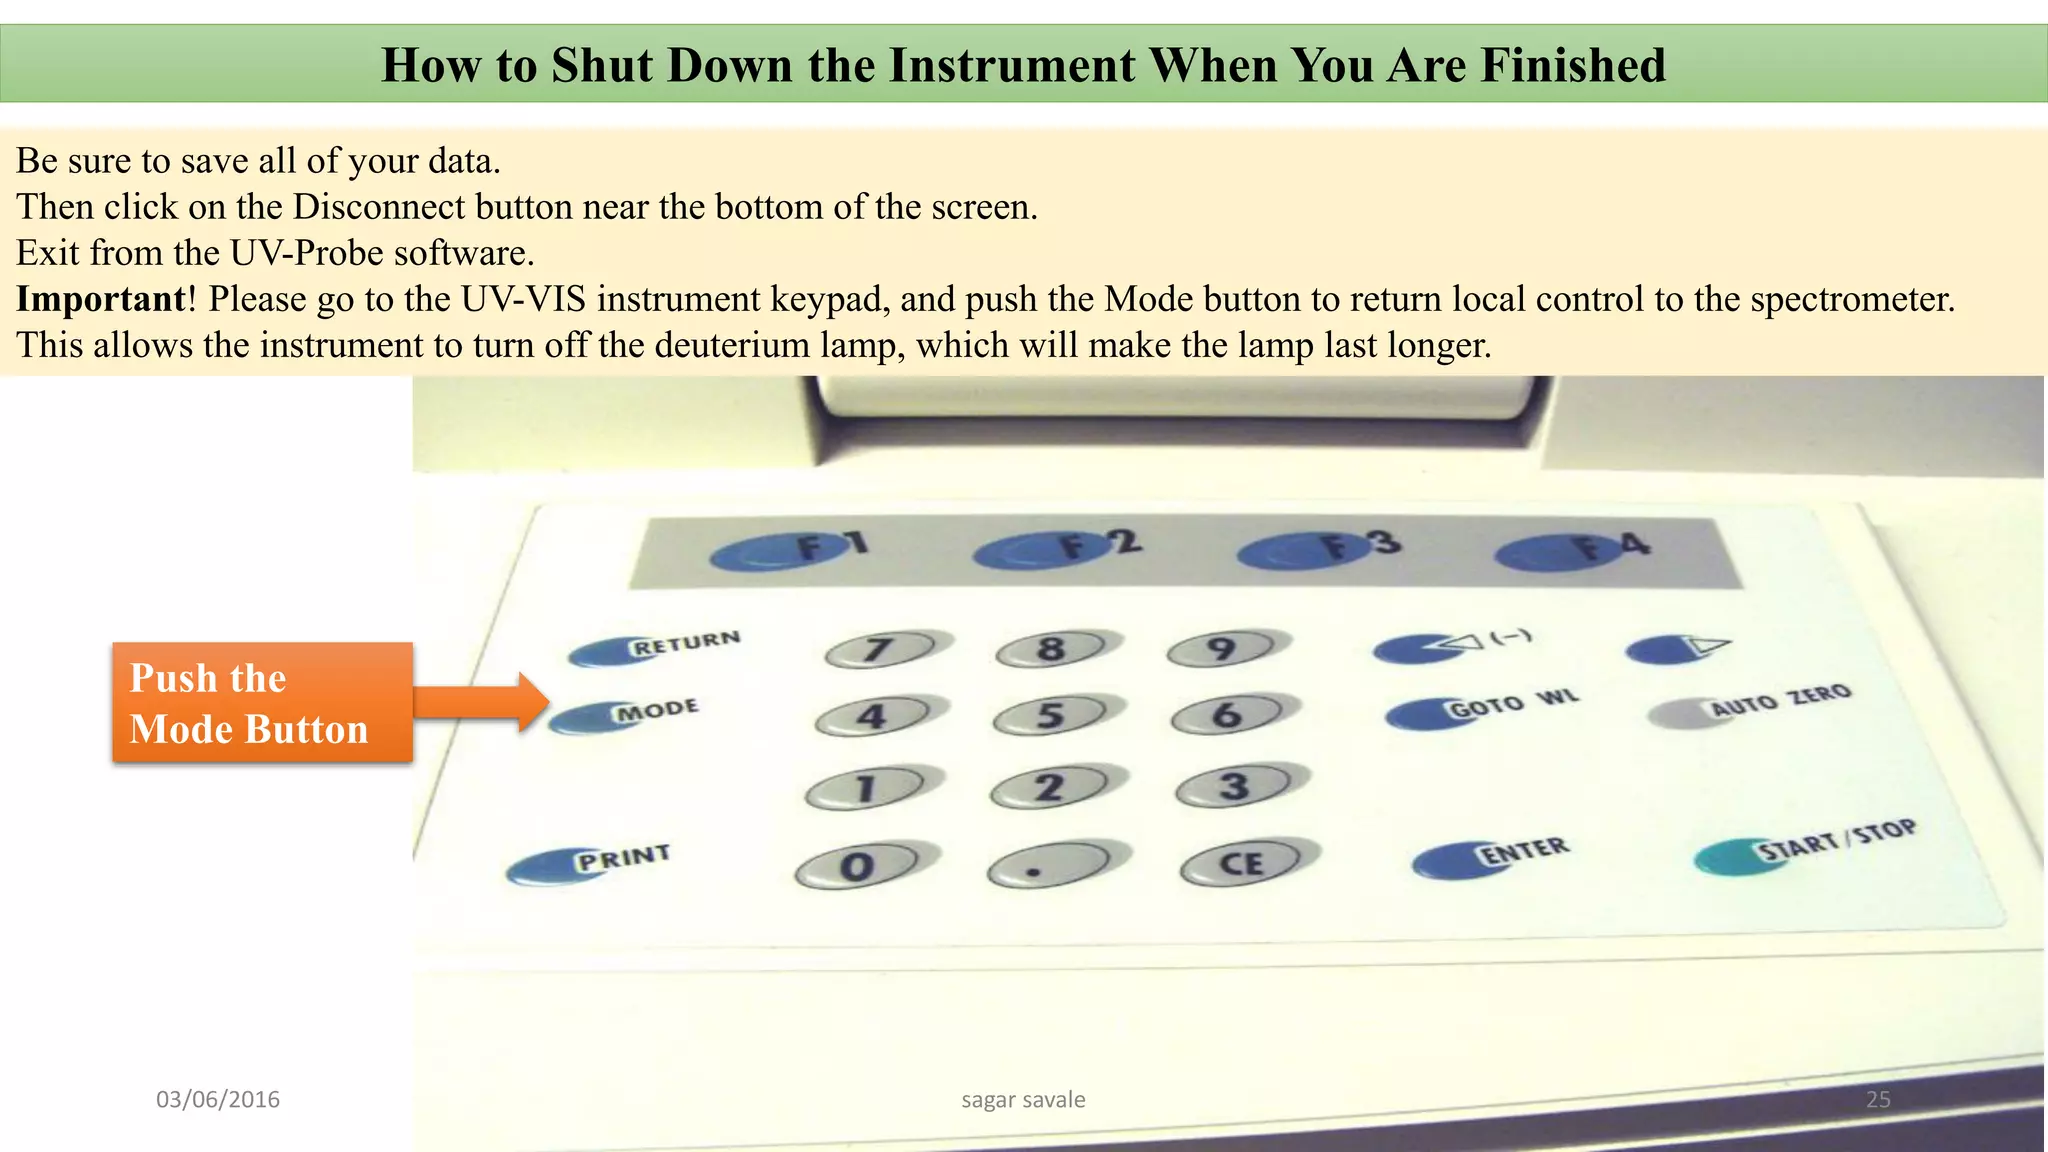


This document provides instructions for using a UV-Vis spectrophotometer. It describes how to connect to the instrument software, select operation modes for spectrum or photometric analysis, set acquisition parameters, collect and save data, and properly shut down the instrument. Spectrum mode is used for wavelength scanning, photometric mode for quantitative analysis at single wavelengths, and kinetics mode collects absorbance over time.