Download as PDF, PPTX

![The contributions of CT to an improved
understanding of the lungs has been recently
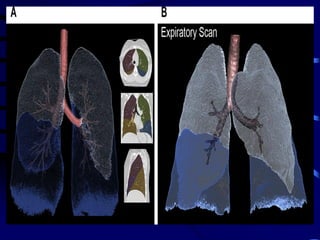
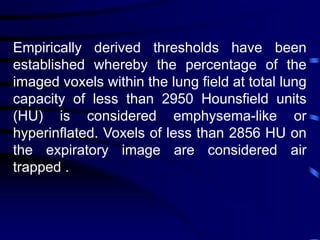
reviewed.Typically, imaging is performed at
full inspiration (total lung capacity [TLC]; and
end expiration, either at residual volume or
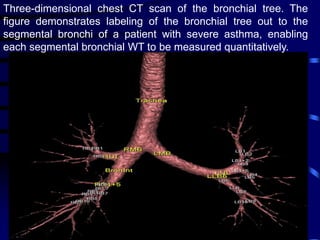
functional residual capacity .Protocols for
specific scanners and automated image
analysis software are used to identify the
lungs, lobes ,airway tree , and vascular tree.](https://image.slidesharecdn.com/usingimagingasabiomarkerforasthma-170804213643/85/Using-Imaging-as-a-Biomarker-for-Asthma-13-320.jpg)
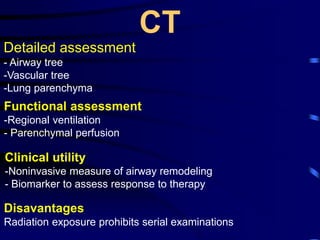
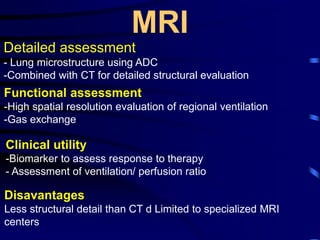
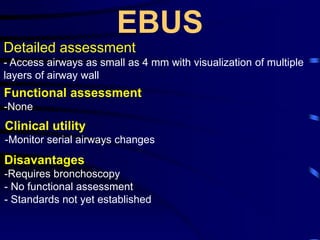
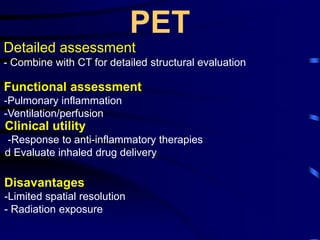


1. Several imaging modalities can provide detailed assessment of lung structure and function in asthmatic patients, including CT, MRI, PET, OCT, and EBUS. 2. Measurements from CT such as airway wall thickness, air trapping, and ventilation defects have been shown to correlate with disease severity and control. 3. Imaging measurements can serve as biomarkers to evaluate responses to new therapies like inhaled corticosteroids and anti-IL5 monoclonal antibodies, and determine if treatments are modifying the disease course.