Downloaded 228 times


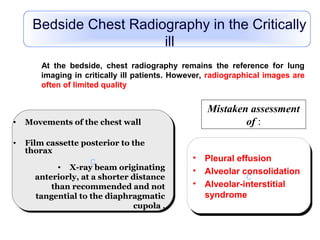
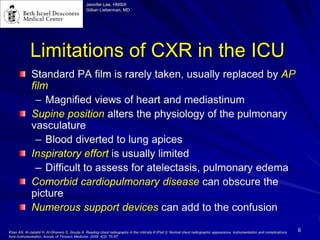


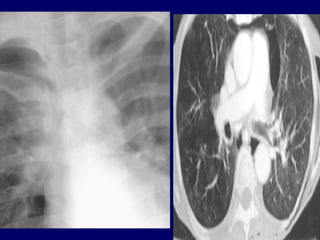
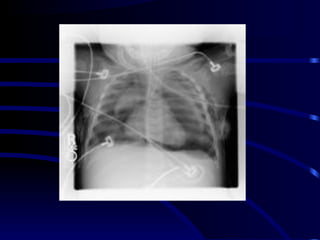
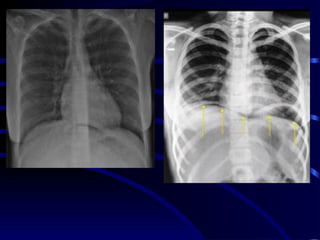
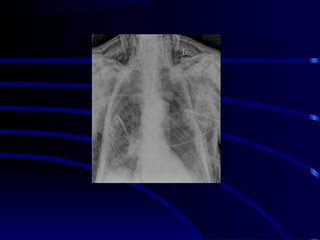

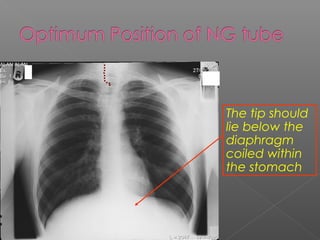
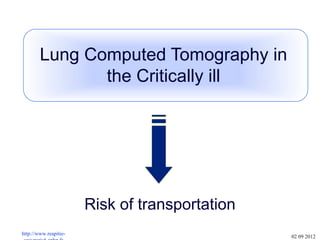


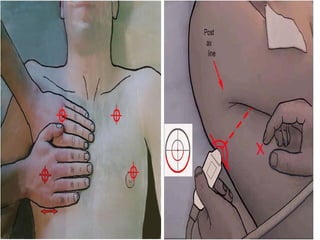
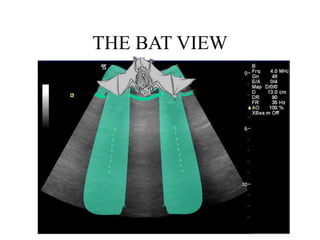


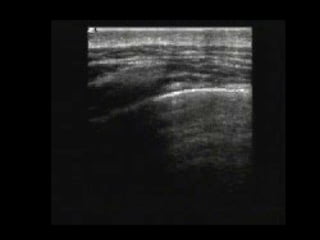
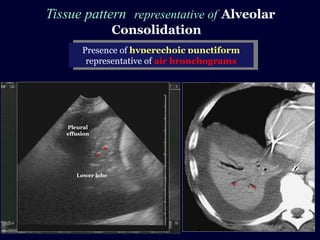
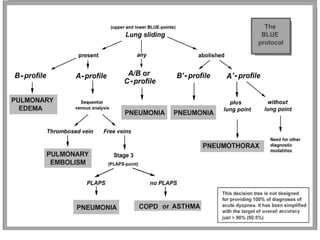


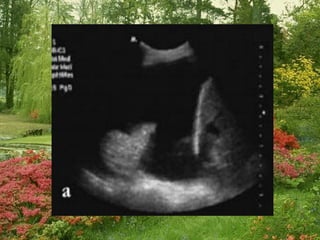
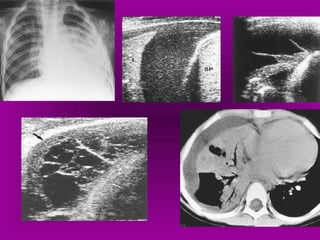
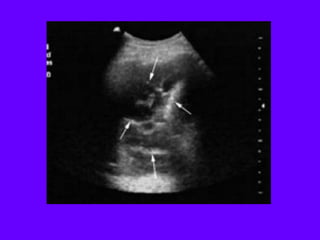
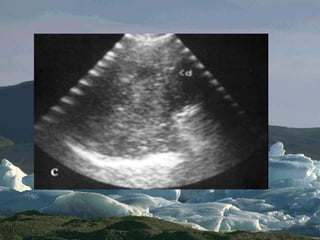
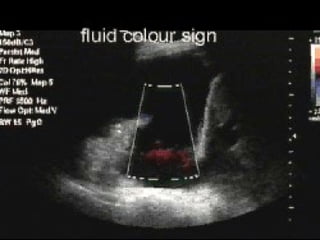
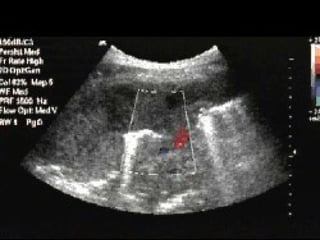
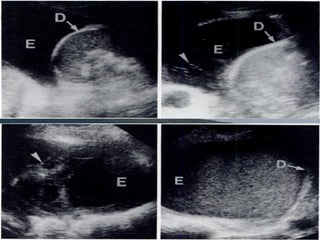
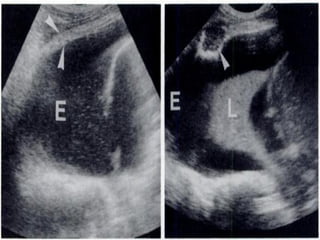

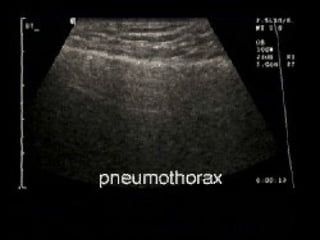


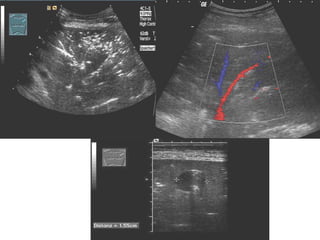

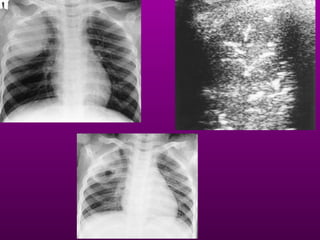
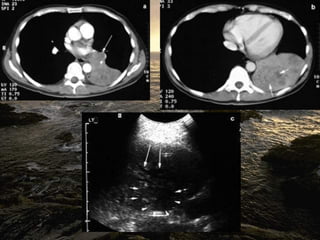
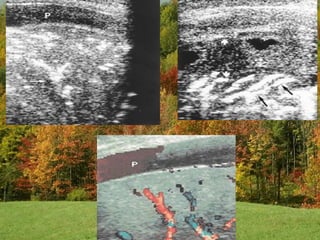


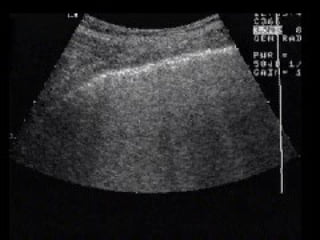
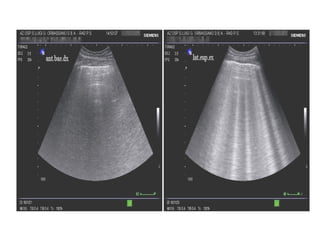
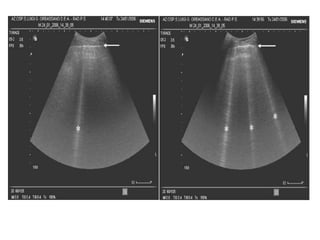
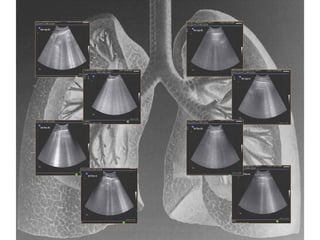

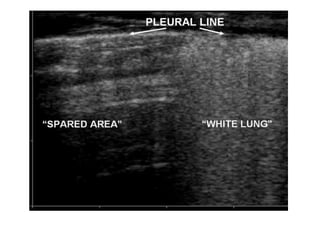
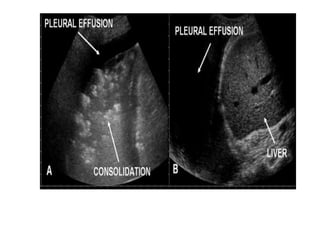

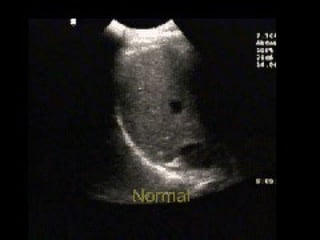
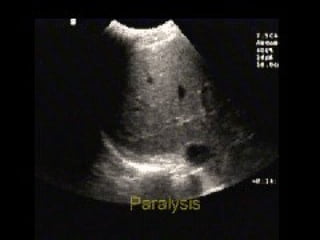


Chest radiography remains the primary imaging modality for critically ill patients, however images are often limited quality due to patient movement and positioning challenges. Mistakes can occur in assessing conditions like pleural effusions or infiltrates. Routine daily chest x-rays are not recommended for ICU patients unless clinically indicated. Ultrasound is a useful bedside tool for evaluating the lungs, IVC, heart, and detecting pneumothorax. Computed tomography can also be used but requires transporting unstable patients.


