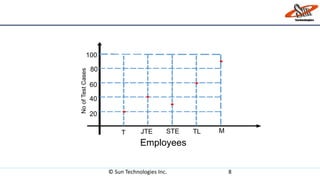
SlideShare a Scribd company logo
© Sun Technologies Inc. 1
Scatter Diagram
© Sun Technologies Inc. 2
What is Scatter Diagram?
The scatter diagram graphs pairs of numerical data, with
one variable on each axis, to look for a relationship
between them. If the variables are correlated, the points
will fall along a line or curve.
© Sun Technologies Inc. 3
‱ The scatter diagram is used to find the
correlation between two variables.
‱ This diagram shows you how closely the
two variables are related.
‱ After determining the correlation between
the variables, you can easily predict the
behavior of the other variable.
‱ This chart is very useful when one
variable is easy to measure and the other
is not.
© Sun Technologies Inc. 4
When to Use a Scatter Diagram?
When you have paired numerical data.
When your dependent variable may have multiple values for
each value of your independent variable.
When trying to determine whether the two variables are related,
such as,
‱ When trying to identify potential root causes of problems.
‱ When testing for autocorrelation before constructing a control chart.
© Sun Technologies Inc. 5
Limitations of a Scatter Diagram
The following are a few limitations of a scatter diagram:
‱ Scatter diagram is unable to give you the exact extent of
correlation.
‱ Scatter diagram does not show you the quantitative measure of
the relationship between the variable. It only shows the
quantitative expression of the quantitative change.
‱ This chart does not show you the relationship for more than two
variables.
© Sun Technologies Inc. 6
Benefits of a Scatter Diagram
The following are a few advantages of a scatter diagram:
‱ It shows the relationship between two variables.
‱ It is the best method to show you a non-linear pattern.
‱ The range of data flow, i.e. maximum and minimum value, can be
easily determined.
‱ Observation and reading is straightforward.
‱ Plotting the diagram is relatively simple.
© Sun Technologies Inc. 7
Example
By using two variables, Test Cases and Employees with designation in scatter diagram, it is
easy to determine the best productivity of employees.
Test Cases Employees
90 Manager
60 Test lead
35 Senior Test Engineer
40 Junior Test Engineer
20 Trainee
© Sun Technologies Inc. 8
T JTE STE TL M
20
40
60
80
100
Employees
NoofTestCases
© Sun Technologies Inc. 9
Thank you

More Related Content

What's hot

Standard deviation
Standard deviationStandard deviation
Karl pearson's coefficient of correlation (1)
Karl pearson's coefficient of correlation (1)Karl pearson's coefficient of correlation (1)
Karl pearson's coefficient of correlation (1)
teenathankachen1993
 
Karl pearson's correlation
Karl pearson's correlationKarl pearson's correlation
Karl pearson's correlation
fairoos1
 
T test
T testT test
T test
sai precious
 
Regression
RegressionRegression
Regression
Buddy Krishna
 
What is statistics
What is statisticsWhat is statistics
What is statistics
Raj Teotia
 
Correlation and Regression
Correlation and RegressionCorrelation and Regression
Correlation and Regression
Sir Parashurambhau College, Pune
 
Frequency distribution
Frequency distributionFrequency distribution
Frequency distribution
Aishwarya PT
 
Bar Diagram (chart) in Statistics presentation
Bar Diagram (chart) in Statistics presentationBar Diagram (chart) in Statistics presentation
Bar Diagram (chart) in Statistics presentation
sheiblu
 
Regression
Regression Regression
Regression
Ali Raza
 
Correlation
CorrelationCorrelation
Correlation
ancytd
 
Graphical Representation of Statistical data
Graphical Representation of Statistical dataGraphical Representation of Statistical data
Graphical Representation of Statistical data
MD SAMSER
 
Spss
SpssSpss
Spss
Tech_MX
 
Regression Analysis
Regression AnalysisRegression Analysis
Regression Analysis
Birinder Singh Gulati
 
Diagrammatic presentation of data
Diagrammatic presentation of dataDiagrammatic presentation of data
Diagrammatic presentation of data
Ajita Gupta
 
Scales of Measurement
Scales of MeasurementScales of Measurement
Scales of Measurement
loranel
 
Statistics
StatisticsStatistics
Statistics
Pranav Krishna
 
Correlation
CorrelationCorrelation
Correlation
keerthi samuel
 
Measures of Dispersion
Measures of DispersionMeasures of Dispersion
Measures of Dispersion
Birinder Singh Gulati
 
FREQUENCY DISTRIBUTION.pptx
FREQUENCY DISTRIBUTION.pptxFREQUENCY DISTRIBUTION.pptx
FREQUENCY DISTRIBUTION.pptx
SreeLatha98
 

What's hot (20)

Standard deviation
Standard deviationStandard deviation
Standard deviation
 
Karl pearson's coefficient of correlation (1)
Karl pearson's coefficient of correlation (1)Karl pearson's coefficient of correlation (1)
Karl pearson's coefficient of correlation (1)
 
Karl pearson's correlation
Karl pearson's correlationKarl pearson's correlation
Karl pearson's correlation
 
T test
T testT test
T test
 
Regression
RegressionRegression
Regression
 
What is statistics
What is statisticsWhat is statistics
What is statistics
 
Correlation and Regression
Correlation and RegressionCorrelation and Regression
Correlation and Regression
 
Frequency distribution
Frequency distributionFrequency distribution
Frequency distribution
 
Bar Diagram (chart) in Statistics presentation
Bar Diagram (chart) in Statistics presentationBar Diagram (chart) in Statistics presentation
Bar Diagram (chart) in Statistics presentation
 
Regression
Regression Regression
Regression
 
Correlation
CorrelationCorrelation
Correlation
 
Graphical Representation of Statistical data
Graphical Representation of Statistical dataGraphical Representation of Statistical data
Graphical Representation of Statistical data
 
Spss
SpssSpss
Spss
 
Regression Analysis
Regression AnalysisRegression Analysis
Regression Analysis
 
Diagrammatic presentation of data
Diagrammatic presentation of dataDiagrammatic presentation of data
Diagrammatic presentation of data
 
Scales of Measurement
Scales of MeasurementScales of Measurement
Scales of Measurement
 
Statistics
StatisticsStatistics
Statistics
 
Correlation
CorrelationCorrelation
Correlation
 
Measures of Dispersion
Measures of DispersionMeasures of Dispersion
Measures of Dispersion
 
FREQUENCY DISTRIBUTION.pptx
FREQUENCY DISTRIBUTION.pptxFREQUENCY DISTRIBUTION.pptx
FREQUENCY DISTRIBUTION.pptx
 

Similar to Scatter Diagram

scatter diagram
 scatter diagram scatter diagram
scatter diagram
shrey8916
 
Scatter plot diagram
Scatter plot diagramScatter plot diagram
Scatter plot diagram
KarthikM230
 
ppt2.pptx
ppt2.pptxppt2.pptx
Control charts
Control chartsControl charts
Control charts
Sutha Vincent
 
Regression Analysis.pptx
Regression Analysis.pptxRegression Analysis.pptx
Regression Analysis.pptx
arsh260174
 
Regression Analysis Techniques.pptx
Regression Analysis Techniques.pptxRegression Analysis Techniques.pptx
Regression Analysis Techniques.pptx
YutaItadori
 
Statistical quality control, sampling
Statistical quality control, samplingStatistical quality control, sampling
Statistical quality control, sampling
Sana Fatima
 
Artifical Intelligence And Machine Learning Algorithum.pptx
Artifical Intelligence And Machine Learning Algorithum.pptxArtifical Intelligence And Machine Learning Algorithum.pptx
Artifical Intelligence And Machine Learning Algorithum.pptx
Aishwarya SenthilNathan
 
Seven statistical tools of quality
Seven statistical tools of qualitySeven statistical tools of quality
Seven statistical tools of quality
Balaji Tamilselvam
 
Msa
MsaMsa
Msa
tkhurshid
 
Basic understanding of Plots and diagrams used in data interpretation
 Basic understanding of Plots and diagrams used in data interpretation   Basic understanding of Plots and diagrams used in data interpretation
Basic understanding of Plots and diagrams used in data interpretation
Subedi Suraj
 
Useful Tools for Problem Solving by Operational Excellence Consulting
Useful Tools for Problem Solving by Operational Excellence ConsultingUseful Tools for Problem Solving by Operational Excellence Consulting
Useful Tools for Problem Solving by Operational Excellence Consulting
Operational Excellence Consulting
 
Feature Scaling and Normalization Feature Scaling and Normalization.pptx
Feature Scaling and Normalization Feature Scaling and Normalization.pptxFeature Scaling and Normalization Feature Scaling and Normalization.pptx
Feature Scaling and Normalization Feature Scaling and Normalization.pptx
Nishant83346
 
linearregression-1909240jhgg53948.pptx
linearregression-1909240jhgg53948.pptxlinearregression-1909240jhgg53948.pptx
linearregression-1909240jhgg53948.pptx
bishalnandi2
 
Big Data Project - Final version
Big Data Project - Final versionBig Data Project - Final version
Big Data Project - Final version
Mihir Sanghavi
 
Different types of charts
Different types of chartsDifferent types of charts
Different types of charts
Zakaria Salim
 
7 QC Tools for data analysis and problem solving
7 QC Tools for data analysis and problem solving7 QC Tools for data analysis and problem solving
7 QC Tools for data analysis and problem solving
papplion
 
1133629601 400440
1133629601 4004401133629601 400440
1133629601 400440
VishalSarin3
 
7 tools essential for quality control.pptx
7 tools essential for quality control.pptx7 tools essential for quality control.pptx
7 tools essential for quality control.pptx
srivastavavaibhav129
 
ACTIVITY DIAGRAM.pptx
ACTIVITY DIAGRAM.pptxACTIVITY DIAGRAM.pptx
ACTIVITY DIAGRAM.pptx
devboris1
 

Similar to Scatter Diagram (20)

scatter diagram
 scatter diagram scatter diagram
scatter diagram
 
Scatter plot diagram
Scatter plot diagramScatter plot diagram
Scatter plot diagram
 
ppt2.pptx
ppt2.pptxppt2.pptx
ppt2.pptx
 
Control charts
Control chartsControl charts
Control charts
 
Regression Analysis.pptx
Regression Analysis.pptxRegression Analysis.pptx
Regression Analysis.pptx
 
Regression Analysis Techniques.pptx
Regression Analysis Techniques.pptxRegression Analysis Techniques.pptx
Regression Analysis Techniques.pptx
 
Statistical quality control, sampling
Statistical quality control, samplingStatistical quality control, sampling
Statistical quality control, sampling
 
Artifical Intelligence And Machine Learning Algorithum.pptx
Artifical Intelligence And Machine Learning Algorithum.pptxArtifical Intelligence And Machine Learning Algorithum.pptx
Artifical Intelligence And Machine Learning Algorithum.pptx
 
Seven statistical tools of quality
Seven statistical tools of qualitySeven statistical tools of quality
Seven statistical tools of quality
 
Msa
MsaMsa
Msa
 
Basic understanding of Plots and diagrams used in data interpretation
 Basic understanding of Plots and diagrams used in data interpretation   Basic understanding of Plots and diagrams used in data interpretation
Basic understanding of Plots and diagrams used in data interpretation
 
Useful Tools for Problem Solving by Operational Excellence Consulting
Useful Tools for Problem Solving by Operational Excellence ConsultingUseful Tools for Problem Solving by Operational Excellence Consulting
Useful Tools for Problem Solving by Operational Excellence Consulting
 
Feature Scaling and Normalization Feature Scaling and Normalization.pptx
Feature Scaling and Normalization Feature Scaling and Normalization.pptxFeature Scaling and Normalization Feature Scaling and Normalization.pptx
Feature Scaling and Normalization Feature Scaling and Normalization.pptx
 
linearregression-1909240jhgg53948.pptx
linearregression-1909240jhgg53948.pptxlinearregression-1909240jhgg53948.pptx
linearregression-1909240jhgg53948.pptx
 
Big Data Project - Final version
Big Data Project - Final versionBig Data Project - Final version
Big Data Project - Final version
 
Different types of charts
Different types of chartsDifferent types of charts
Different types of charts
 
7 QC Tools for data analysis and problem solving
7 QC Tools for data analysis and problem solving7 QC Tools for data analysis and problem solving
7 QC Tools for data analysis and problem solving
 
1133629601 400440
1133629601 4004401133629601 400440
1133629601 400440
 
7 tools essential for quality control.pptx
7 tools essential for quality control.pptx7 tools essential for quality control.pptx
7 tools essential for quality control.pptx
 
ACTIVITY DIAGRAM.pptx
ACTIVITY DIAGRAM.pptxACTIVITY DIAGRAM.pptx
ACTIVITY DIAGRAM.pptx
 

More from Sun Technologies

Review
ReviewReview
Runchart
RunchartRunchart
Runchart
Sun Technologies
 
Pareto diagram
Pareto diagramPareto diagram
Pareto diagram
Sun Technologies
 
Histogram
HistogramHistogram
Histogram
Sun Technologies
 
Control chart
Control chartControl chart
Control chart
Sun Technologies
 
Checklist
ChecklistChecklist
Checklist
Sun Technologies
 
Cause effect diagram
Cause effect diagramCause effect diagram
Cause effect diagram
Sun Technologies
 

More from Sun Technologies (7)

Review
ReviewReview
Review
 
Runchart
RunchartRunchart
Runchart
 
Pareto diagram
Pareto diagramPareto diagram
Pareto diagram
 
Histogram
HistogramHistogram
Histogram
 
Control chart
Control chartControl chart
Control chart
 
Checklist
ChecklistChecklist
Checklist
 
Cause effect diagram
Cause effect diagramCause effect diagram
Cause effect diagram
 

Recently uploaded

Introducing Crescat - Event Management Software for Venues, Festivals and Eve...
Introducing Crescat - Event Management Software for Venues, Festivals and Eve...Introducing Crescat - Event Management Software for Venues, Festivals and Eve...
Introducing Crescat - Event Management Software for Venues, Festivals and Eve...
Crescat
 
AI Fusion Buddy Review: Brand New, Groundbreaking Gemini-Powered AI App
AI Fusion Buddy Review: Brand New, Groundbreaking Gemini-Powered AI AppAI Fusion Buddy Review: Brand New, Groundbreaking Gemini-Powered AI App
AI Fusion Buddy Review: Brand New, Groundbreaking Gemini-Powered AI App
Google
 
Neo4j - Product Vision and Knowledge Graphs - GraphSummit Paris
Neo4j - Product Vision and Knowledge Graphs - GraphSummit ParisNeo4j - Product Vision and Knowledge Graphs - GraphSummit Paris
Neo4j - Product Vision and Knowledge Graphs - GraphSummit Paris
Neo4j
 
Empowering Growth with Best Software Development Company in Noida - Deuglo
Empowering Growth with Best Software  Development Company in Noida - DeugloEmpowering Growth with Best Software  Development Company in Noida - Deuglo
Empowering Growth with Best Software Development Company in Noida - Deuglo
Deuglo Infosystem Pvt Ltd
 
OpenMetadata Community Meeting - 5th June 2024
OpenMetadata Community Meeting - 5th June 2024OpenMetadata Community Meeting - 5th June 2024
OpenMetadata Community Meeting - 5th June 2024
OpenMetadata
 
Atelier - Innover avec l’IA GĂ©nĂ©rative et les graphes de connaissances
Atelier - Innover avec l’IA GĂ©nĂ©rative et les graphes de connaissancesAtelier - Innover avec l’IA GĂ©nĂ©rative et les graphes de connaissances
Atelier - Innover avec l’IA GĂ©nĂ©rative et les graphes de connaissances
Neo4j
 
LORRAINE ANDREI_LEQUIGAN_HOW TO USE WHATSAPP.pptx
LORRAINE ANDREI_LEQUIGAN_HOW TO USE WHATSAPP.pptxLORRAINE ANDREI_LEQUIGAN_HOW TO USE WHATSAPP.pptx
LORRAINE ANDREI_LEQUIGAN_HOW TO USE WHATSAPP.pptx
lorraineandreiamcidl
 
Microservice Teams - How the cloud changes the way we work
Microservice Teams - How the cloud changes the way we workMicroservice Teams - How the cloud changes the way we work
Microservice Teams - How the cloud changes the way we work
Sven Peters
 
Using Xen Hypervisor for Functional Safety
Using Xen Hypervisor for Functional SafetyUsing Xen Hypervisor for Functional Safety
Using Xen Hypervisor for Functional Safety
Ayan Halder
 
Graspan: A Big Data System for Big Code Analysis
Graspan: A Big Data System for Big Code AnalysisGraspan: A Big Data System for Big Code Analysis
Graspan: A Big Data System for Big Code Analysis
Aftab Hussain
 
How to write a program in any programming language
How to write a program in any programming languageHow to write a program in any programming language
How to write a program in any programming language
Rakesh Kumar R
 
Measures in SQL (SIGMOD 2024, Santiago, Chile)
Measures in SQL (SIGMOD 2024, Santiago, Chile)Measures in SQL (SIGMOD 2024, Santiago, Chile)
Measures in SQL (SIGMOD 2024, Santiago, Chile)
Julian Hyde
 
KuberTENes Birthday Bash Guadalajara - IntroducciĂłn a Argo CD
KuberTENes Birthday Bash Guadalajara - IntroducciĂłn a Argo CDKuberTENes Birthday Bash Guadalajara - IntroducciĂłn a Argo CD
KuberTENes Birthday Bash Guadalajara - IntroducciĂłn a Argo CD
rodomar2
 
E-commerce Development Services- Hornet Dynamics
E-commerce Development Services- Hornet DynamicsE-commerce Development Services- Hornet Dynamics
E-commerce Development Services- Hornet Dynamics
Hornet Dynamics
 
2024 eCommerceDays Toulouse - Sylius 2.0.pdf
2024 eCommerceDays Toulouse - Sylius 2.0.pdf2024 eCommerceDays Toulouse - Sylius 2.0.pdf
2024 eCommerceDays Toulouse - Sylius 2.0.pdf
Ɓukasz Chruƛciel
 
LORRAINE ANDREI_LEQUIGAN_HOW TO USE ZOOM
LORRAINE ANDREI_LEQUIGAN_HOW TO USE ZOOMLORRAINE ANDREI_LEQUIGAN_HOW TO USE ZOOM
LORRAINE ANDREI_LEQUIGAN_HOW TO USE ZOOM
lorraineandreiamcidl
 
Energy consumption of Database Management - Florina Jonuzi
Energy consumption of Database Management - Florina JonuziEnergy consumption of Database Management - Florina Jonuzi
Energy consumption of Database Management - Florina Jonuzi
Green Software Development
 
openEuler Case Study - The Journey to Supply Chain Security
openEuler Case Study - The Journey to Supply Chain SecurityopenEuler Case Study - The Journey to Supply Chain Security
openEuler Case Study - The Journey to Supply Chain Security
Shane Coughlan
 
GraphSummit Paris - The art of the possible with Graph Technology
GraphSummit Paris - The art of the possible with Graph TechnologyGraphSummit Paris - The art of the possible with Graph Technology
GraphSummit Paris - The art of the possible with Graph Technology
Neo4j
 
SMS API Integration in Saudi Arabia| Best SMS API Service
SMS API Integration in Saudi Arabia| Best SMS API ServiceSMS API Integration in Saudi Arabia| Best SMS API Service
SMS API Integration in Saudi Arabia| Best SMS API Service
Yara Milbes
 

Recently uploaded (20)

Introducing Crescat - Event Management Software for Venues, Festivals and Eve...
Introducing Crescat - Event Management Software for Venues, Festivals and Eve...Introducing Crescat - Event Management Software for Venues, Festivals and Eve...
Introducing Crescat - Event Management Software for Venues, Festivals and Eve...
 
AI Fusion Buddy Review: Brand New, Groundbreaking Gemini-Powered AI App
AI Fusion Buddy Review: Brand New, Groundbreaking Gemini-Powered AI AppAI Fusion Buddy Review: Brand New, Groundbreaking Gemini-Powered AI App
AI Fusion Buddy Review: Brand New, Groundbreaking Gemini-Powered AI App
 
Neo4j - Product Vision and Knowledge Graphs - GraphSummit Paris
Neo4j - Product Vision and Knowledge Graphs - GraphSummit ParisNeo4j - Product Vision and Knowledge Graphs - GraphSummit Paris
Neo4j - Product Vision and Knowledge Graphs - GraphSummit Paris
 
Empowering Growth with Best Software Development Company in Noida - Deuglo
Empowering Growth with Best Software  Development Company in Noida - DeugloEmpowering Growth with Best Software  Development Company in Noida - Deuglo
Empowering Growth with Best Software Development Company in Noida - Deuglo
 
OpenMetadata Community Meeting - 5th June 2024
OpenMetadata Community Meeting - 5th June 2024OpenMetadata Community Meeting - 5th June 2024
OpenMetadata Community Meeting - 5th June 2024
 
Atelier - Innover avec l’IA GĂ©nĂ©rative et les graphes de connaissances
Atelier - Innover avec l’IA GĂ©nĂ©rative et les graphes de connaissancesAtelier - Innover avec l’IA GĂ©nĂ©rative et les graphes de connaissances
Atelier - Innover avec l’IA GĂ©nĂ©rative et les graphes de connaissances
 
LORRAINE ANDREI_LEQUIGAN_HOW TO USE WHATSAPP.pptx
LORRAINE ANDREI_LEQUIGAN_HOW TO USE WHATSAPP.pptxLORRAINE ANDREI_LEQUIGAN_HOW TO USE WHATSAPP.pptx
LORRAINE ANDREI_LEQUIGAN_HOW TO USE WHATSAPP.pptx
 
Microservice Teams - How the cloud changes the way we work
Microservice Teams - How the cloud changes the way we workMicroservice Teams - How the cloud changes the way we work
Microservice Teams - How the cloud changes the way we work
 
Using Xen Hypervisor for Functional Safety
Using Xen Hypervisor for Functional SafetyUsing Xen Hypervisor for Functional Safety
Using Xen Hypervisor for Functional Safety
 
Graspan: A Big Data System for Big Code Analysis
Graspan: A Big Data System for Big Code AnalysisGraspan: A Big Data System for Big Code Analysis
Graspan: A Big Data System for Big Code Analysis
 
How to write a program in any programming language
How to write a program in any programming languageHow to write a program in any programming language
How to write a program in any programming language
 
Measures in SQL (SIGMOD 2024, Santiago, Chile)
Measures in SQL (SIGMOD 2024, Santiago, Chile)Measures in SQL (SIGMOD 2024, Santiago, Chile)
Measures in SQL (SIGMOD 2024, Santiago, Chile)
 
KuberTENes Birthday Bash Guadalajara - IntroducciĂłn a Argo CD
KuberTENes Birthday Bash Guadalajara - IntroducciĂłn a Argo CDKuberTENes Birthday Bash Guadalajara - IntroducciĂłn a Argo CD
KuberTENes Birthday Bash Guadalajara - IntroducciĂłn a Argo CD
 
E-commerce Development Services- Hornet Dynamics
E-commerce Development Services- Hornet DynamicsE-commerce Development Services- Hornet Dynamics
E-commerce Development Services- Hornet Dynamics
 
2024 eCommerceDays Toulouse - Sylius 2.0.pdf
2024 eCommerceDays Toulouse - Sylius 2.0.pdf2024 eCommerceDays Toulouse - Sylius 2.0.pdf
2024 eCommerceDays Toulouse - Sylius 2.0.pdf
 
LORRAINE ANDREI_LEQUIGAN_HOW TO USE ZOOM
LORRAINE ANDREI_LEQUIGAN_HOW TO USE ZOOMLORRAINE ANDREI_LEQUIGAN_HOW TO USE ZOOM
LORRAINE ANDREI_LEQUIGAN_HOW TO USE ZOOM
 
Energy consumption of Database Management - Florina Jonuzi
Energy consumption of Database Management - Florina JonuziEnergy consumption of Database Management - Florina Jonuzi
Energy consumption of Database Management - Florina Jonuzi
 
openEuler Case Study - The Journey to Supply Chain Security
openEuler Case Study - The Journey to Supply Chain SecurityopenEuler Case Study - The Journey to Supply Chain Security
openEuler Case Study - The Journey to Supply Chain Security
 
GraphSummit Paris - The art of the possible with Graph Technology
GraphSummit Paris - The art of the possible with Graph TechnologyGraphSummit Paris - The art of the possible with Graph Technology
GraphSummit Paris - The art of the possible with Graph Technology
 
SMS API Integration in Saudi Arabia| Best SMS API Service
SMS API Integration in Saudi Arabia| Best SMS API ServiceSMS API Integration in Saudi Arabia| Best SMS API Service
SMS API Integration in Saudi Arabia| Best SMS API Service
 

Scatter Diagram

  • 1. © Sun Technologies Inc. 1 Scatter Diagram
  • 2. © Sun Technologies Inc. 2 What is Scatter Diagram? The scatter diagram graphs pairs of numerical data, with one variable on each axis, to look for a relationship between them. If the variables are correlated, the points will fall along a line or curve.
  • 3. © Sun Technologies Inc. 3 ‱ The scatter diagram is used to find the correlation between two variables. ‱ This diagram shows you how closely the two variables are related. ‱ After determining the correlation between the variables, you can easily predict the behavior of the other variable. ‱ This chart is very useful when one variable is easy to measure and the other is not.
  • 4. © Sun Technologies Inc. 4 When to Use a Scatter Diagram? When you have paired numerical data. When your dependent variable may have multiple values for each value of your independent variable. When trying to determine whether the two variables are related, such as, ‱ When trying to identify potential root causes of problems. ‱ When testing for autocorrelation before constructing a control chart.
  • 5. © Sun Technologies Inc. 5 Limitations of a Scatter Diagram The following are a few limitations of a scatter diagram: ‱ Scatter diagram is unable to give you the exact extent of correlation. ‱ Scatter diagram does not show you the quantitative measure of the relationship between the variable. It only shows the quantitative expression of the quantitative change. ‱ This chart does not show you the relationship for more than two variables.
  • 6. © Sun Technologies Inc. 6 Benefits of a Scatter Diagram The following are a few advantages of a scatter diagram: ‱ It shows the relationship between two variables. ‱ It is the best method to show you a non-linear pattern. ‱ The range of data flow, i.e. maximum and minimum value, can be easily determined. ‱ Observation and reading is straightforward. ‱ Plotting the diagram is relatively simple.
  • 7. © Sun Technologies Inc. 7 Example By using two variables, Test Cases and Employees with designation in scatter diagram, it is easy to determine the best productivity of employees. Test Cases Employees 90 Manager 60 Test lead 35 Senior Test Engineer 40 Junior Test Engineer 20 Trainee
  • 8. © Sun Technologies Inc. 8 T JTE STE TL M 20 40 60 80 100 Employees NoofTestCases
  • 9. © Sun Technologies Inc. 9 Thank you