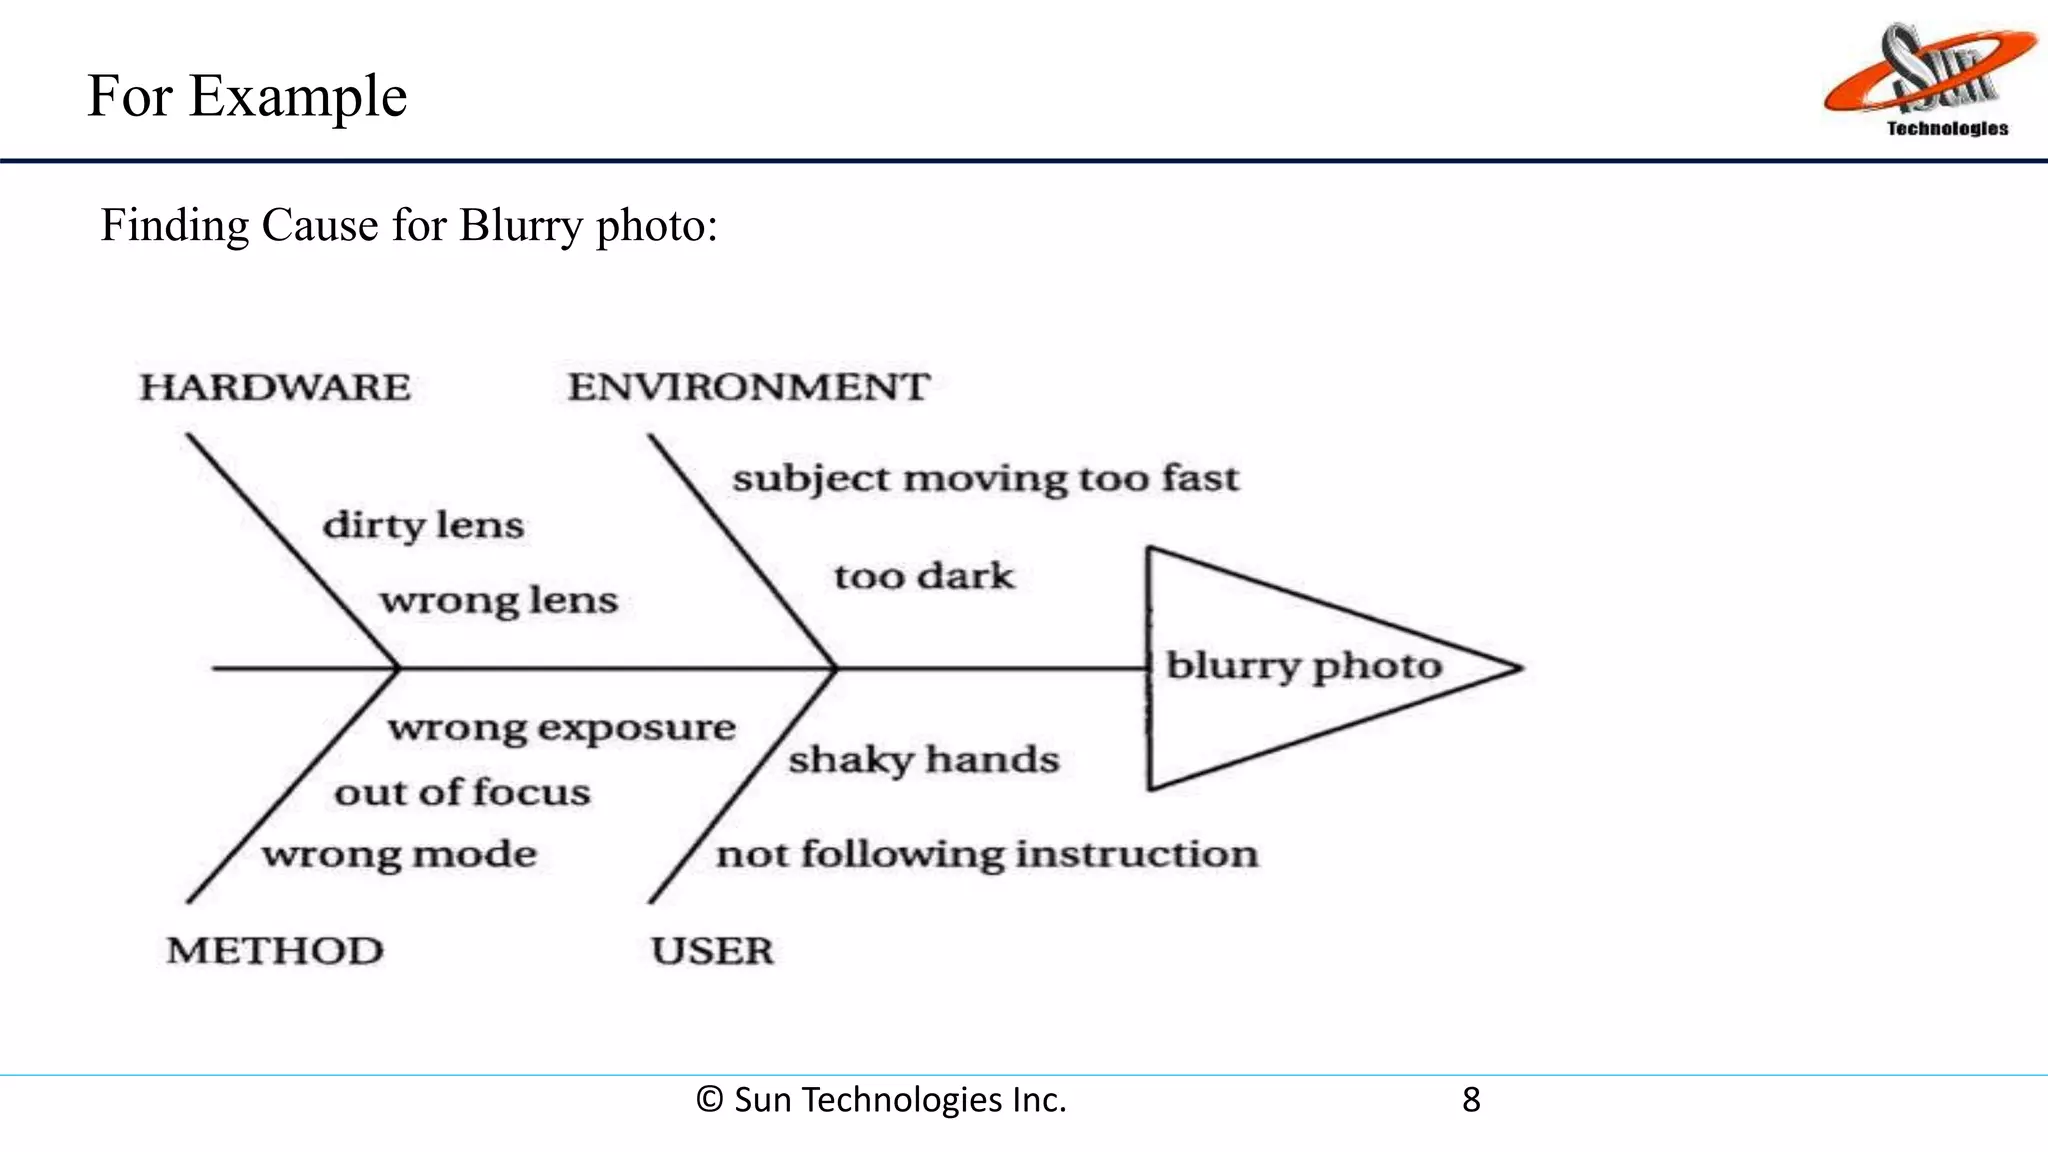
© Sun Technologies Inc. 1
Cause and
Effect Diagram
© Sun Technologies Inc. 2
What is Cause and Effect Analysis?
Cause and Effect Analysis is a technique for identifying all the possible
causes (input condition) associated with a particular problem / effect (output
condition).
© Sun Technologies Inc. 3
Cause and Effect Analysis is a valuable tool for:
• Focusing on causes not symptoms
• Providing a picture of why an effect is happening
• Establishing a basis for further data gathering and action
• Cause and Effect Analysis can also be used to identify all of the areas that need to
be tackled to generate a positive effect.
Why use Cause and Effect Analysis
© Sun Technologies Inc. 4
What is a Cause and Effect Diagram?
A Cause and Effect diagram (also known as a Fishbone or Ishikawa diagram)
graphically illustrates the results of the analysis and is constructed in steps.
• Cause-and-Effect diagrams graphically display potential causes of a problem
• The layout shows Cause-and-Effect relationships between the potential
causes.
© Sun Technologies Inc. 5
Why use a Cause and Effect Diagram?
• It is common for people working on improvement efforts to jump to conclusions without studying the
causes, target one possible cause while ignoring others, and take actions aimed at surface symptoms
• Cause-and-effect diagrams are designed to:
• Providing a structure to understand the relationships between many possible causes of a problem
• Giving people a framework for planning what data to collect
• Serving as a visual display of causes that have been studied
• Helping team members communicate within the team and with the rest of the organization
© Sun Technologies Inc. 6
How do I do it?
Identify the Problem/Issue
• Select a particular problem, issue or effect.
• Make sure the problem is specific, tightly defined and relatively small in scope and that
everyone participating understands exactly what is being analysed.
• Write the problem definition at the top.
© Sun Technologies Inc. 7
How do I do it? (continued)
Draw fishbone diagram
• Place the effect at the head of the “fish”
• Include the 6 recommended categories shown below
Problem
or Issue
Method Machine
Environment Measurement System
People
Material
For Example
© Sun Technologies Inc. 8
Finding Cause for Blurry photo:
• The resulting diagram illustrates the main causes and sub-causes leading to an effect.
• Analyse the diagram and identify the root cause of the effect that is been noted.
• Solve the problem by examining the root cause.
© Sun Technologies Inc. 9
How do I do it? (continued)
Reference
© Sun Technologies Inc. 10
http://www.airccse.org/journal/mvsc/papers/3212ijmvsc02.pdf
http://www.academicjournals.org/journal/AJBM/article-full-text-pdf/AA1143816550
http://asq.org/learn-about-quality/cause-analysis-tools/overview/fishbone.html

Cause effect diagram

  • 1.
    © Sun TechnologiesInc. 1 Cause and Effect Diagram
  • 2.
    © Sun TechnologiesInc. 2 What is Cause and Effect Analysis? Cause and Effect Analysis is a technique for identifying all the possible causes (input condition) associated with a particular problem / effect (output condition).
  • 3.
    © Sun TechnologiesInc. 3 Cause and Effect Analysis is a valuable tool for: • Focusing on causes not symptoms • Providing a picture of why an effect is happening • Establishing a basis for further data gathering and action • Cause and Effect Analysis can also be used to identify all of the areas that need to be tackled to generate a positive effect. Why use Cause and Effect Analysis
  • 4.
    © Sun TechnologiesInc. 4 What is a Cause and Effect Diagram? A Cause and Effect diagram (also known as a Fishbone or Ishikawa diagram) graphically illustrates the results of the analysis and is constructed in steps. • Cause-and-Effect diagrams graphically display potential causes of a problem • The layout shows Cause-and-Effect relationships between the potential causes.
  • 5.
    © Sun TechnologiesInc. 5 Why use a Cause and Effect Diagram? • It is common for people working on improvement efforts to jump to conclusions without studying the causes, target one possible cause while ignoring others, and take actions aimed at surface symptoms • Cause-and-effect diagrams are designed to: • Providing a structure to understand the relationships between many possible causes of a problem • Giving people a framework for planning what data to collect • Serving as a visual display of causes that have been studied • Helping team members communicate within the team and with the rest of the organization
  • 6.
    © Sun TechnologiesInc. 6 How do I do it? Identify the Problem/Issue • Select a particular problem, issue or effect. • Make sure the problem is specific, tightly defined and relatively small in scope and that everyone participating understands exactly what is being analysed. • Write the problem definition at the top.
  • 7.
    © Sun TechnologiesInc. 7 How do I do it? (continued) Draw fishbone diagram • Place the effect at the head of the “fish” • Include the 6 recommended categories shown below Problem or Issue Method Machine Environment Measurement System People Material
  • 8.
    For Example © SunTechnologies Inc. 8 Finding Cause for Blurry photo:
  • 9.
    • The resultingdiagram illustrates the main causes and sub-causes leading to an effect. • Analyse the diagram and identify the root cause of the effect that is been noted. • Solve the problem by examining the root cause. © Sun Technologies Inc. 9 How do I do it? (continued)
  • 10.
    Reference © Sun TechnologiesInc. 10 http://www.airccse.org/journal/mvsc/papers/3212ijmvsc02.pdf http://www.academicjournals.org/journal/AJBM/article-full-text-pdf/AA1143816550 http://asq.org/learn-about-quality/cause-analysis-tools/overview/fishbone.html