- A run chart is a line graph that displays observed data over time and can show how a process is running, revealing important early information before large amounts of data are collected, though it cannot determine process stability.
- Run charts can detect "special causes" or outliers if 3 or more consecutive points fall on one side of the center line, indicating something beyond normal variability is influencing the process.
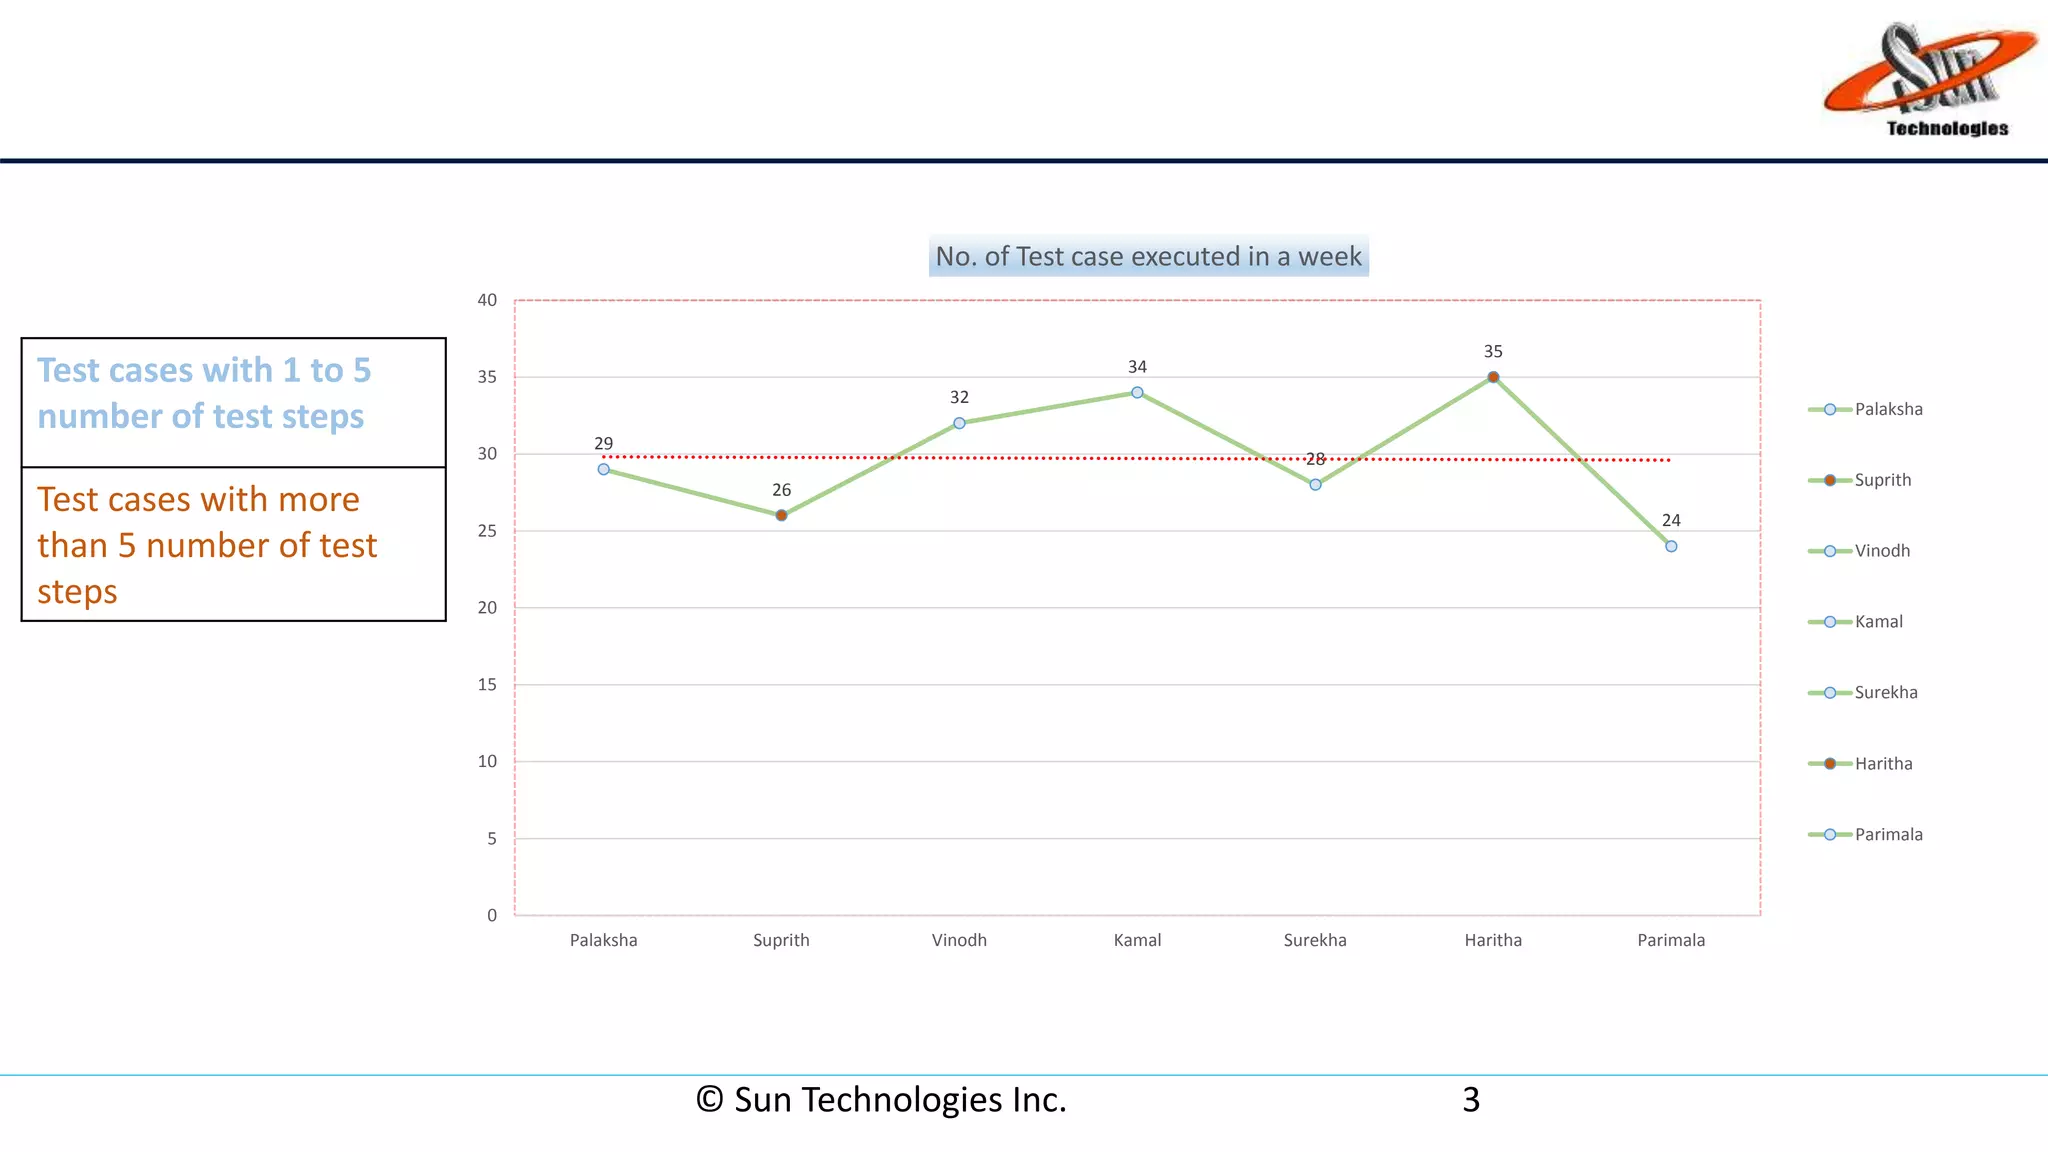
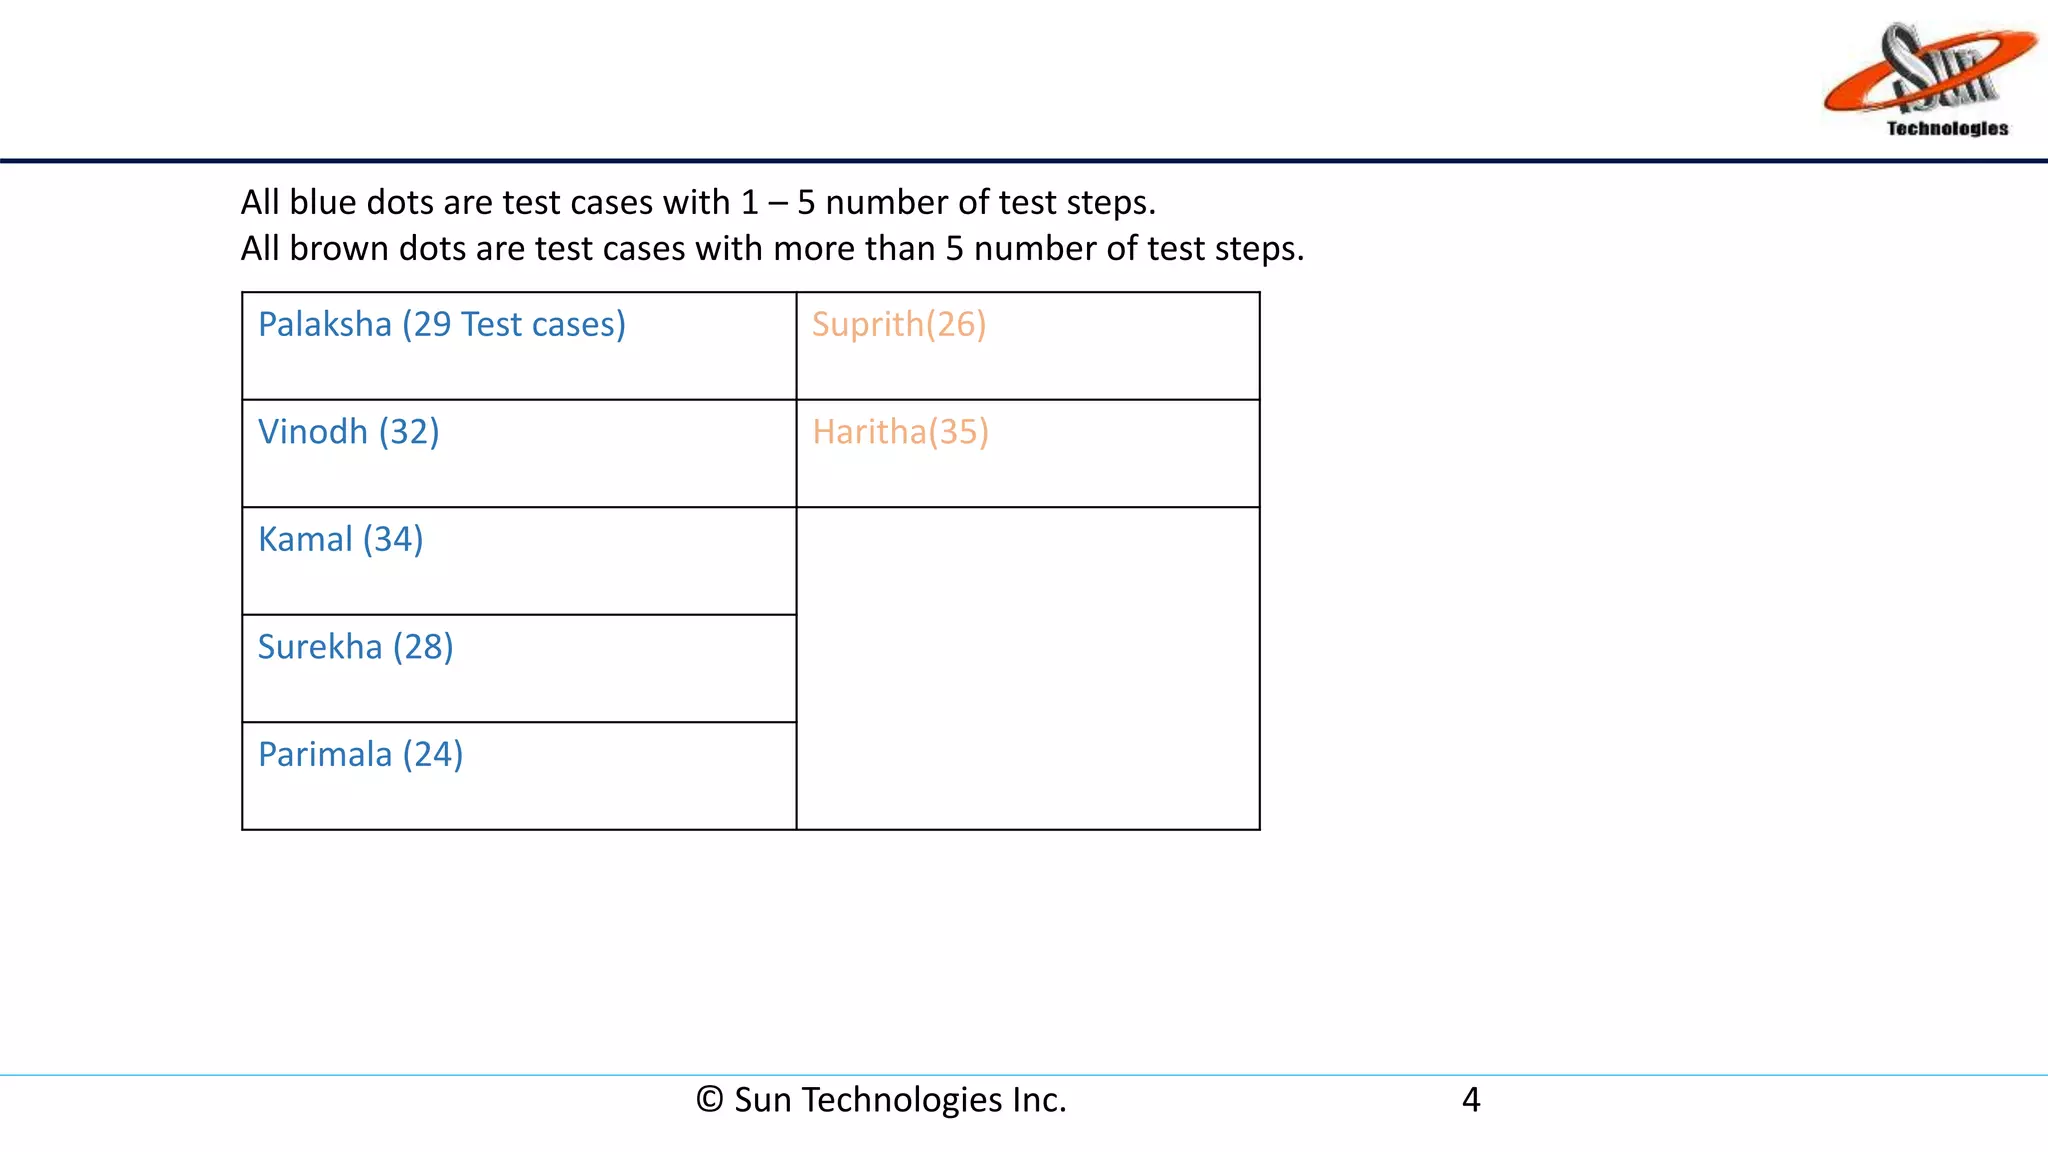
- The document includes an example run chart tracking the number of test cases executed by individual employees in a week, with dots distinguishing test case complexity.