Download to read offline
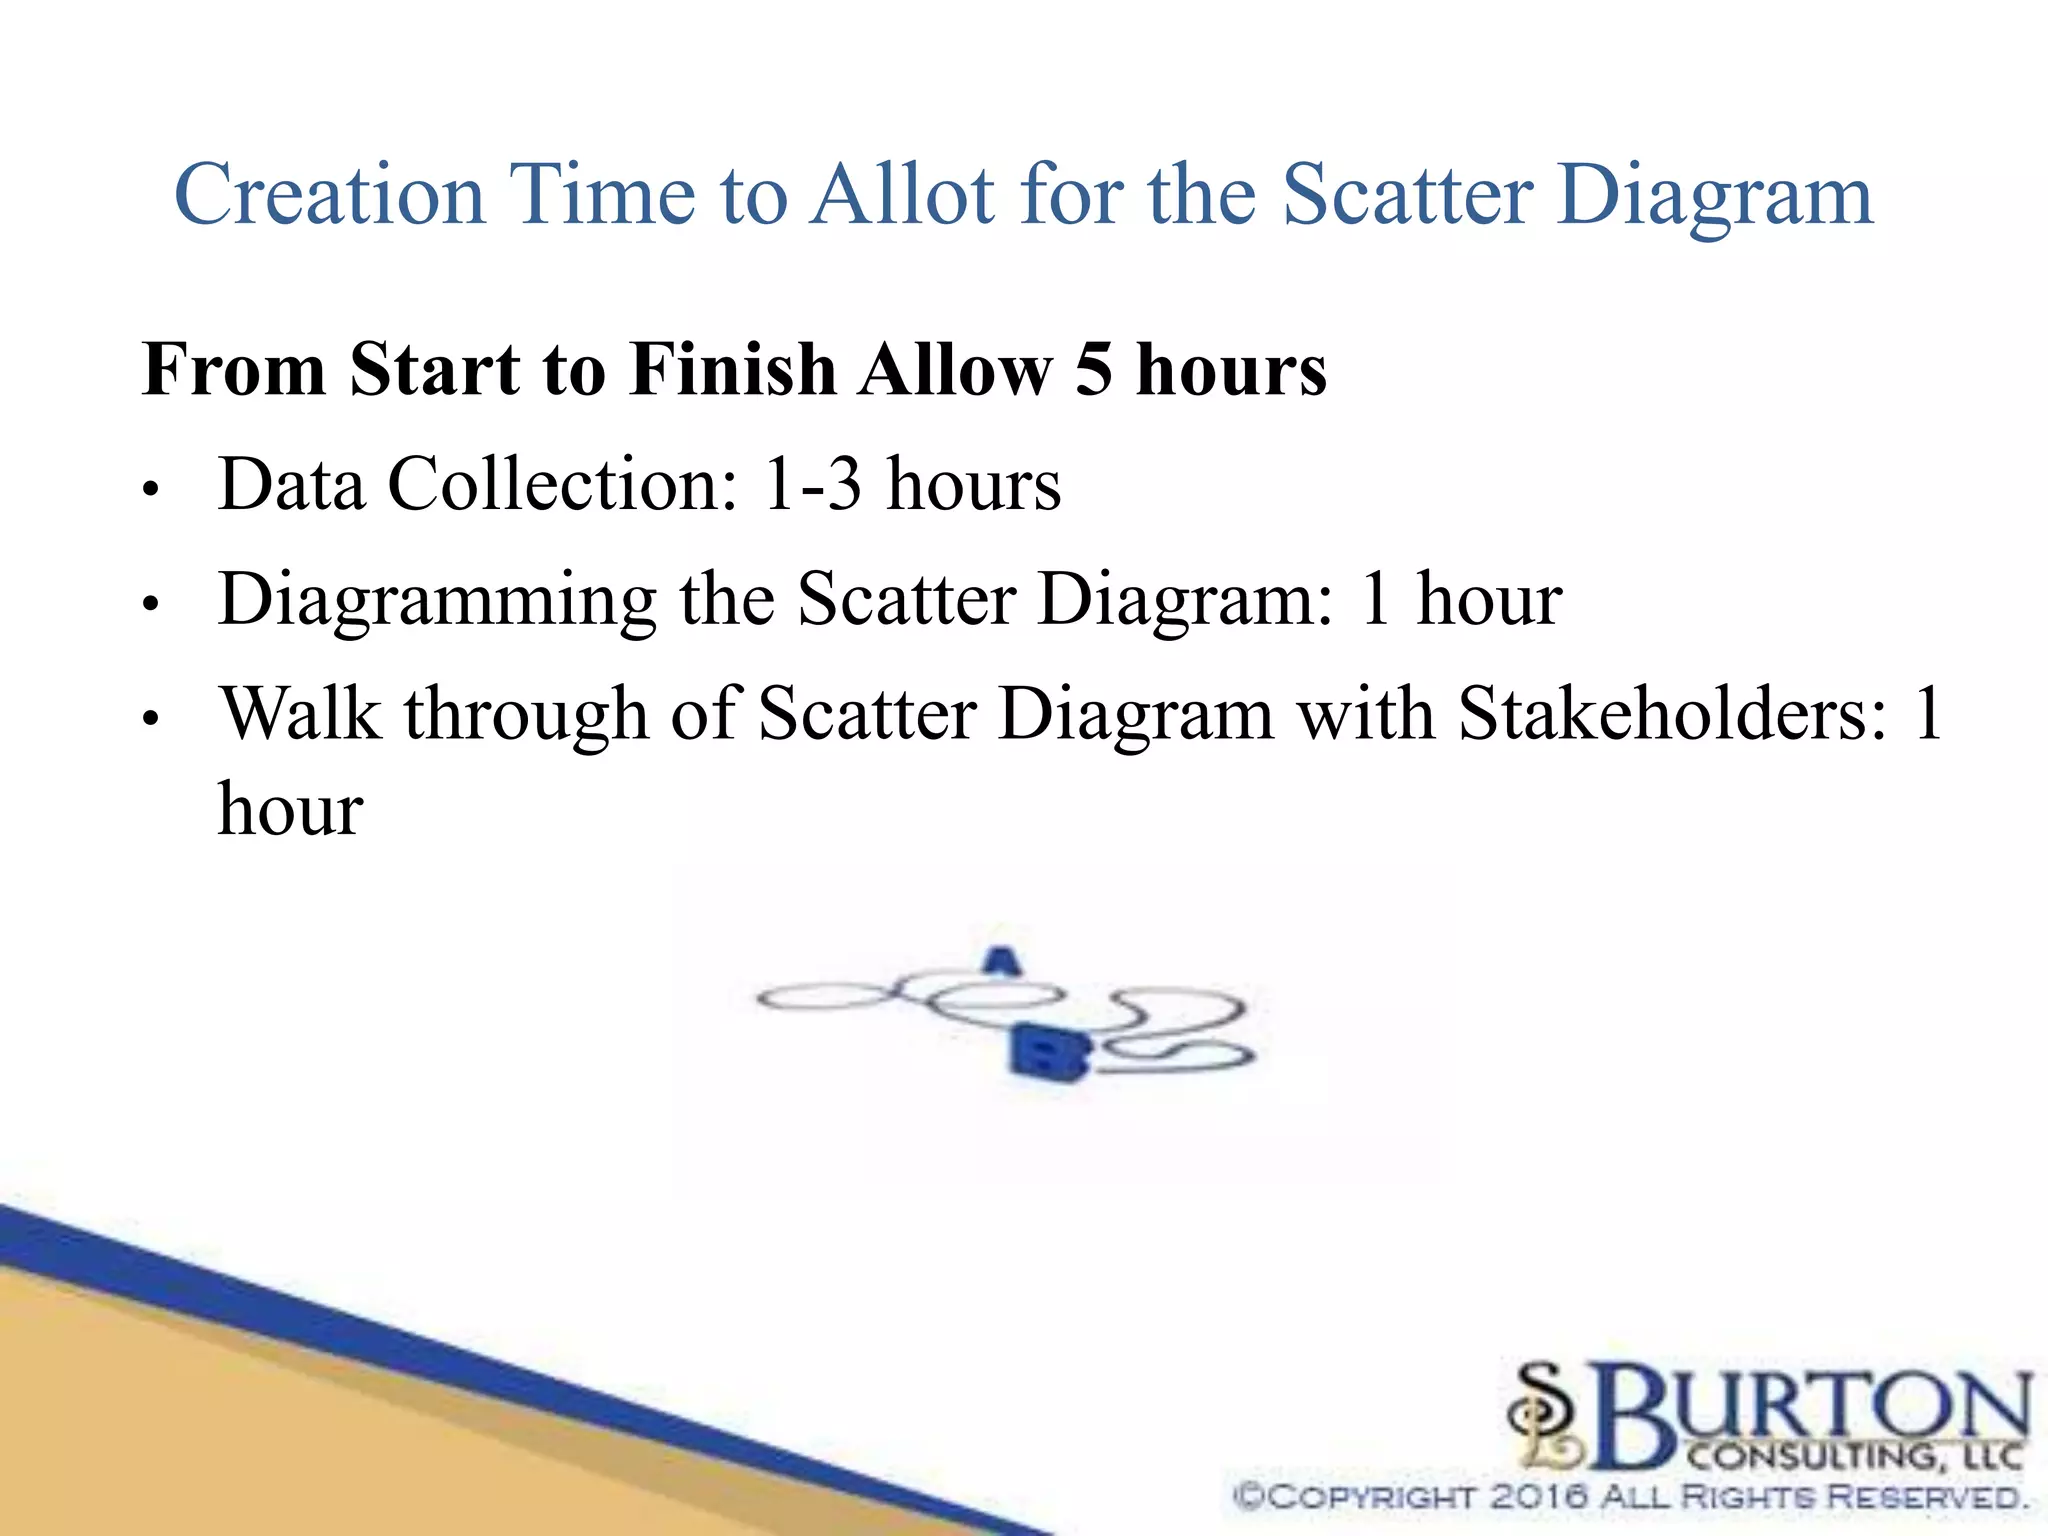
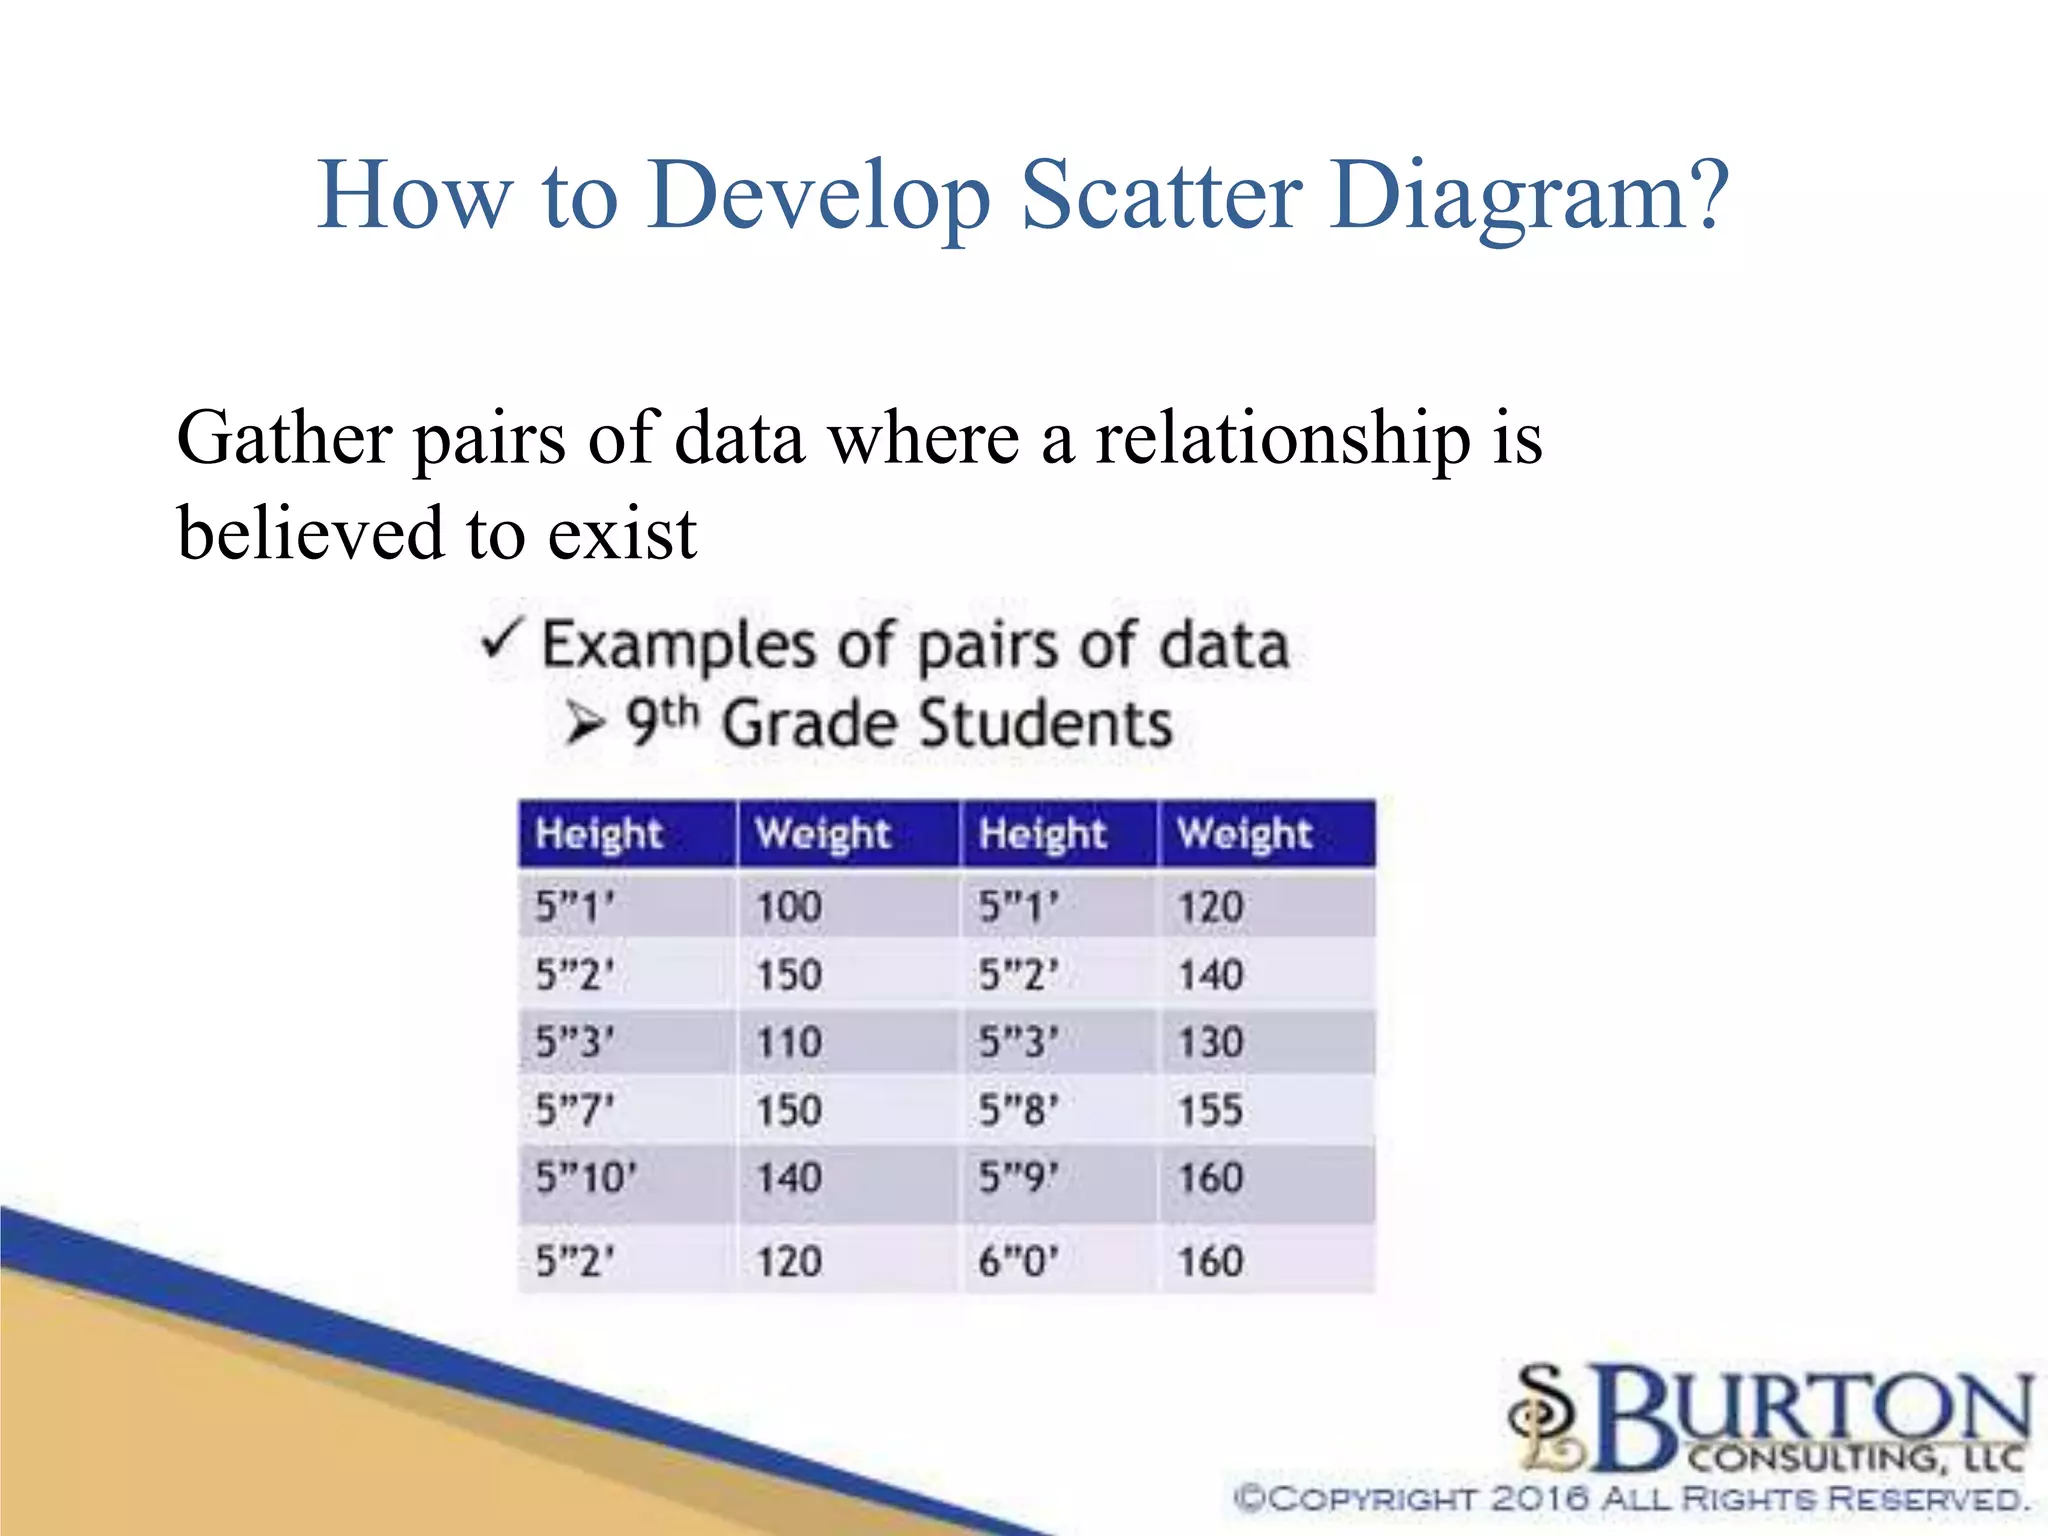
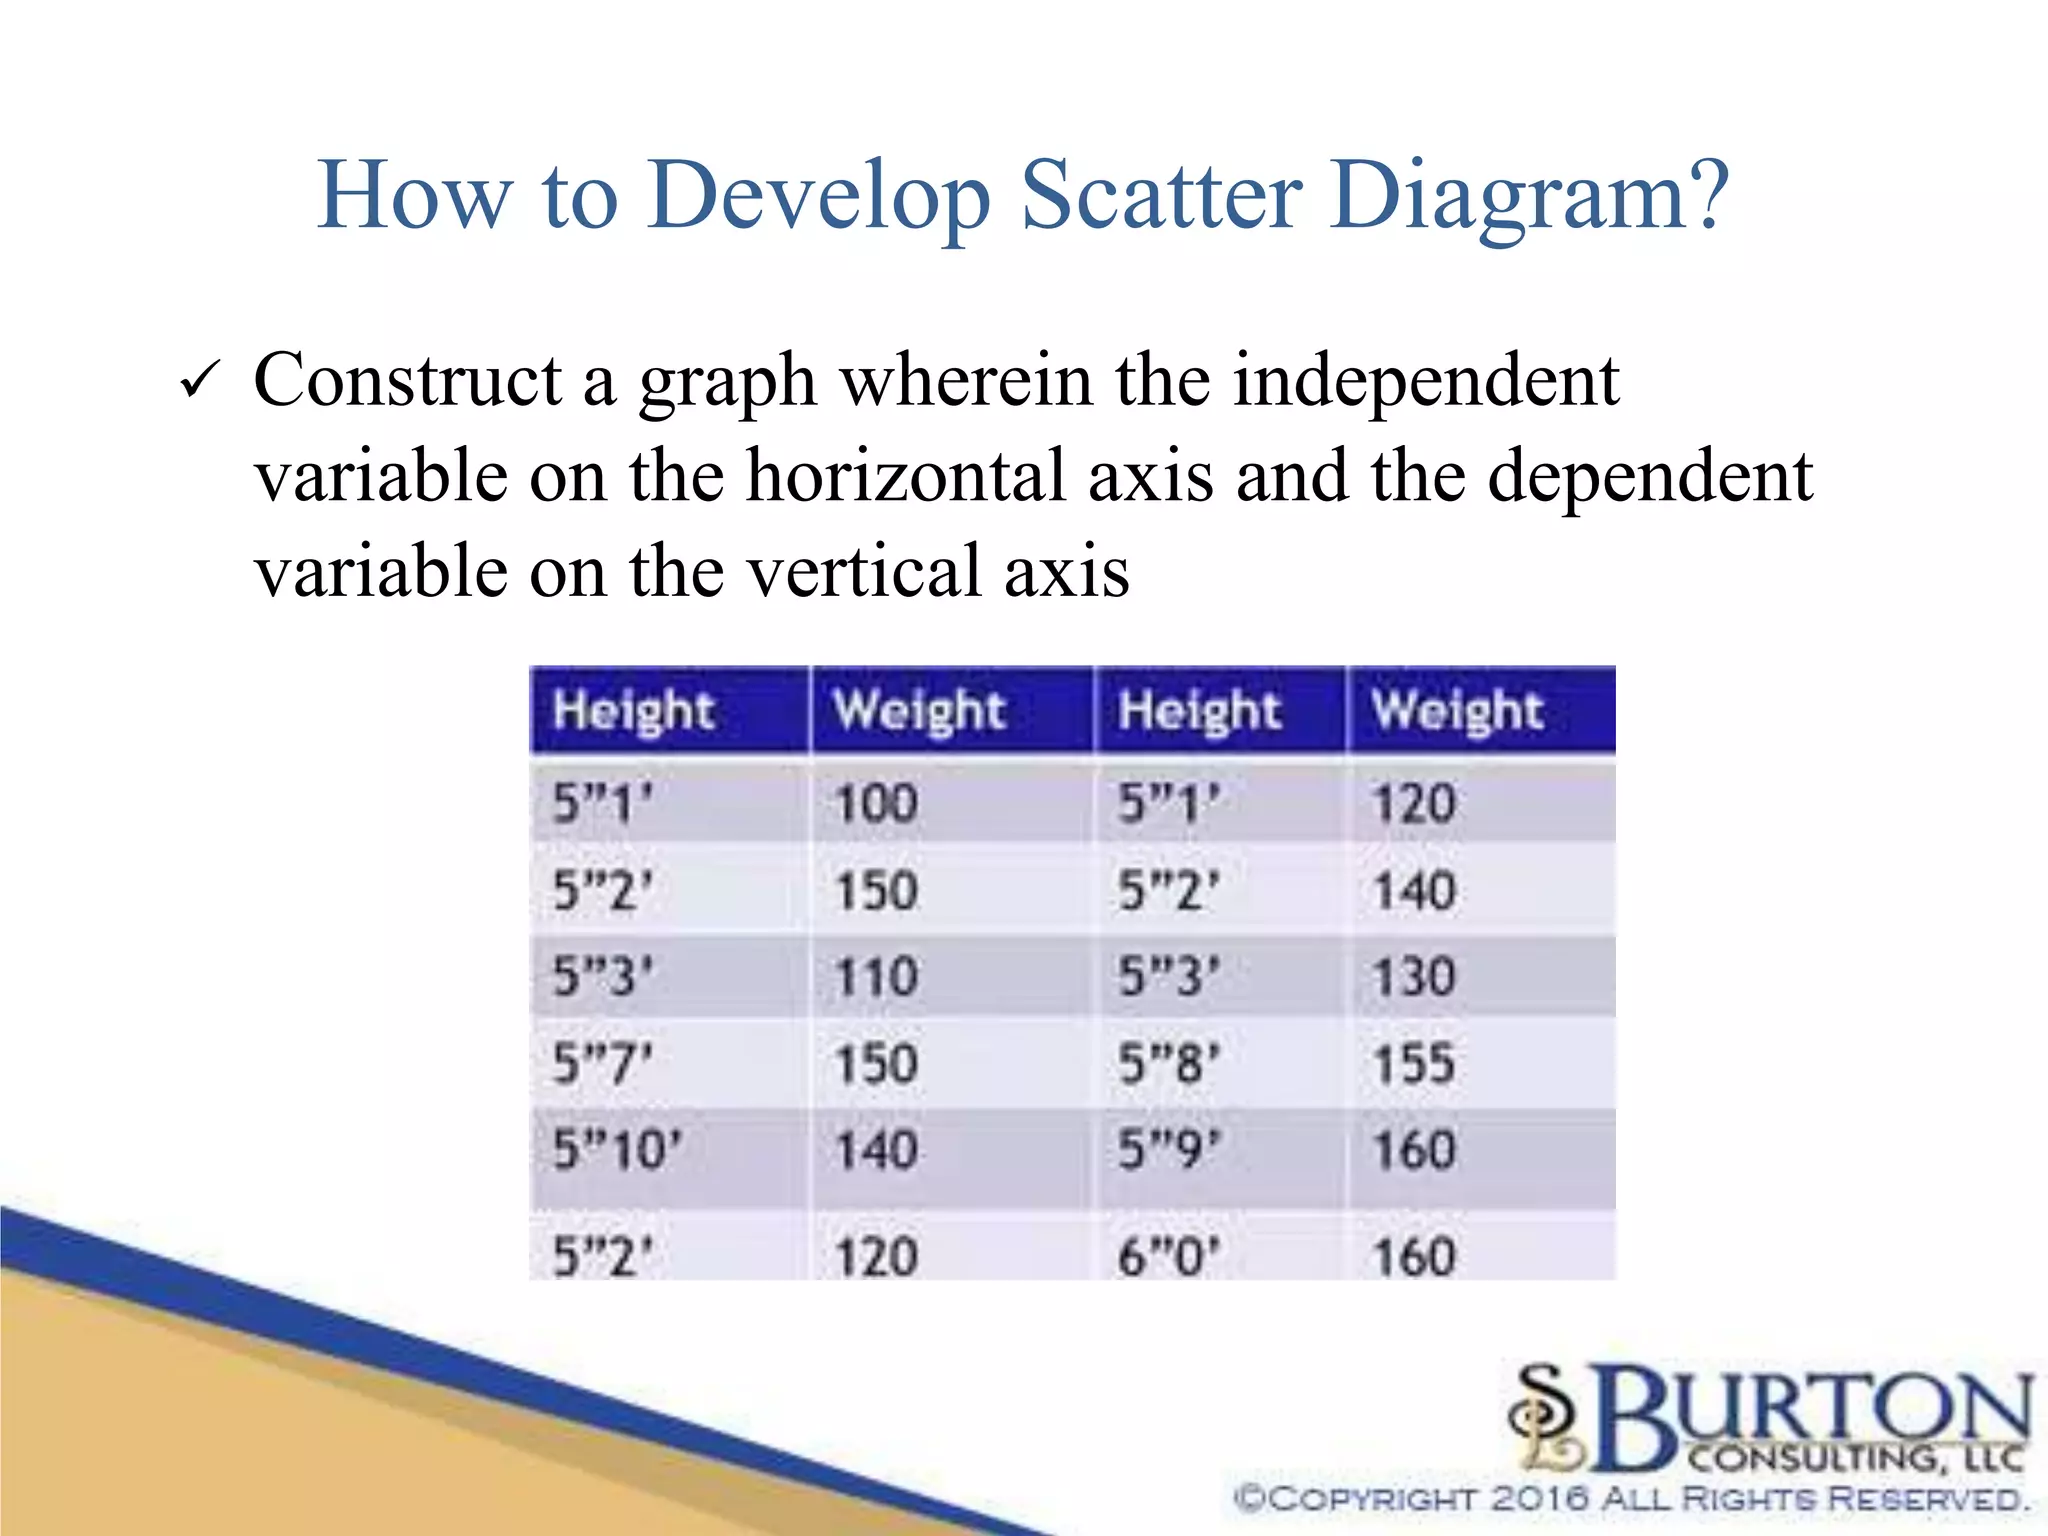
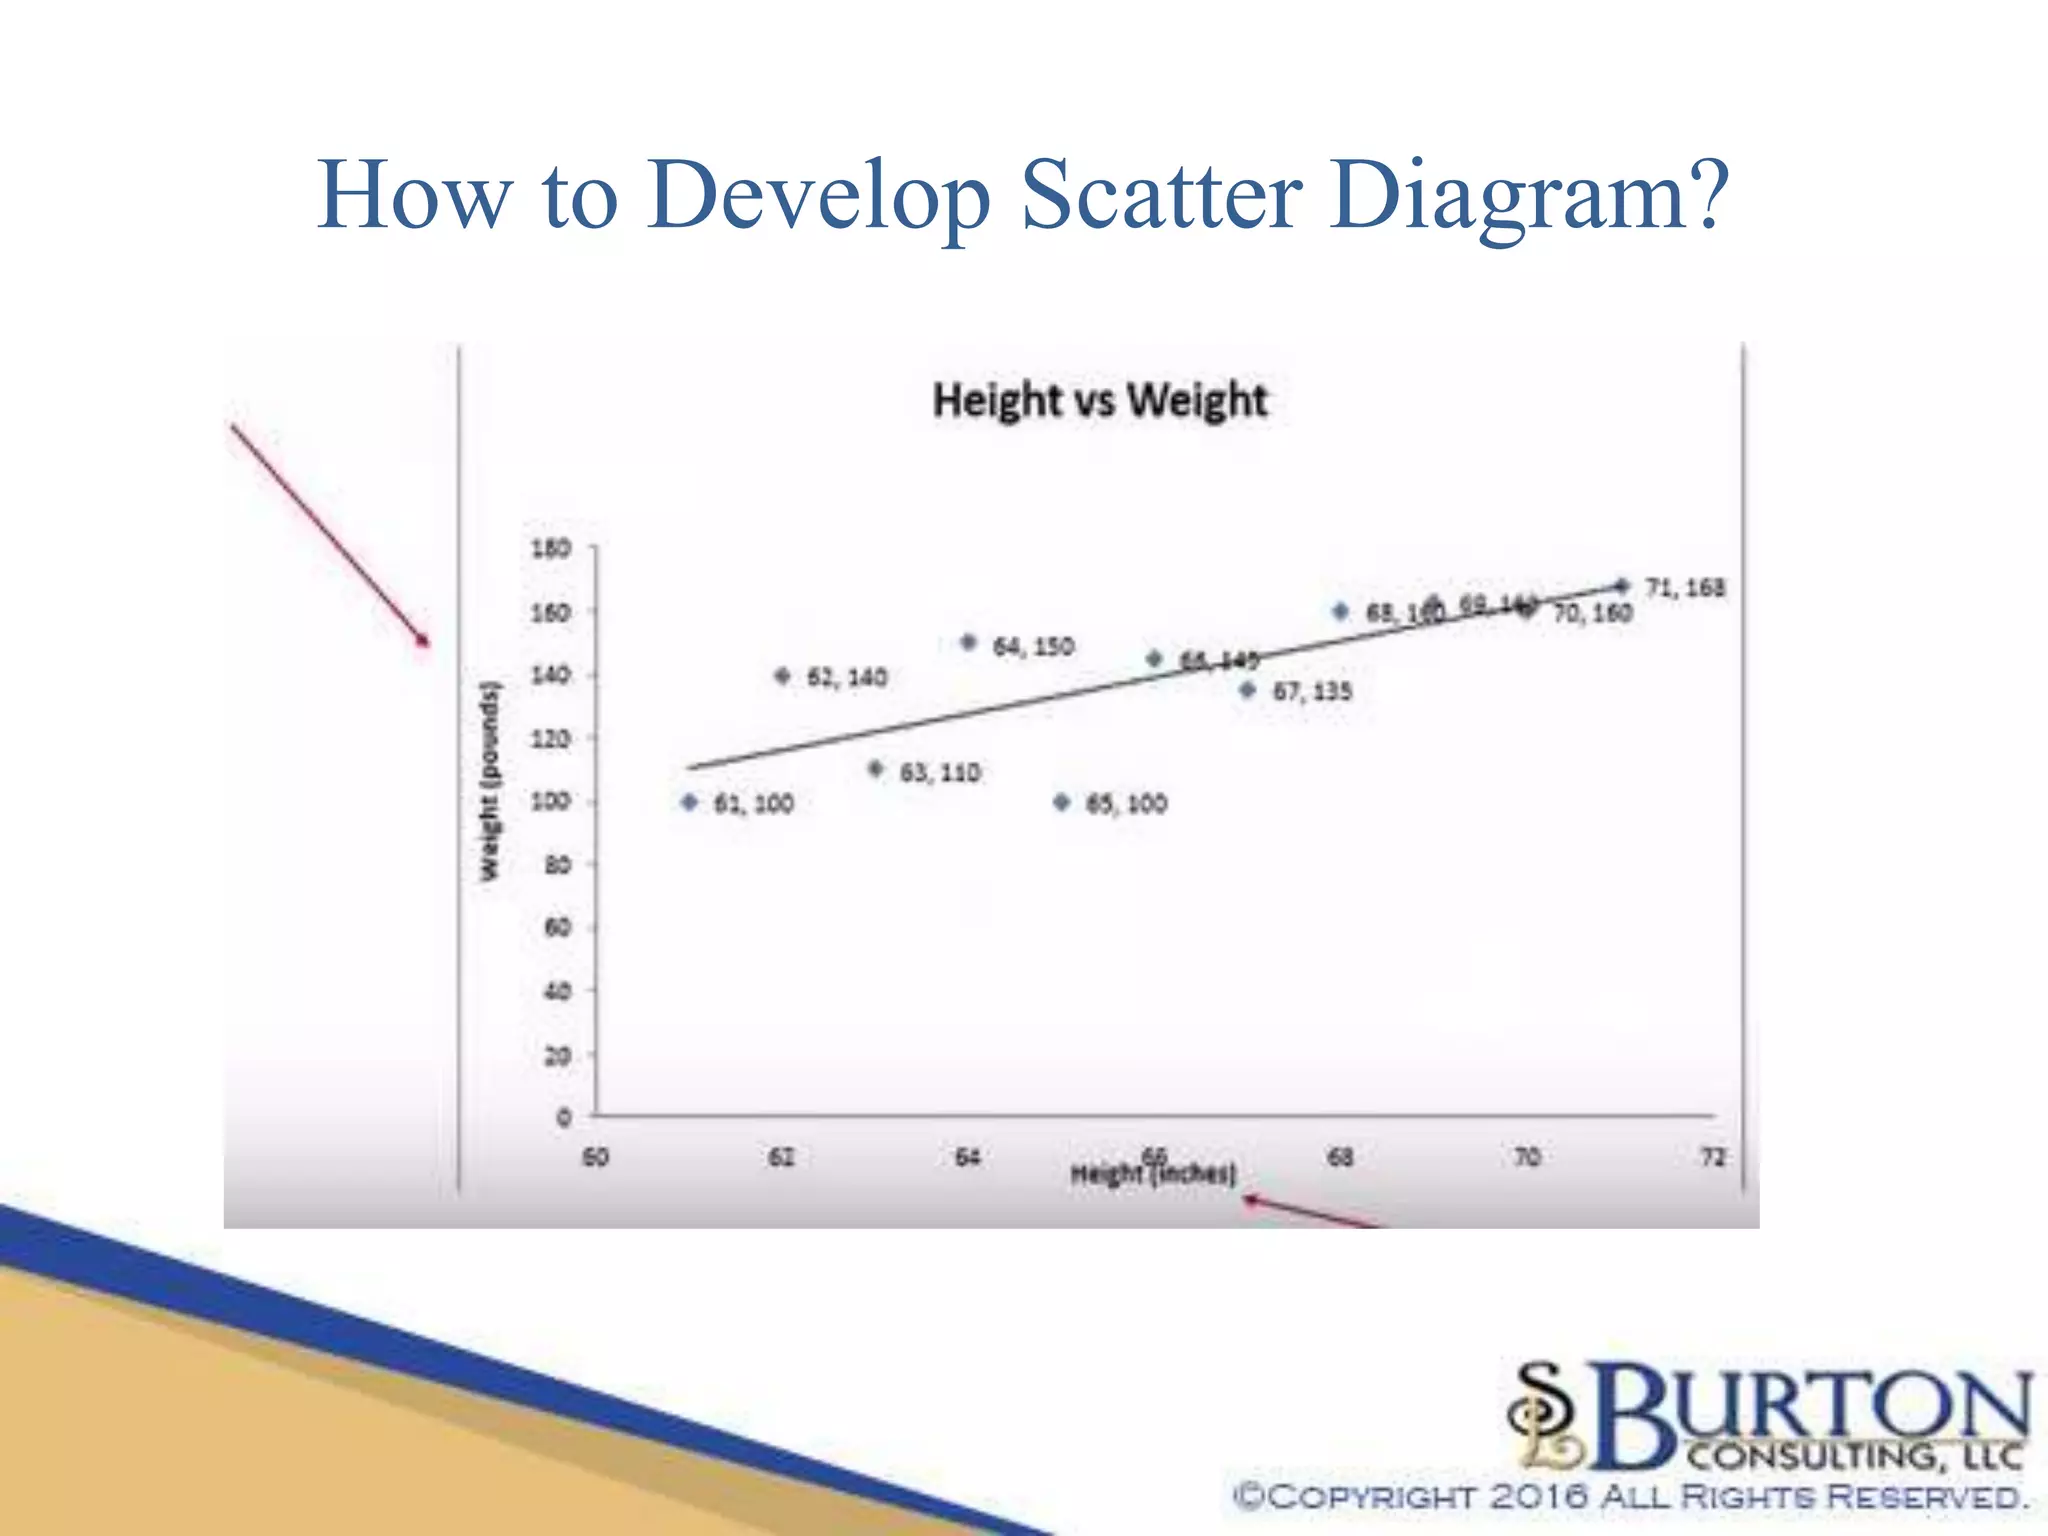

This document provides an overview of scatter diagrams as a quality and business process improvement tool, emphasizing their purpose in plotting relationships between multiple variables. It outlines the goals and learning objectives, as well as the steps involved in developing a scatter diagram, including data collection and stakeholder engagement. Additionally, it offers insights into the necessary time allocation for creating a scatter diagram.


