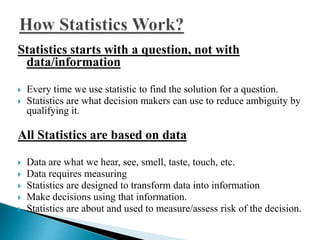
Prof. Rajkumar Teotia 
Institute of Advanced Management and Research (IAMR) 
Address: 9th Km Stone, NH-58, Delhi-Meerut Road, Duhai,Ghaziabad (U.P) 
- 201206 
Ph:0120-2675904/905 Mob:9999052997 Fax: 0120-2679145 
e mail: rajkumarteotia@iamrindia.com
 Collection of methods for planning experiments, obtaining 
data, and then organizing, summarizing, presenting, analyzing, 
interpreting, and drawing conclusions 
 Statistics refers to the body of techniques used for collecting, 
organizing, analyzing, and interpreting data. The data may be 
quantitative, with values expressed numerically, or they may be 
qualitative, with characteristics such as consumer preferences 
being tabulated. Statistics is used in business to help make 
better decisions by understanding the sources of variation and 
by uncovering patterns and relationships in business data.
 Statistics are the aggregates of facts 
 Statistics are affected by a number of factors 
 Statistics must be reasonably accurate 
 Statistics must be collected in a systematic manner 
 Collected in a systematic manner for a pre-determined purpose 
 Lastly, Statistics should be placed in relation to each other
 Statistics are the aggregates of facts:- 
It means a single figure is not statistics. For example, national income 
of a country for a single year is not statistics but the same for two or 
more years is statistics. 
 Statistics are affected by a number of factors:- 
For example, sale of a product depends on a number of factors such as 
its price, quality, competition, the income of the consumers, and so on. 
 Statistics must be reasonably accurate:- 
Wrong figures, if analyzed, will lead to erroneous conclusions. Hence, 
it is necessary that conclusions must be based on accurate figures. 
 Statistics must be collected in a systematic manner:- 
If data are collected in a haphazard manner, they will not be reliable and 
will lead to misleading conclusions.
 Collected in a systematic manner for a pre-determined 
purpose 
 Statistics should be placed in relation to each other:- 
If one collects data unrelated to each other, then such data 
will be confusing and will not lead to any logical conclusions. 
Data should be comparable over time and over space.
There are two main branches of statistics 
 Descriptive Statistics 
 Inferential Statistics
Descriptive statistics include the techniques that are used to 
summarize and describe numerical data for the 
Purpose of easier interpretation 
EXAMPLE-The 
monthly sales volume for a product during the past year can 
be described and made meaningful by 
Preparing a bar chart or a line graph. The relative sales by 
month can be highlighted by calculating an index number for 
each month such that the deviation from 100 for any given month 
indicates the percentage deviation of sales in that month as 
compared with average monthly sales during the entire year.
Inferential statistics include those techniques by which 
decisions about a statistical population or process are made 
based only on a sample having been observed. Because 
such decisions are made under conditions of uncertainty, the 
use of probability concepts is required 
EXAMPLE-In 
order to estimate the voltage required to cause an 
electrical device to fail, a sample of such devices can Be 
subjected to increasingly higher voltages until each device 
fails. Based on these sample results, the probability of 
failure at various voltage levels for the other devices in the 
sampled population can be estimated.
Statistics starts with a question, not with 
data/information 
 Every time we use statistic to find the solution for a question. 
 Statistics are what decision makers can use to reduce ambiguity by 
qualifying it. 
All Statistics are based on data 
 Data are what we hear, see, smell, taste, touch, etc. 
 Data requires measuring 
 Statistics are designed to transform data into information 
 Make decisions using that information. 
 Statistics are about and used to measure/assess risk of the decision.
 Business and Industry 
 Health and Medicine 
 Learning 
 Research 
 Social Statistics 
 Natural Resources
 Statistics to start a Business 
 Statistics to manufacturing 
 Statistics to marketing 
 Statistics to Engineering
Whether you are writing a business plan, feasibility 
study, advertising and marketing campaign, or even 
still deciding on what kind of business to start, start by 
looking at what is already happening in the field or 
industry you are interested in. 
Statistics are not magic formulas for success, but they 
can give you important clues about how others are or 
failing.
In this process we use statistic to understand the number 
of products we have to produce and what are the new 
strategies we have to apply in future. It also gives an 
overview of the market.
In marketing we use statistic in many ways banking the 
money you have in your business bank account can often 
provoke actions that are regretted at a later time. For 
example, if you have a healthy balance, you may decide to 
splash out on a purchase or investment that will in time, 
leave your account dangerously low: when money comes 
in, it is not unusual for all common sense to go out of the 
window…a bit extreme you may think!
Engineers apply physical and chemical laws and 
mathematics to design, develop, test, and supervise 
various products and services. Engineers perform tests 
to learn how things behave under stress, and at what 
point they might Fail. As engineers perform 
experiments, they collect data that can be used to 
explain relationships better and to reveal information 
about the quality of products and services they provide.
Medical statistics deals with applications of including 
epidemiology, public health find data on indicators of the 
nation's health, such smoking drinking and drug use, and 
abortion statistics. 
This is of particular importance when attempting to determine 
whether the pharmacological effect of one drug is superior to 
another which clearly has implications for drug development 
Therefore, it is essential for pharmacologists to have an 
understanding of the uses of the statistics.
The techniques of statistics can prove to be valuable tools for 
teachers of to interpret statistics is advantageous to analyze lab 
results, book and journal articles, and as an aid in approaching 
problem-solving scientifically. Statistics will allow you to 
critically evaluate your students, your teaching, and the results 
of educational research.
The word researches are depending in statistics, when we 
found any data from research we analyze and make decisions 
using statics. These are the examples for government 
researches. 
 Research and Development: DOE Could Enhance the 
Project Selection Process for Government Oil and Natural 
Gas Research. 
 Bureau of Government Research wants 'realistic' 
development strategy
Social statistics is the use of statistical measurement systems to 
study human behavior in a social environment. This can be 
accomplished through polling a particular group of people, 
evaluating a particular subset of data obtained about a group of 
people, or by observation and statistical analysis of a set of data 
that relates to people and their behaviors. 
Often, social scientists are employed in the evaluation of the 
quality of services of a particular group or organization, in 
analyzing behaviors of groups of people in their environment and 
special situations, or even in determining the wants or needs of 
people through statistical sampling.
 Child-bearing, Child and elderly populations 
 Housing and Human settlements 
 Education and Literacy 
 Income , economic activity and Unemployment
 Health, nutrition and educational level in country. 
 To identify the strength of working people. 
 To planning the future
 Identify problems in housing planning. 
 to settle the problems in slums.
 Study about the current education system in country. 
 Develop the subject planning 
 Future employment planning.
 To understand about savings and investment. 
 introduce future investing systems
Statistics are used in the scientific study of agriculture as 
a tool to determine if the differences in variables are real 
or due to chance. This translates to the farmer to let him 
know with confidence which varieties are better than 
other varieties or which fertilizer treatments will give 
better yields than others. In many countries in agriculture 
they use so many statistical researches to do their 
agriculture successfully. These are some of projects that 
some countries are managed.
 There are certain phenomena or concepts where statistics cannot be 
used. This is because these phenomena or concepts are not 
amenable to measurement. For example, beauty, intelligence, 
courage cannot be quantified. Statistics has no place in all such 
cases where quantification is not possible. 
 Statistics reveal the average behavior, the normal or the general 
trend. An application of the 'average' concept if applied to an 
individual or a particular situation may lead to a wrong conclusion 
and sometimes may be disastrous. 
For example, one may be misguided when told that the average 
depth of a river from one bank to the other is four feet, when there 
may be some points in between where its depth is far more than 
four feet. On this understanding, one may enter those points having 
greater depth, which may be hazardous.
 Since statistics are collected for a particular purpose, such data may 
not be relevant or useful in other situations or cases. For example, 
secondary data (i.e., data originally collected by someone else) may 
not be useful for the other Person. 
 Statistics are not 100 per cent precise as is Mathematics or 
Accountancy. Those who use statistics should be aware of this 
limitation. 
 In statistical surveys, sampling is generally used as it is not 
physically possible to cover all the units or elements comprising the 
universe 
 At times, association or relationship between two or more variables 
is studied in statistics, but such a relationship does not indicate cause 
and effect' relationship. It simply shows the similarity or 
dissimilarity in the movement of the two variables
In statistics, data are classified into two broad categories: 
 Quantitative data. 
 Qualitative data.
Quantitative data are those that can be quantified in definite 
units of measurement. These refer to characteristics whose 
successive measurements yield quantifiable observations. 
Depending on the nature of the variable observed for 
measurement. 
Quantitative data can be further categorized as 
 Continuous Data 
 Discrete Data.
Continuous data represent the numerical values of a 
continuous variable. A continuous variable is the one that can 
assume any value between any two points on a line segment, 
thus representing an interval of values. The values are quite 
precise and close to each other, yet distinguishably different. 
All characteristics such as weight, length, height, thickness, 
velocity, temperature, tensile strength, etc., represent 
continuous variables. Thus, the data recorded on these and 
similar other characteristics are called continuous data
Discrete data are the values assumed by a discrete variable. A 
discrete variable is the one whose outcomes are measured in 
fixed numbers. Such data are essentially count data. These are 
derived from a process of counting, such as the number of items 
possessing or not possessing a certain characteristic. The 
number of customers visiting a departmental store every day, 
the incoming flights at an airport, and the defective items in a 
consignment received for sale, are all examples of discrete data.
Qualitative data refer to qualitative characteristics of a subject 
or an object. A characteristic is qualitative in nature when its 
observations are defined and noted in terms of the presence or 
absence of a certain attribute in discrete numbers. 
These data are further classified as 
 Nominal Data 
 Rank data
Nominal data are the outcome of classification into two or 
more categories of items or units comprising a sample or a 
population according to some quality characteristic. 
Classification of students according to sex (as males and 
females), of workers according to skill (as skilled, semi-skilled, 
and unskilled), and of employees according to the 
level of education (as matriculates, undergraduates, and post-graduates), 
all result into nominal data. Given any such basis 
of classification, it is always possible to assign each item to a 
particular class and make a summation of items belonging to 
each class. The count data so obtained are called nominal 
data.
Rank data, on the other hand, are the result of assigning 
ranks to specify order in terms of the integers 1,2,3, ..., n. 
Ranks may be assigned according to the level of 
performance in a test. a contest, a competition, an 
interview, or a show. The candidates appearing in an 
interview, for example, may be assigned ranks in integers 
ranging from I to n, depending on their performance in 
the interview. Ranks so assigned can be viewed as the 
continuous values of a variable involving performance as 
the quality characteristic.
Data sources could be seen as of two types, viz., secondary 
and primary. The two can be defined as under: 
(i) Secondary data: They already exist in some form: 
published or unpublished - in an identifiable secondary 
source. They are, generally, available from published 
source(s), though not necessarily in the form actually 
required. 
(ii) Primary data: Those data which do not already exist in 
any form, and thus have to be collected for the first time 
from the primary source(s). By their very nature, these data 
require fresh and first-time collection covering the whole 
population or a sample drawn from it.
FREQUENCY DISTRIBUTIONS:- 
A frequency distribution is a table in which possible values for 
a variable are grouped into classes, and the number of 
observed values which fall into each class is recorded. Data 
organized in a frequency distribution are called grouped data. 
In contrast, for ungrouped data every observed value of the 
random variable is listed. 
EXAMPLE 1. A frequency distribution of weekly wages is 
shown in Table 2.1. Note that the amounts are reported to the 
nearest dollar. When a remainder that is to be rounded is 
“exactly 0.5” (exactly $0.50 in this case), the convention is to 
round to the nearest even number. Thus a weekly wage of 
$259.50 would have been rounded to $260 as part of the data-grouping 
process.
CLASS INTERVALS:- 
The class interval identifies the range of values included 
within a class and can be determined by subtracting the 
lower exact class limit from the upper exact class limit for 
the class. When exact limits are not identified, the class 
interval can be determined by subtracting the lower stated 
limit for a class from the lower stated limit of the adjoining 
next-higher class. Finally, for certain purposes the values in a 
class often are represented by the class midpoint, which can 
be determined by adding one-half of the class intervals to the 
lower exact limit of the class.
EXAMPLE:- Table 2.2 presents the exact class limits and the 
class midpoints for the frequency distribution in Table 2.1.
A histogram is a bar graph of a frequency distribution. As indicated in 
Fig. 2-1, typically the exact class limits are entered along the horizontal 
axis of the graph while the numbers of observations are listed along the 
vertical axis. However, class midpoints instead of class limits also are 
used to identify the classes.
A frequency polygon is a line graph of a frequency distribution. As indicated in 
Fig. 2-2, the two axes of this graph are similar to those of the histogram except 
that the midpoint of each class typically is identified along the horizontal axis. 
The number of observations in each class is represented by a dot above the 
midpoint of the class, and these dots are joined by a series of line segments to 
form a polygon, or “many-sided figure.” 
EXAMPLE- frequency polygon for the distribution of weekly wages in Table 2.2 
is shown in Fig. 2-2.
A cumulative frequency distribution identifies the cumulative 
number of observations included below the upper exact limit of 
each class in the distribution. The cumulative frequency for a 
class can be determined by adding the observed frequency for 
that class to the cumulative frequency for the preceding class
The graph of a cumulative frequency distribution is called an 
Ogive. For the less-than type of cumulative distribution, this 
graph indicates the cumulative frequency below each exact 
class limit of the frequency distribution. When such a line 
graph is smoothed, it is called an Ogive curve.
A pie chart is a pie-shaped figure in which the pieces of the pie 
represent divisions of a total amount, such as the distribution of a 
company’s sales dollar. A percentage pie chart is one in which the values 
have been converted into percentages in order to make them easier to 
compare 
EXAMPLE:- Figure 2-12 is a pie chart depicting the revenues and the 
percentage of total revenues for the Xerox Corporation during a recent 
year according to the categories of core business (called “Heartland” by 
Xerox), growth markets; developing countries, and niche opportunities
What is statistics

What is statistics

  • 1.
    Prof. Rajkumar Teotia Institute of Advanced Management and Research (IAMR) Address: 9th Km Stone, NH-58, Delhi-Meerut Road, Duhai,Ghaziabad (U.P) - 201206 Ph:0120-2675904/905 Mob:9999052997 Fax: 0120-2679145 e mail: rajkumarteotia@iamrindia.com
  • 3.
     Collection ofmethods for planning experiments, obtaining data, and then organizing, summarizing, presenting, analyzing, interpreting, and drawing conclusions  Statistics refers to the body of techniques used for collecting, organizing, analyzing, and interpreting data. The data may be quantitative, with values expressed numerically, or they may be qualitative, with characteristics such as consumer preferences being tabulated. Statistics is used in business to help make better decisions by understanding the sources of variation and by uncovering patterns and relationships in business data.
  • 4.
     Statistics arethe aggregates of facts  Statistics are affected by a number of factors  Statistics must be reasonably accurate  Statistics must be collected in a systematic manner  Collected in a systematic manner for a pre-determined purpose  Lastly, Statistics should be placed in relation to each other
  • 5.
     Statistics arethe aggregates of facts:- It means a single figure is not statistics. For example, national income of a country for a single year is not statistics but the same for two or more years is statistics.  Statistics are affected by a number of factors:- For example, sale of a product depends on a number of factors such as its price, quality, competition, the income of the consumers, and so on.  Statistics must be reasonably accurate:- Wrong figures, if analyzed, will lead to erroneous conclusions. Hence, it is necessary that conclusions must be based on accurate figures.  Statistics must be collected in a systematic manner:- If data are collected in a haphazard manner, they will not be reliable and will lead to misleading conclusions.
  • 6.
     Collected ina systematic manner for a pre-determined purpose  Statistics should be placed in relation to each other:- If one collects data unrelated to each other, then such data will be confusing and will not lead to any logical conclusions. Data should be comparable over time and over space.
  • 7.
    There are twomain branches of statistics  Descriptive Statistics  Inferential Statistics
  • 8.
    Descriptive statistics includethe techniques that are used to summarize and describe numerical data for the Purpose of easier interpretation EXAMPLE-The monthly sales volume for a product during the past year can be described and made meaningful by Preparing a bar chart or a line graph. The relative sales by month can be highlighted by calculating an index number for each month such that the deviation from 100 for any given month indicates the percentage deviation of sales in that month as compared with average monthly sales during the entire year.
  • 9.
    Inferential statistics includethose techniques by which decisions about a statistical population or process are made based only on a sample having been observed. Because such decisions are made under conditions of uncertainty, the use of probability concepts is required EXAMPLE-In order to estimate the voltage required to cause an electrical device to fail, a sample of such devices can Be subjected to increasingly higher voltages until each device fails. Based on these sample results, the probability of failure at various voltage levels for the other devices in the sampled population can be estimated.
  • 10.
    Statistics starts witha question, not with data/information  Every time we use statistic to find the solution for a question.  Statistics are what decision makers can use to reduce ambiguity by qualifying it. All Statistics are based on data  Data are what we hear, see, smell, taste, touch, etc.  Data requires measuring  Statistics are designed to transform data into information  Make decisions using that information.  Statistics are about and used to measure/assess risk of the decision.
  • 11.
     Business andIndustry  Health and Medicine  Learning  Research  Social Statistics  Natural Resources
  • 12.
     Statistics tostart a Business  Statistics to manufacturing  Statistics to marketing  Statistics to Engineering
  • 13.
    Whether you arewriting a business plan, feasibility study, advertising and marketing campaign, or even still deciding on what kind of business to start, start by looking at what is already happening in the field or industry you are interested in. Statistics are not magic formulas for success, but they can give you important clues about how others are or failing.
  • 14.
    In this processwe use statistic to understand the number of products we have to produce and what are the new strategies we have to apply in future. It also gives an overview of the market.
  • 15.
    In marketing weuse statistic in many ways banking the money you have in your business bank account can often provoke actions that are regretted at a later time. For example, if you have a healthy balance, you may decide to splash out on a purchase or investment that will in time, leave your account dangerously low: when money comes in, it is not unusual for all common sense to go out of the window…a bit extreme you may think!
  • 16.
    Engineers apply physicaland chemical laws and mathematics to design, develop, test, and supervise various products and services. Engineers perform tests to learn how things behave under stress, and at what point they might Fail. As engineers perform experiments, they collect data that can be used to explain relationships better and to reveal information about the quality of products and services they provide.
  • 17.
    Medical statistics dealswith applications of including epidemiology, public health find data on indicators of the nation's health, such smoking drinking and drug use, and abortion statistics. This is of particular importance when attempting to determine whether the pharmacological effect of one drug is superior to another which clearly has implications for drug development Therefore, it is essential for pharmacologists to have an understanding of the uses of the statistics.
  • 18.
    The techniques ofstatistics can prove to be valuable tools for teachers of to interpret statistics is advantageous to analyze lab results, book and journal articles, and as an aid in approaching problem-solving scientifically. Statistics will allow you to critically evaluate your students, your teaching, and the results of educational research.
  • 19.
    The word researchesare depending in statistics, when we found any data from research we analyze and make decisions using statics. These are the examples for government researches.  Research and Development: DOE Could Enhance the Project Selection Process for Government Oil and Natural Gas Research.  Bureau of Government Research wants 'realistic' development strategy
  • 20.
    Social statistics isthe use of statistical measurement systems to study human behavior in a social environment. This can be accomplished through polling a particular group of people, evaluating a particular subset of data obtained about a group of people, or by observation and statistical analysis of a set of data that relates to people and their behaviors. Often, social scientists are employed in the evaluation of the quality of services of a particular group or organization, in analyzing behaviors of groups of people in their environment and special situations, or even in determining the wants or needs of people through statistical sampling.
  • 21.
     Child-bearing, Childand elderly populations  Housing and Human settlements  Education and Literacy  Income , economic activity and Unemployment
  • 22.
     Health, nutritionand educational level in country.  To identify the strength of working people.  To planning the future
  • 23.
     Identify problemsin housing planning.  to settle the problems in slums.
  • 24.
     Study aboutthe current education system in country.  Develop the subject planning  Future employment planning.
  • 25.
     To understandabout savings and investment.  introduce future investing systems
  • 26.
    Statistics are usedin the scientific study of agriculture as a tool to determine if the differences in variables are real or due to chance. This translates to the farmer to let him know with confidence which varieties are better than other varieties or which fertilizer treatments will give better yields than others. In many countries in agriculture they use so many statistical researches to do their agriculture successfully. These are some of projects that some countries are managed.
  • 27.
     There arecertain phenomena or concepts where statistics cannot be used. This is because these phenomena or concepts are not amenable to measurement. For example, beauty, intelligence, courage cannot be quantified. Statistics has no place in all such cases where quantification is not possible.  Statistics reveal the average behavior, the normal or the general trend. An application of the 'average' concept if applied to an individual or a particular situation may lead to a wrong conclusion and sometimes may be disastrous. For example, one may be misguided when told that the average depth of a river from one bank to the other is four feet, when there may be some points in between where its depth is far more than four feet. On this understanding, one may enter those points having greater depth, which may be hazardous.
  • 28.
     Since statisticsare collected for a particular purpose, such data may not be relevant or useful in other situations or cases. For example, secondary data (i.e., data originally collected by someone else) may not be useful for the other Person.  Statistics are not 100 per cent precise as is Mathematics or Accountancy. Those who use statistics should be aware of this limitation.  In statistical surveys, sampling is generally used as it is not physically possible to cover all the units or elements comprising the universe  At times, association or relationship between two or more variables is studied in statistics, but such a relationship does not indicate cause and effect' relationship. It simply shows the similarity or dissimilarity in the movement of the two variables
  • 29.
    In statistics, dataare classified into two broad categories:  Quantitative data.  Qualitative data.
  • 30.
    Quantitative data arethose that can be quantified in definite units of measurement. These refer to characteristics whose successive measurements yield quantifiable observations. Depending on the nature of the variable observed for measurement. Quantitative data can be further categorized as  Continuous Data  Discrete Data.
  • 31.
    Continuous data representthe numerical values of a continuous variable. A continuous variable is the one that can assume any value between any two points on a line segment, thus representing an interval of values. The values are quite precise and close to each other, yet distinguishably different. All characteristics such as weight, length, height, thickness, velocity, temperature, tensile strength, etc., represent continuous variables. Thus, the data recorded on these and similar other characteristics are called continuous data
  • 32.
    Discrete data arethe values assumed by a discrete variable. A discrete variable is the one whose outcomes are measured in fixed numbers. Such data are essentially count data. These are derived from a process of counting, such as the number of items possessing or not possessing a certain characteristic. The number of customers visiting a departmental store every day, the incoming flights at an airport, and the defective items in a consignment received for sale, are all examples of discrete data.
  • 33.
    Qualitative data referto qualitative characteristics of a subject or an object. A characteristic is qualitative in nature when its observations are defined and noted in terms of the presence or absence of a certain attribute in discrete numbers. These data are further classified as  Nominal Data  Rank data
  • 34.
    Nominal data arethe outcome of classification into two or more categories of items or units comprising a sample or a population according to some quality characteristic. Classification of students according to sex (as males and females), of workers according to skill (as skilled, semi-skilled, and unskilled), and of employees according to the level of education (as matriculates, undergraduates, and post-graduates), all result into nominal data. Given any such basis of classification, it is always possible to assign each item to a particular class and make a summation of items belonging to each class. The count data so obtained are called nominal data.
  • 35.
    Rank data, onthe other hand, are the result of assigning ranks to specify order in terms of the integers 1,2,3, ..., n. Ranks may be assigned according to the level of performance in a test. a contest, a competition, an interview, or a show. The candidates appearing in an interview, for example, may be assigned ranks in integers ranging from I to n, depending on their performance in the interview. Ranks so assigned can be viewed as the continuous values of a variable involving performance as the quality characteristic.
  • 36.
    Data sources couldbe seen as of two types, viz., secondary and primary. The two can be defined as under: (i) Secondary data: They already exist in some form: published or unpublished - in an identifiable secondary source. They are, generally, available from published source(s), though not necessarily in the form actually required. (ii) Primary data: Those data which do not already exist in any form, and thus have to be collected for the first time from the primary source(s). By their very nature, these data require fresh and first-time collection covering the whole population or a sample drawn from it.
  • 37.
    FREQUENCY DISTRIBUTIONS:- Afrequency distribution is a table in which possible values for a variable are grouped into classes, and the number of observed values which fall into each class is recorded. Data organized in a frequency distribution are called grouped data. In contrast, for ungrouped data every observed value of the random variable is listed. EXAMPLE 1. A frequency distribution of weekly wages is shown in Table 2.1. Note that the amounts are reported to the nearest dollar. When a remainder that is to be rounded is “exactly 0.5” (exactly $0.50 in this case), the convention is to round to the nearest even number. Thus a weekly wage of $259.50 would have been rounded to $260 as part of the data-grouping process.
  • 39.
    CLASS INTERVALS:- Theclass interval identifies the range of values included within a class and can be determined by subtracting the lower exact class limit from the upper exact class limit for the class. When exact limits are not identified, the class interval can be determined by subtracting the lower stated limit for a class from the lower stated limit of the adjoining next-higher class. Finally, for certain purposes the values in a class often are represented by the class midpoint, which can be determined by adding one-half of the class intervals to the lower exact limit of the class.
  • 40.
    EXAMPLE:- Table 2.2presents the exact class limits and the class midpoints for the frequency distribution in Table 2.1.
  • 41.
    A histogram isa bar graph of a frequency distribution. As indicated in Fig. 2-1, typically the exact class limits are entered along the horizontal axis of the graph while the numbers of observations are listed along the vertical axis. However, class midpoints instead of class limits also are used to identify the classes.
  • 42.
    A frequency polygonis a line graph of a frequency distribution. As indicated in Fig. 2-2, the two axes of this graph are similar to those of the histogram except that the midpoint of each class typically is identified along the horizontal axis. The number of observations in each class is represented by a dot above the midpoint of the class, and these dots are joined by a series of line segments to form a polygon, or “many-sided figure.” EXAMPLE- frequency polygon for the distribution of weekly wages in Table 2.2 is shown in Fig. 2-2.
  • 43.
    A cumulative frequencydistribution identifies the cumulative number of observations included below the upper exact limit of each class in the distribution. The cumulative frequency for a class can be determined by adding the observed frequency for that class to the cumulative frequency for the preceding class
  • 44.
    The graph ofa cumulative frequency distribution is called an Ogive. For the less-than type of cumulative distribution, this graph indicates the cumulative frequency below each exact class limit of the frequency distribution. When such a line graph is smoothed, it is called an Ogive curve.
  • 45.
    A pie chartis a pie-shaped figure in which the pieces of the pie represent divisions of a total amount, such as the distribution of a company’s sales dollar. A percentage pie chart is one in which the values have been converted into percentages in order to make them easier to compare EXAMPLE:- Figure 2-12 is a pie chart depicting the revenues and the percentage of total revenues for the Xerox Corporation during a recent year according to the categories of core business (called “Heartland” by Xerox), growth markets; developing countries, and niche opportunities