Downloaded 420 times
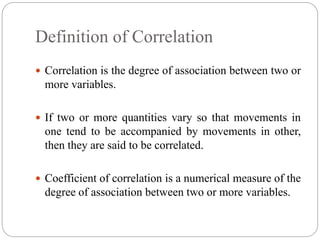
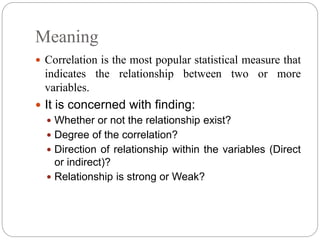
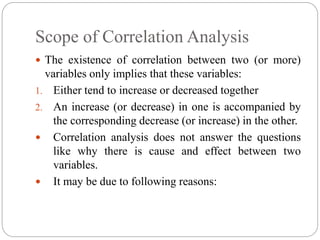

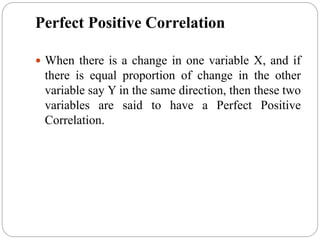
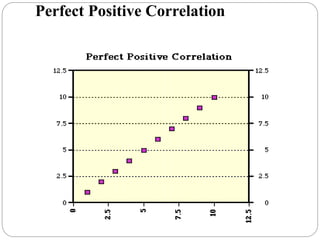
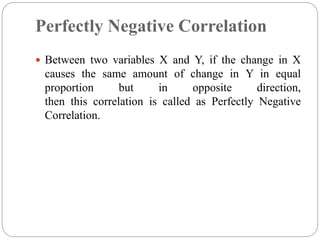
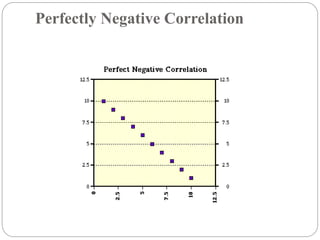
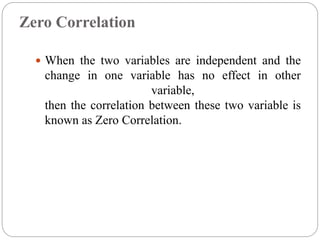
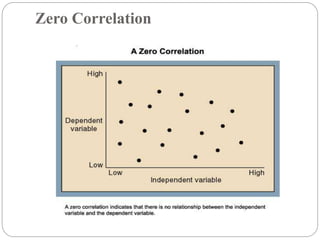
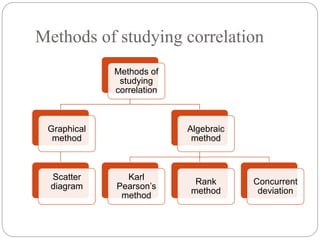
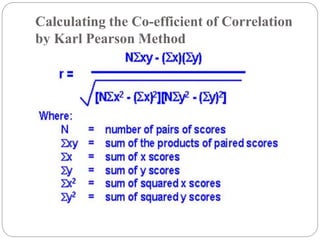
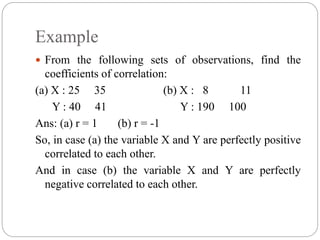
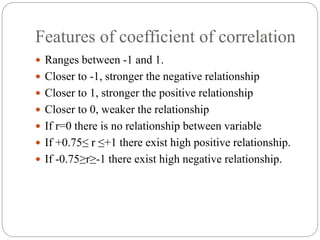

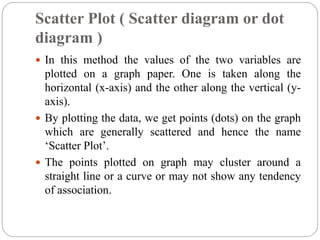
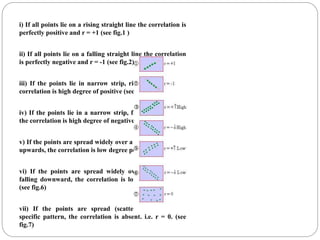

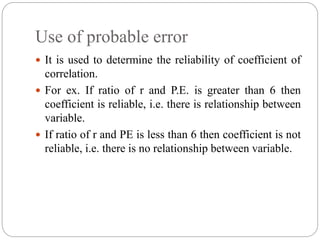
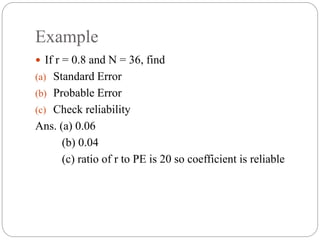

Correlation analysis measures the strength and direction of association between two or more variables. It is represented by the coefficient of correlation (r), which ranges from -1 to 1. A value of 0 indicates no association, 1 indicates perfect positive association, and -1 indicates perfect negative association. The scatter diagram is a graphical method to visualize the association between variables by plotting their values. Karl Pearson's coefficient is a commonly used algebraic method to calculate the coefficient of correlation from sample data.


![correlation-ppt [Autosaved].pptx statistics in BBA from parul University](https://cdn.slidesharecdn.com/ss_thumbnails/correlation-pptautosaved-240401173254-81d64a83-thumbnail.jpg?width=640&height=640&fit=bounds)


![Hacking-Uncovered-How-People-Get-Hacked-and-How-to-Stay-Safe[1].pptx](https://cdn.slidesharecdn.com/ss_thumbnails/hacking-uncovered-how-people-get-hacked-and-how-to-stay-safe1-260130170011-4883a9c7-thumbnail.jpg?width=640&height=640&fit=bounds)


