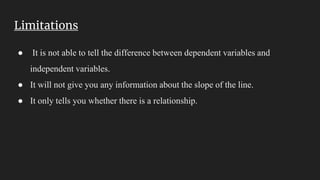
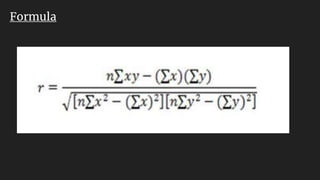
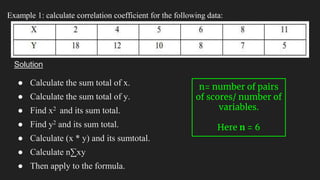
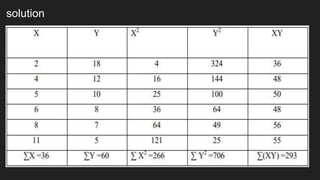
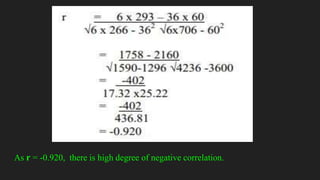
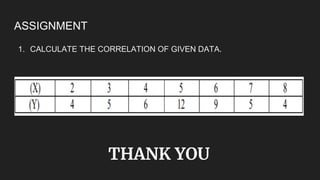
CORRELATION
KARL PEARSON’S COEFFICIENT CORRELATION
Intro
● Also called as “The Karl Pearson‘s product-moment correlation coefficient”.
● It is a measure of the strength of a linear association between two variables.
● denoted by r or rxy.
■ x and y being the two variables involved.
● It attempts to draw a line of best fit through the data of two variables.
● value of the Pearson correlation coefficient, r, indicates how far away all
these data points are to this line of best fit.
● r lies between -1 and +1, or –1 ≤ r ≤ 1, or the numerical value of r cannot
exceed one (unity).
Interpretation of r.
● The value of the coefficient of correlation will always lie between -1 and +1.,
i.e., –1 ≤ r ≤ 1.
○ If r = +1, it means, there is perfect positive correlation.
○ If r = -1, there is perfect negative correlation.
○ If r = 0, there is no relationship between the two variables.
● It describes not only the magnitude of correlation but also its direction.
■ The degree of correlation depends upon the value.
● + 0.1 shows Lower degree of +ve correlation
● +0.8 shows Higher degree of +ve correlation.
● -0.1 shows Lower degree of -ve correlation.
● -0.8 shows Higher degree of -ve correlation.
Assumptions
While calculating Karl Pearson Correlation
● There is a linear relationship (or any linear component of the relationship) between
the two variables.
● We keep Outliers either to a minimum or remove them entirely.
Properties of the Pearson’s Correlation Coefficient
1. r lies between -1 and +1, or –1 ≤ r ≤ 1, or the numerical value of r cannot exceed one.
2. The correlation coefficient is independent of the change of origin and scale.
3. Two independent variables are uncorrelated but the converse is not true.
Limitations
● It is not able to tell the difference between dependent variables and
independent variables.
● It will not give you any information about the slope of the line.
● It only tells you whether there is a relationship.
Formula
Example 1: calculate correlation coefficient for the following data:
Solution
● Calculate the sum total of x.
● Calculate the sum total of y.
● Find x2 and its sum total.
● Find y2 and its sum total.
● Calculate (x * y) and its sumtotal.
● Calculate n∑xy
● Then apply to the formula.
n= number of pairs
of scores/ number of
variables.
Here n = 6
solution
As r = -0.920, there is high degree of negative correlation.
ASSIGNMENT
1. CALCULATE THE CORRELATION OF GIVEN DATA.
THANK YOU

Karl pearson's correlation

  • 1.
  • 2.
    Intro ● Also calledas “The Karl Pearson‘s product-moment correlation coefficient”. ● It is a measure of the strength of a linear association between two variables. ● denoted by r or rxy. ■ x and y being the two variables involved. ● It attempts to draw a line of best fit through the data of two variables. ● value of the Pearson correlation coefficient, r, indicates how far away all these data points are to this line of best fit. ● r lies between -1 and +1, or –1 ≤ r ≤ 1, or the numerical value of r cannot exceed one (unity).
  • 3.
    Interpretation of r. ●The value of the coefficient of correlation will always lie between -1 and +1., i.e., –1 ≤ r ≤ 1. ○ If r = +1, it means, there is perfect positive correlation. ○ If r = -1, there is perfect negative correlation. ○ If r = 0, there is no relationship between the two variables. ● It describes not only the magnitude of correlation but also its direction. ■ The degree of correlation depends upon the value. ● + 0.1 shows Lower degree of +ve correlation ● +0.8 shows Higher degree of +ve correlation. ● -0.1 shows Lower degree of -ve correlation. ● -0.8 shows Higher degree of -ve correlation.
  • 4.
    Assumptions While calculating KarlPearson Correlation ● There is a linear relationship (or any linear component of the relationship) between the two variables. ● We keep Outliers either to a minimum or remove them entirely. Properties of the Pearson’s Correlation Coefficient 1. r lies between -1 and +1, or –1 ≤ r ≤ 1, or the numerical value of r cannot exceed one. 2. The correlation coefficient is independent of the change of origin and scale. 3. Two independent variables are uncorrelated but the converse is not true.
  • 5.
    Limitations ● It isnot able to tell the difference between dependent variables and independent variables. ● It will not give you any information about the slope of the line. ● It only tells you whether there is a relationship.
  • 6.
  • 7.
    Example 1: calculatecorrelation coefficient for the following data: Solution ● Calculate the sum total of x. ● Calculate the sum total of y. ● Find x2 and its sum total. ● Find y2 and its sum total. ● Calculate (x * y) and its sumtotal. ● Calculate n∑xy ● Then apply to the formula. n= number of pairs of scores/ number of variables. Here n = 6
  • 8.
  • 9.
    As r =-0.920, there is high degree of negative correlation.
  • 10.
    ASSIGNMENT 1. CALCULATE THECORRELATION OF GIVEN DATA. THANK YOU