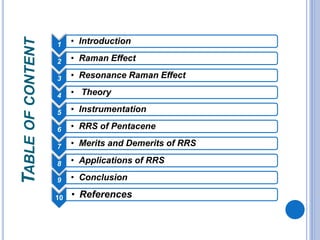
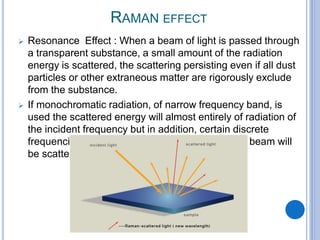
SAMRAT PRITHVIRAJ CHAUHAN GOVERNMENT
COLLEGE
AJMER
Resonance Raman Spectroscopy
Submitted by
Rohini Narwal
M.Sc. Chemistry
Semester 2nd
2020-2021
Department Of Chemistry
T
ABLE
OF
CONTENT
1 • Introduction
2 • Raman Effect
3 • Resonance Raman Effect
4 • Theory
5 • Instrumentation
6 • RRS of Pentacene
7 • Merits and Demerits of RRS
8 • Applications of RRS
9 • Conclusion
10 • References
INTRODUCTION
 Raman Spectroscopy is based on scattering of radiation
which is phenomenon discovered in 1928 by physicist Sir
C.V.Raman and he won the Noble Prize in 1930 for his work.
 The field of Raman spectroscopy was greatly enhanced by
the advent of laser technology during 1960s.
 Resonance Raman spectroscopy also helped to advance
the field:
1) The Resonance Raman Spectroscopy is a particular
application of the general Raman spectroscopy where the
incident laser radiation has a frequency that matches the
energy of an electronic transition in the sample.
2) This technique is more selective compared to non
resonance Raman spectroscopy.
3) It works by exciting the analyte with incident radiation
corresponding to the electronic absorption bands. This
RAMAN EFFECT
 Resonance Effect : When a beam of light is passed through
a transparent substance, a small amount of the radiation
energy is scattered, the scattering persisting even if all dust
particles or other extraneous matter are rigorously exclude
from the substance.
 If monochromatic radiation, of narrow frequency band, is
used the scattered energy will almost entirely of radiation of
the incident frequency but in addition, certain discrete
frequencies above and below that of the incident beam will
be scattered, it is called Raman Scattering.
RESONANCE RAMAN EFFECT
 The phenomenon in which Raman line intensities are
greatly enhanced by excitation with wavelengths that
closely approach that of an electronic absorption peak of an
analyte is known as Resonance Raman Effect.
 Pre-resonance is the condition where the laser excitation is
around 100 wavenumbers below the electronic transition.
 And the spectrum so obtained is called Resonance Raman
Spectrum.
THEORY
 The theory of resonance Raman effect is rather
complex.
 Kramers Heisenberg Dirac (KHD) equation
Normal modes with large displacement in
excited state are most intense
 The Raman polarizability is given by the term (α
ρσ)GF where ρ and σ are the polarizations of
incident and Raman scattered light and the
terms G and F correspond to the ground and
final vibronic states of the molecule.
 The excited state is indicated by E.
 The polarization dependent dipole operator is
given by either rρ or rσ.
 The summation symbol indicates that the
Raman polarizability is given by the sum of all
of the vibronic states of the molecule.
 ν GE, νEF, and νL are the frequencies of the
ground to excited state transition, excited state
to final state transition, and laser.
INSTRUMENTATION
 The main components of a resonance raman spectroscopy
system are
1) Light source
2) Optical components such as lenses and mirrors to focus
the light onto a sample and collect the scattered light
3) A spectrometer
4) A detector
 The light source is typically a VIS,NIR laser emitting
monochromatic light. Types of lasers are gas lasers e.g.
Ar⁺(488 and 514.5nm), diode-pumped solid state lasers or
tunable lasers are most suitable for RRS.
 Notch filters are used to filter the Rayleigh line intensity
before the scattered light is entering the spectrometer and
the detector (CCD camera).
Schematic diagram of Resonance Raman Spectrometer
RESONANCE RAMAN SPECTROSCOPY OF PENTACENE
Pentacene is a
polycyclic aromatic
hydrocarbon which
is consisting of five
linearly-fused
benzene rings.
Pentacene is a
compound of great
interest in the world
of molecular
electronics and is
solids at room
temperature.
It absorb light in
the visible region of
the spectrum make
it good candidates
for resonance
Raman
Pentacene appears
almost black. This
highly conjugated
compound is an
organic
 A resonance Raman spectrum of pentacene acquired using
633 nm excitation.
 The highest energy bands in the fingerprint region will be due to
aromatic ring vibrational modes at approximately 1600 cm-1.
 The most prominent bands in the spectrum appear at
1158,1176,1371,1532 and 1597cm-1 . The first four of these bands
have been assigned to Ag symmetry species and the 1597 cm-1
band to the B3g symmetry species.
 An expand view of the portion 1600 to 3000 cm-1 of the Raman
spectrum consisting of overtones and combination modes. The
peak at 3194 cm-1 can be attributed to aromatic C-H stretching.
DIFFERENCES IN THE RAMAN SPECTRA AS A
FUNCTION OF EXCITATION WAVELENGTH
 A profile of Raman spectra of pentacene acquired using
405, 473, 532, 633, and 785 nm excitation.
 All of the excitation wavelengths fall within the absorption
spectrum of pentacene and therefore yield resonantly
enhanced Raman spectra .
 Although absorption occurs for all of the other laser excitation
wavelengths, they do not all couple to the same electronic
transition.
 Using a longer excitation wavelength at 532 nm, we see
definite changes in the relative intensities of the bands.
 At 633 nm excitation, the spectrum is similar to that obtained
with 532 nm excitation, but we observe a small recovery of
the strengths of the 1408 and 1456 cm-1 bands.
 Finally, at 785 nm excitation we observe a very different
Raman spectrum with respect to relative intensities because
at this wavelength we are now out of resonance.
MERITS OF RRS
 It improves the sensitivity, which allows detection of the
sample at micromolar concentration, whereas FTIR and
conventional Raman require millimolar concentration.
 The state of the sample required for RRS can be solid,
fiber, gel, or solution.
 The time scale is on the order of 10⁻15–10⁻14 s, which is
too short, and is on the order of molecular vibrations.
 No additional probes are required for analysis.
DEMERITS OF RRS
 The disadvantage of this technique is that the laser light
used for excitation can damage the sample, which can be
solved by either agitation of the sample or using flow
methods.
 Fluorescence is a problem for Resonance Raman
techniques, particularly when using sources in the visible
range which can swamp the Raman signal.
APPLICATIONS OF RESONANCE RAMAN
SPECTROSCOPY
 RR Spectroscopy provides structural information.
GEOMETRY
•Active –site structure
•Isotope shifts
•Characteristic
frequencies
•Symmetry
•Relative changes across
a series
ELECTRONIC STRUCTURE
•Bond lengths
•Excited state structure
•Nature of electronic transition
•Excitation profiles
Reactivity
•Potential energy surface(s)
•Reaction coordinate
•Spectral/frequency changes as
a function of time
•Rapid freeze quenching
•Continuous flow/mixing
 RRS is a powerful technique for monitoring the
structure and dynamics of proteins and peptides in
solution.
 The ultraviolet resonance Raman spectra are
employed for the conformation analysis of proteins
and amyloid fibres.
 RRS is employed in biomedical applications including
single blood cell detection by the trapping method.
 The antioxidative capacity of the skin in vivo has been
studied using RRS.
RRS to identify carotenoids in lower epidermis and dermis in ca
skin
CONCLUSION
 Vibrational overtones and combination modes can appear in
resonance raman spectra whereas they are frequently
absent from non-resonant raman spectra.
 A tunable laser is preferred for resonance Raman and can
be an advantage. That is because only one laser is
necessary to do analyses of multiples samples in which each
one requires a different excitation wavelength. This allows
the user to switch out samples without having to switch out
the lasers as well.
 If the excitation wavelength is in resonance with an
electronic transition of the sample, then enhancement of the
signal strength of some Raman bands can occur.
Consequently, the resonance Raman spectrum can appear
quite different from the normal Raman spectrum because of
the sometimes very significant differences in relative
intensities.
REFERENCES
 Molecular Structure and Spectroscopy
by G.ARULDHAS
 Fundamental of molecular spectroscopy
by COLIN N.BANWELL AND ELAINE M.McCASH
 Chemistry LibreTexts™
<chem.libretexts.org>
 Spectroscopy solution for materials analysis
<spectroscopyonline.com>
For Your Time and Attention
Thank You

Resonance Raman Spectroscopy

  • 1.
    SAMRAT PRITHVIRAJ CHAUHANGOVERNMENT COLLEGE AJMER Resonance Raman Spectroscopy Submitted by Rohini Narwal M.Sc. Chemistry Semester 2nd 2020-2021 Department Of Chemistry
  • 2.
    T ABLE OF CONTENT 1 • Introduction 2• Raman Effect 3 • Resonance Raman Effect 4 • Theory 5 • Instrumentation 6 • RRS of Pentacene 7 • Merits and Demerits of RRS 8 • Applications of RRS 9 • Conclusion 10 • References
  • 3.
    INTRODUCTION  Raman Spectroscopyis based on scattering of radiation which is phenomenon discovered in 1928 by physicist Sir C.V.Raman and he won the Noble Prize in 1930 for his work.  The field of Raman spectroscopy was greatly enhanced by the advent of laser technology during 1960s.  Resonance Raman spectroscopy also helped to advance the field: 1) The Resonance Raman Spectroscopy is a particular application of the general Raman spectroscopy where the incident laser radiation has a frequency that matches the energy of an electronic transition in the sample. 2) This technique is more selective compared to non resonance Raman spectroscopy. 3) It works by exciting the analyte with incident radiation corresponding to the electronic absorption bands. This
  • 4.
    RAMAN EFFECT  ResonanceEffect : When a beam of light is passed through a transparent substance, a small amount of the radiation energy is scattered, the scattering persisting even if all dust particles or other extraneous matter are rigorously exclude from the substance.  If monochromatic radiation, of narrow frequency band, is used the scattered energy will almost entirely of radiation of the incident frequency but in addition, certain discrete frequencies above and below that of the incident beam will be scattered, it is called Raman Scattering.
  • 5.
    RESONANCE RAMAN EFFECT The phenomenon in which Raman line intensities are greatly enhanced by excitation with wavelengths that closely approach that of an electronic absorption peak of an analyte is known as Resonance Raman Effect.  Pre-resonance is the condition where the laser excitation is around 100 wavenumbers below the electronic transition.  And the spectrum so obtained is called Resonance Raman Spectrum.
  • 6.
    THEORY  The theoryof resonance Raman effect is rather complex.  Kramers Heisenberg Dirac (KHD) equation Normal modes with large displacement in excited state are most intense  The Raman polarizability is given by the term (α ρσ)GF where ρ and σ are the polarizations of incident and Raman scattered light and the terms G and F correspond to the ground and final vibronic states of the molecule.  The excited state is indicated by E.  The polarization dependent dipole operator is given by either rρ or rσ.  The summation symbol indicates that the Raman polarizability is given by the sum of all of the vibronic states of the molecule.  ν GE, νEF, and νL are the frequencies of the ground to excited state transition, excited state to final state transition, and laser.
  • 7.
    INSTRUMENTATION  The maincomponents of a resonance raman spectroscopy system are 1) Light source 2) Optical components such as lenses and mirrors to focus the light onto a sample and collect the scattered light 3) A spectrometer 4) A detector  The light source is typically a VIS,NIR laser emitting monochromatic light. Types of lasers are gas lasers e.g. Ar⁺(488 and 514.5nm), diode-pumped solid state lasers or tunable lasers are most suitable for RRS.  Notch filters are used to filter the Rayleigh line intensity before the scattered light is entering the spectrometer and the detector (CCD camera).
  • 8.
    Schematic diagram ofResonance Raman Spectrometer
  • 9.
    RESONANCE RAMAN SPECTROSCOPYOF PENTACENE Pentacene is a polycyclic aromatic hydrocarbon which is consisting of five linearly-fused benzene rings. Pentacene is a compound of great interest in the world of molecular electronics and is solids at room temperature. It absorb light in the visible region of the spectrum make it good candidates for resonance Raman Pentacene appears almost black. This highly conjugated compound is an organic
  • 10.
     A resonanceRaman spectrum of pentacene acquired using 633 nm excitation.  The highest energy bands in the fingerprint region will be due to aromatic ring vibrational modes at approximately 1600 cm-1.  The most prominent bands in the spectrum appear at 1158,1176,1371,1532 and 1597cm-1 . The first four of these bands have been assigned to Ag symmetry species and the 1597 cm-1 band to the B3g symmetry species.  An expand view of the portion 1600 to 3000 cm-1 of the Raman spectrum consisting of overtones and combination modes. The peak at 3194 cm-1 can be attributed to aromatic C-H stretching.
  • 11.
    DIFFERENCES IN THERAMAN SPECTRA AS A FUNCTION OF EXCITATION WAVELENGTH
  • 12.
     A profileof Raman spectra of pentacene acquired using 405, 473, 532, 633, and 785 nm excitation.  All of the excitation wavelengths fall within the absorption spectrum of pentacene and therefore yield resonantly enhanced Raman spectra .  Although absorption occurs for all of the other laser excitation wavelengths, they do not all couple to the same electronic transition.  Using a longer excitation wavelength at 532 nm, we see definite changes in the relative intensities of the bands.  At 633 nm excitation, the spectrum is similar to that obtained with 532 nm excitation, but we observe a small recovery of the strengths of the 1408 and 1456 cm-1 bands.  Finally, at 785 nm excitation we observe a very different Raman spectrum with respect to relative intensities because at this wavelength we are now out of resonance.
  • 13.
    MERITS OF RRS It improves the sensitivity, which allows detection of the sample at micromolar concentration, whereas FTIR and conventional Raman require millimolar concentration.  The state of the sample required for RRS can be solid, fiber, gel, or solution.  The time scale is on the order of 10⁻15–10⁻14 s, which is too short, and is on the order of molecular vibrations.  No additional probes are required for analysis. DEMERITS OF RRS  The disadvantage of this technique is that the laser light used for excitation can damage the sample, which can be solved by either agitation of the sample or using flow methods.  Fluorescence is a problem for Resonance Raman techniques, particularly when using sources in the visible range which can swamp the Raman signal.
  • 14.
    APPLICATIONS OF RESONANCERAMAN SPECTROSCOPY  RR Spectroscopy provides structural information. GEOMETRY •Active –site structure •Isotope shifts •Characteristic frequencies •Symmetry •Relative changes across a series ELECTRONIC STRUCTURE •Bond lengths •Excited state structure •Nature of electronic transition •Excitation profiles Reactivity •Potential energy surface(s) •Reaction coordinate •Spectral/frequency changes as a function of time •Rapid freeze quenching •Continuous flow/mixing
  • 15.
     RRS isa powerful technique for monitoring the structure and dynamics of proteins and peptides in solution.  The ultraviolet resonance Raman spectra are employed for the conformation analysis of proteins and amyloid fibres.  RRS is employed in biomedical applications including single blood cell detection by the trapping method.  The antioxidative capacity of the skin in vivo has been studied using RRS. RRS to identify carotenoids in lower epidermis and dermis in ca skin
  • 16.
    CONCLUSION  Vibrational overtonesand combination modes can appear in resonance raman spectra whereas they are frequently absent from non-resonant raman spectra.  A tunable laser is preferred for resonance Raman and can be an advantage. That is because only one laser is necessary to do analyses of multiples samples in which each one requires a different excitation wavelength. This allows the user to switch out samples without having to switch out the lasers as well.  If the excitation wavelength is in resonance with an electronic transition of the sample, then enhancement of the signal strength of some Raman bands can occur. Consequently, the resonance Raman spectrum can appear quite different from the normal Raman spectrum because of the sometimes very significant differences in relative intensities.
  • 17.
    REFERENCES  Molecular Structureand Spectroscopy by G.ARULDHAS  Fundamental of molecular spectroscopy by COLIN N.BANWELL AND ELAINE M.McCASH  Chemistry LibreTexts™ <chem.libretexts.org>  Spectroscopy solution for materials analysis <spectroscopyonline.com>
  • 18.
    For Your Timeand Attention Thank You