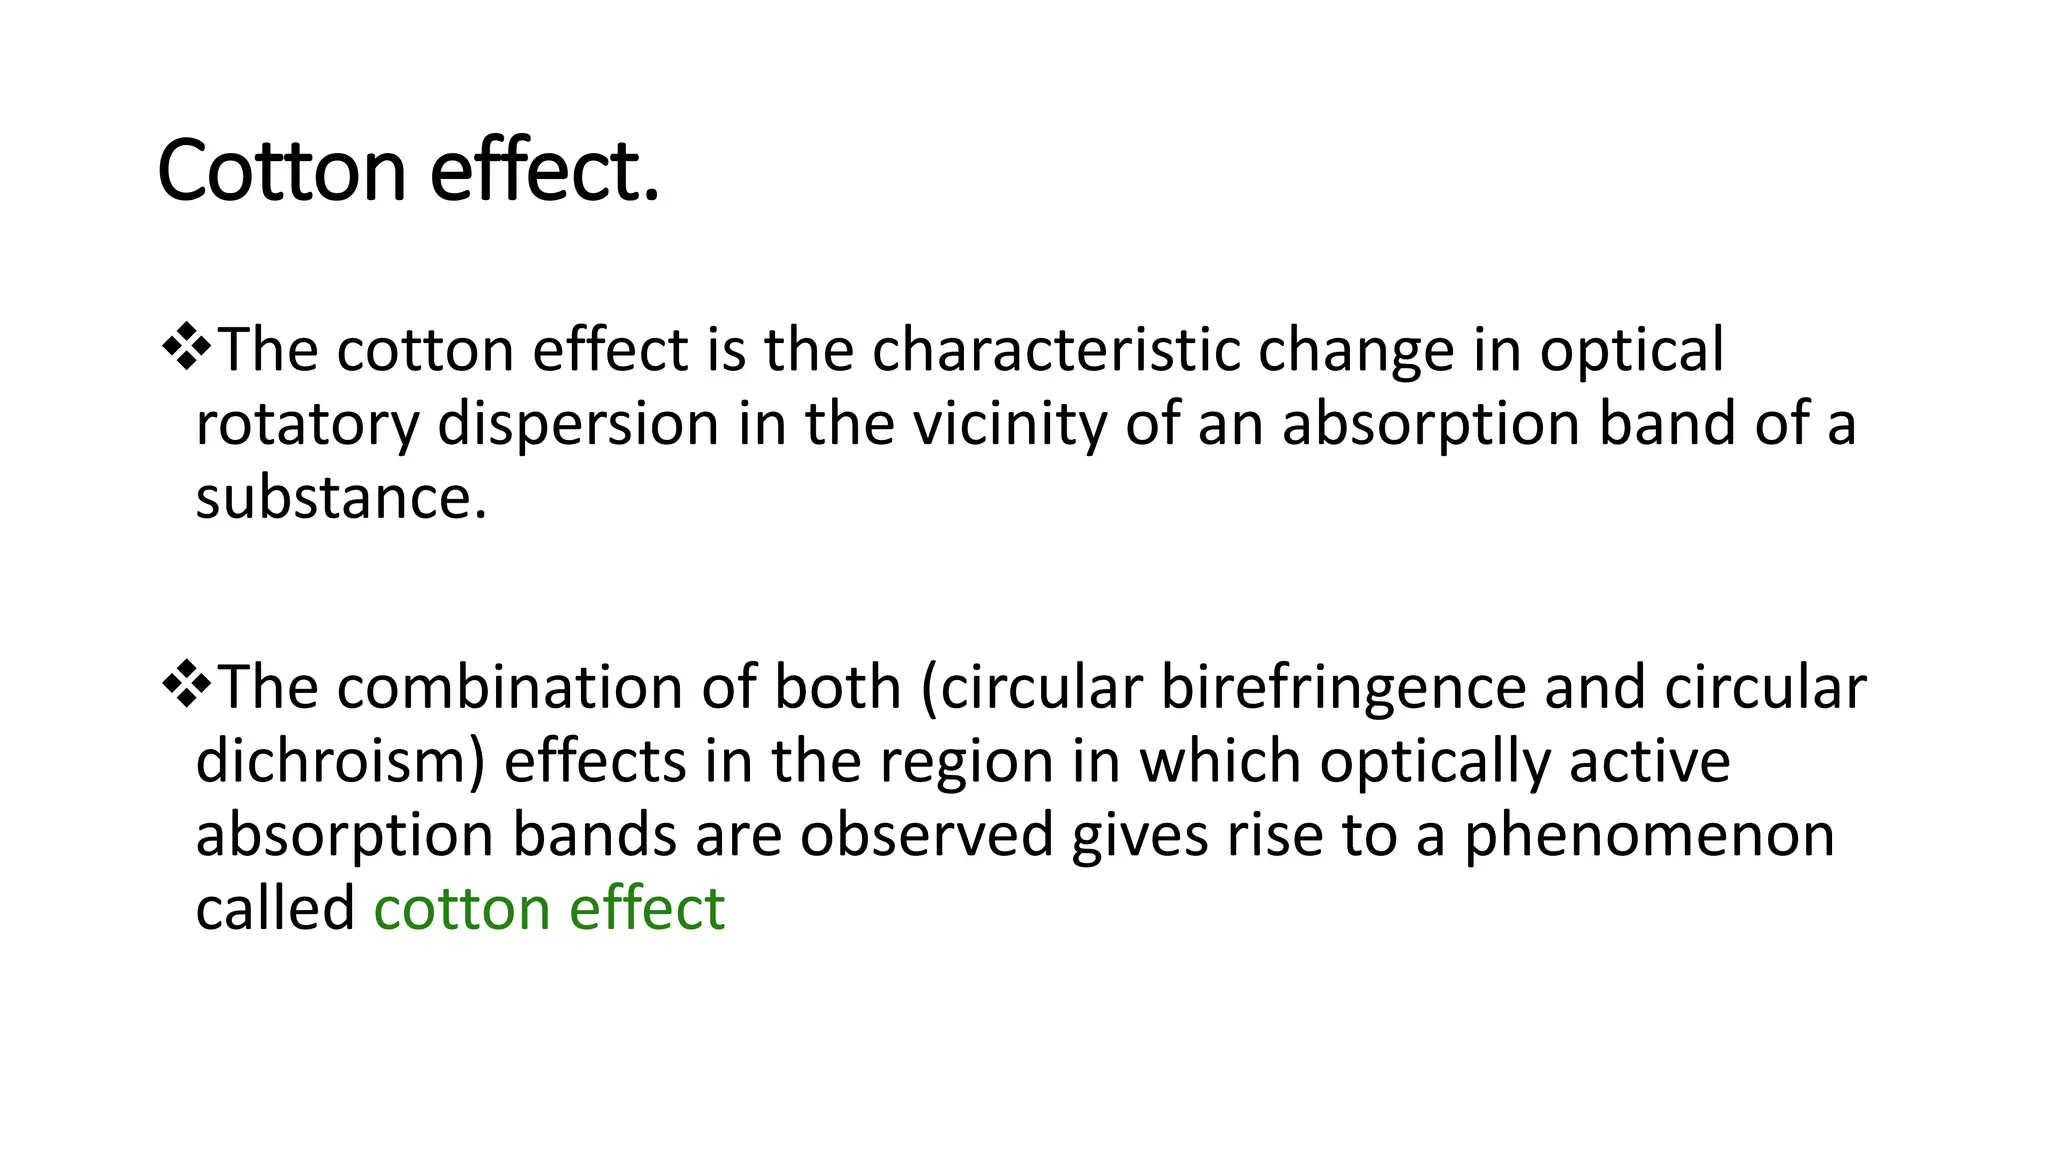
- The document summarizes the cotton effect, which is a characteristic change observed in optical rotatory dispersion curves within absorption bands of chiral compounds. It occurs when both circular dichroism and optical rotation effects are present.
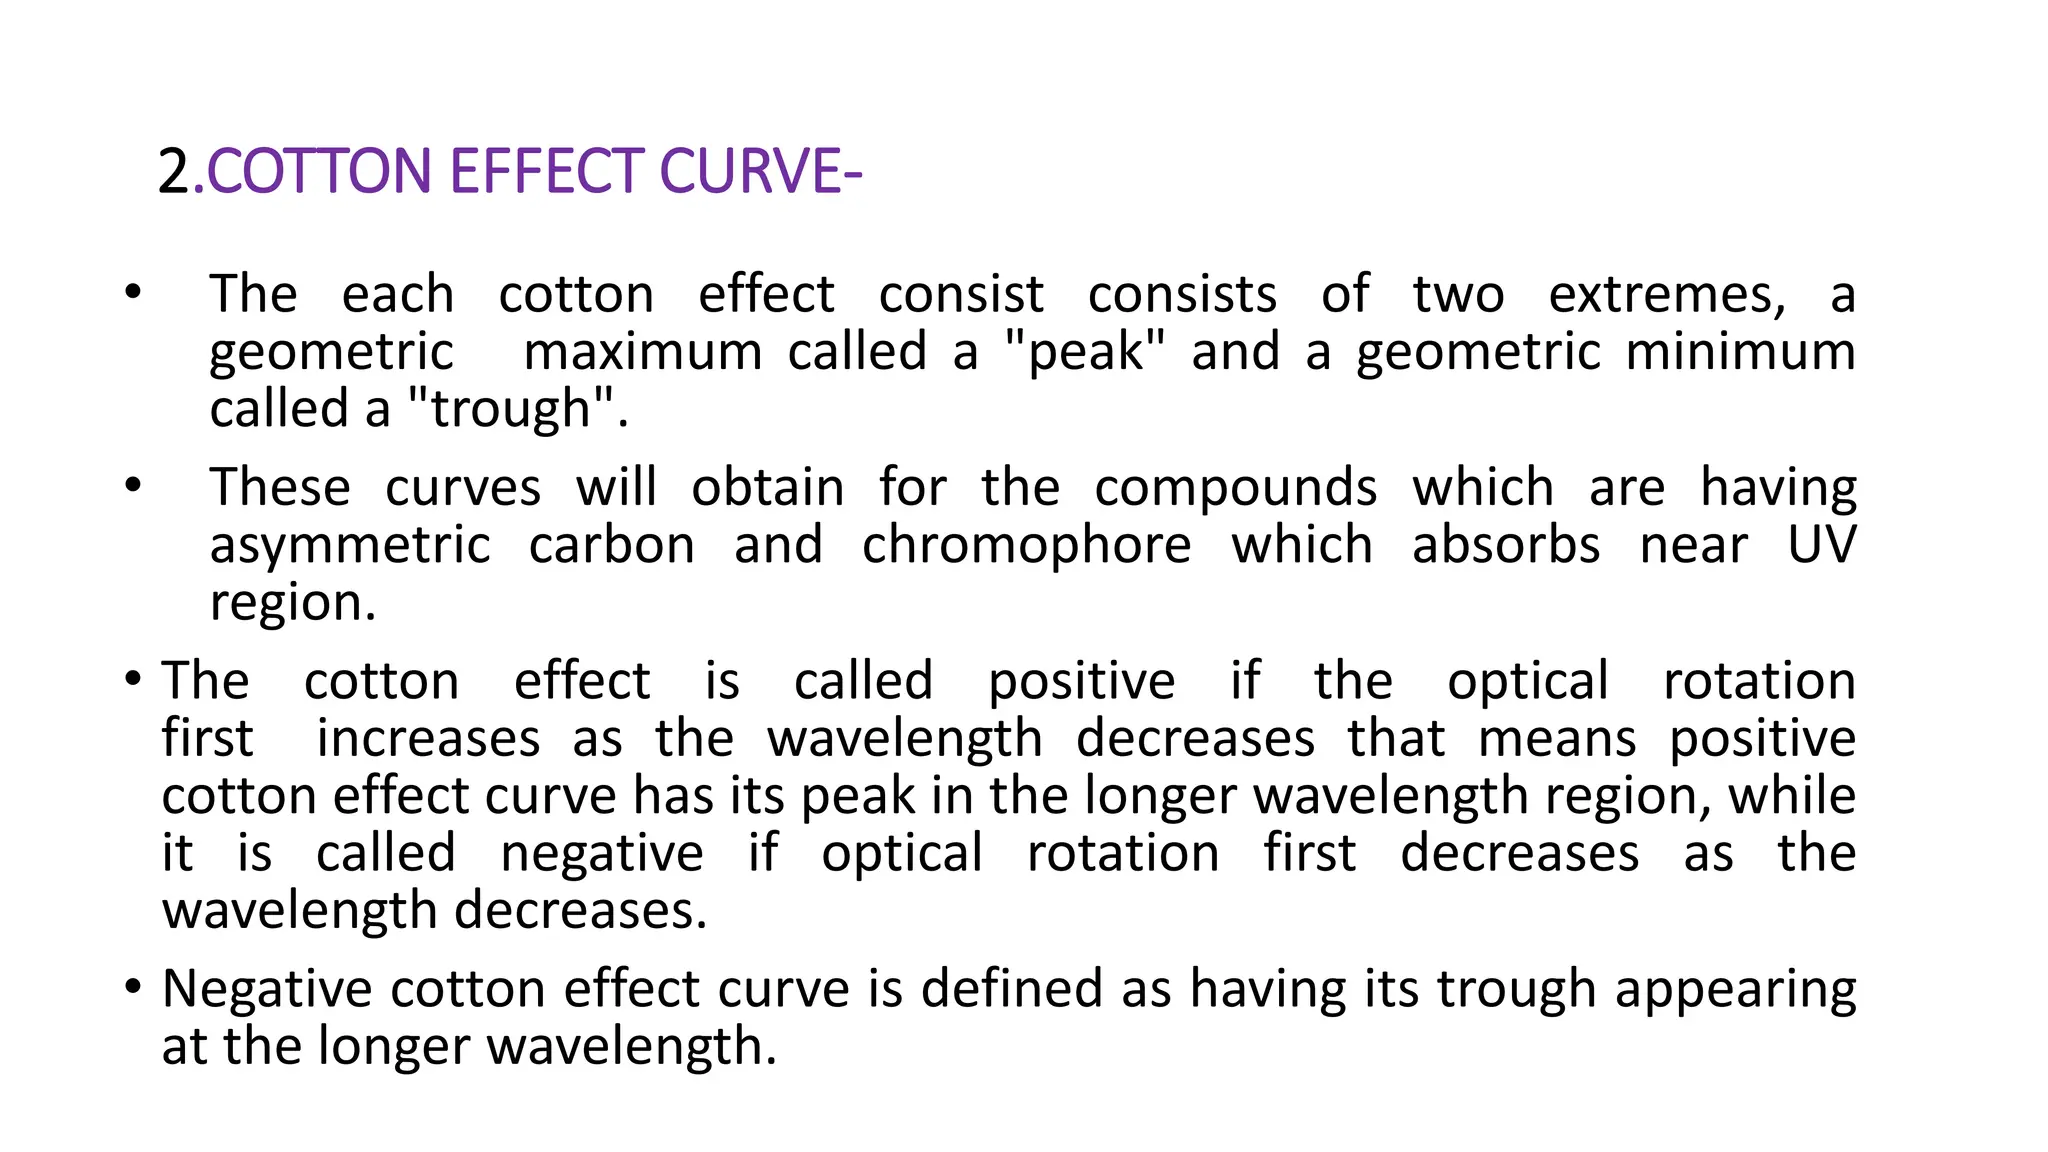
- Cotton effects can be either positive or negative depending on the direction of the initial change in optical rotation. They can also be single or multiple peaks based on the number of maxima and minima seen in the curve.
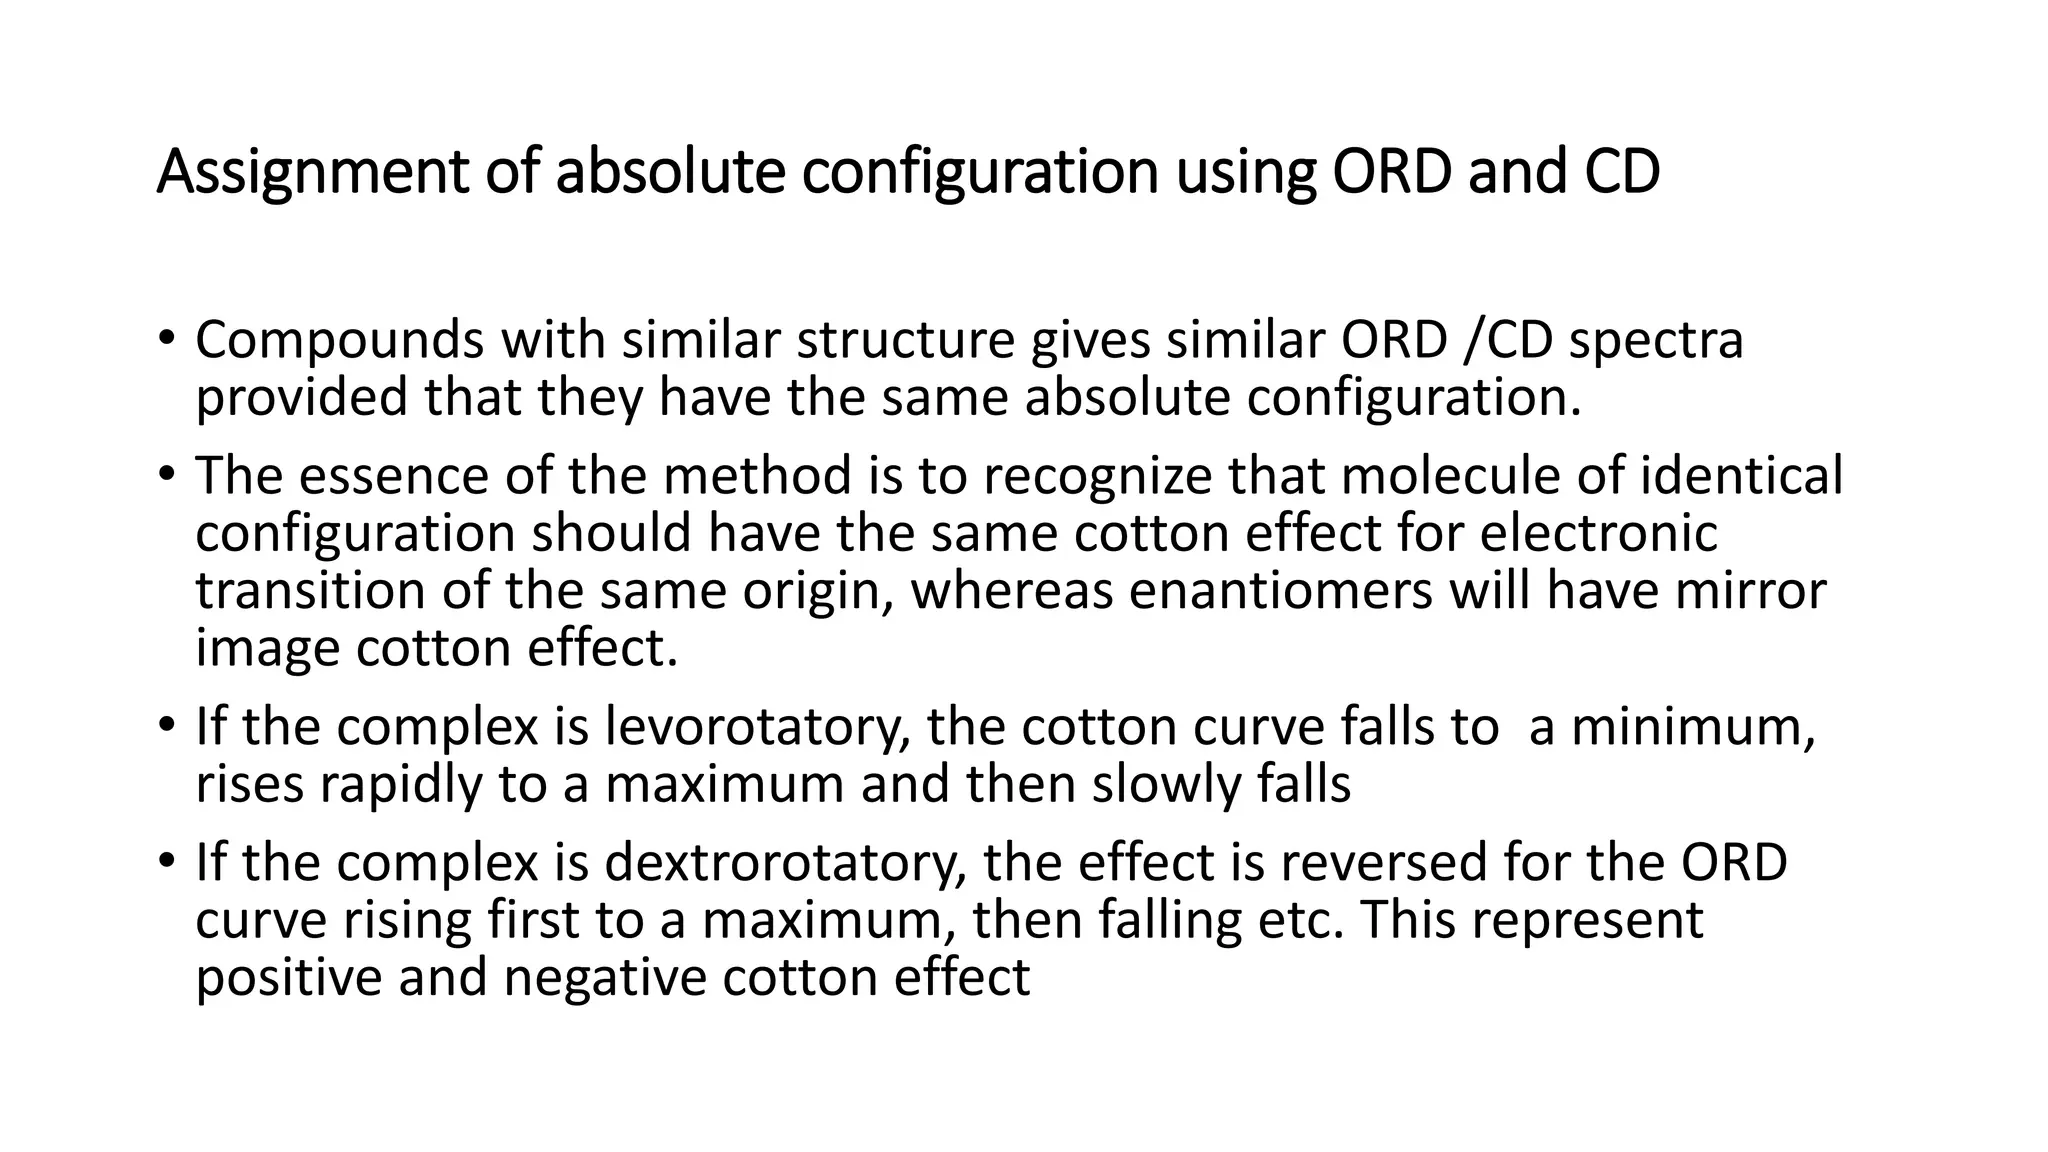
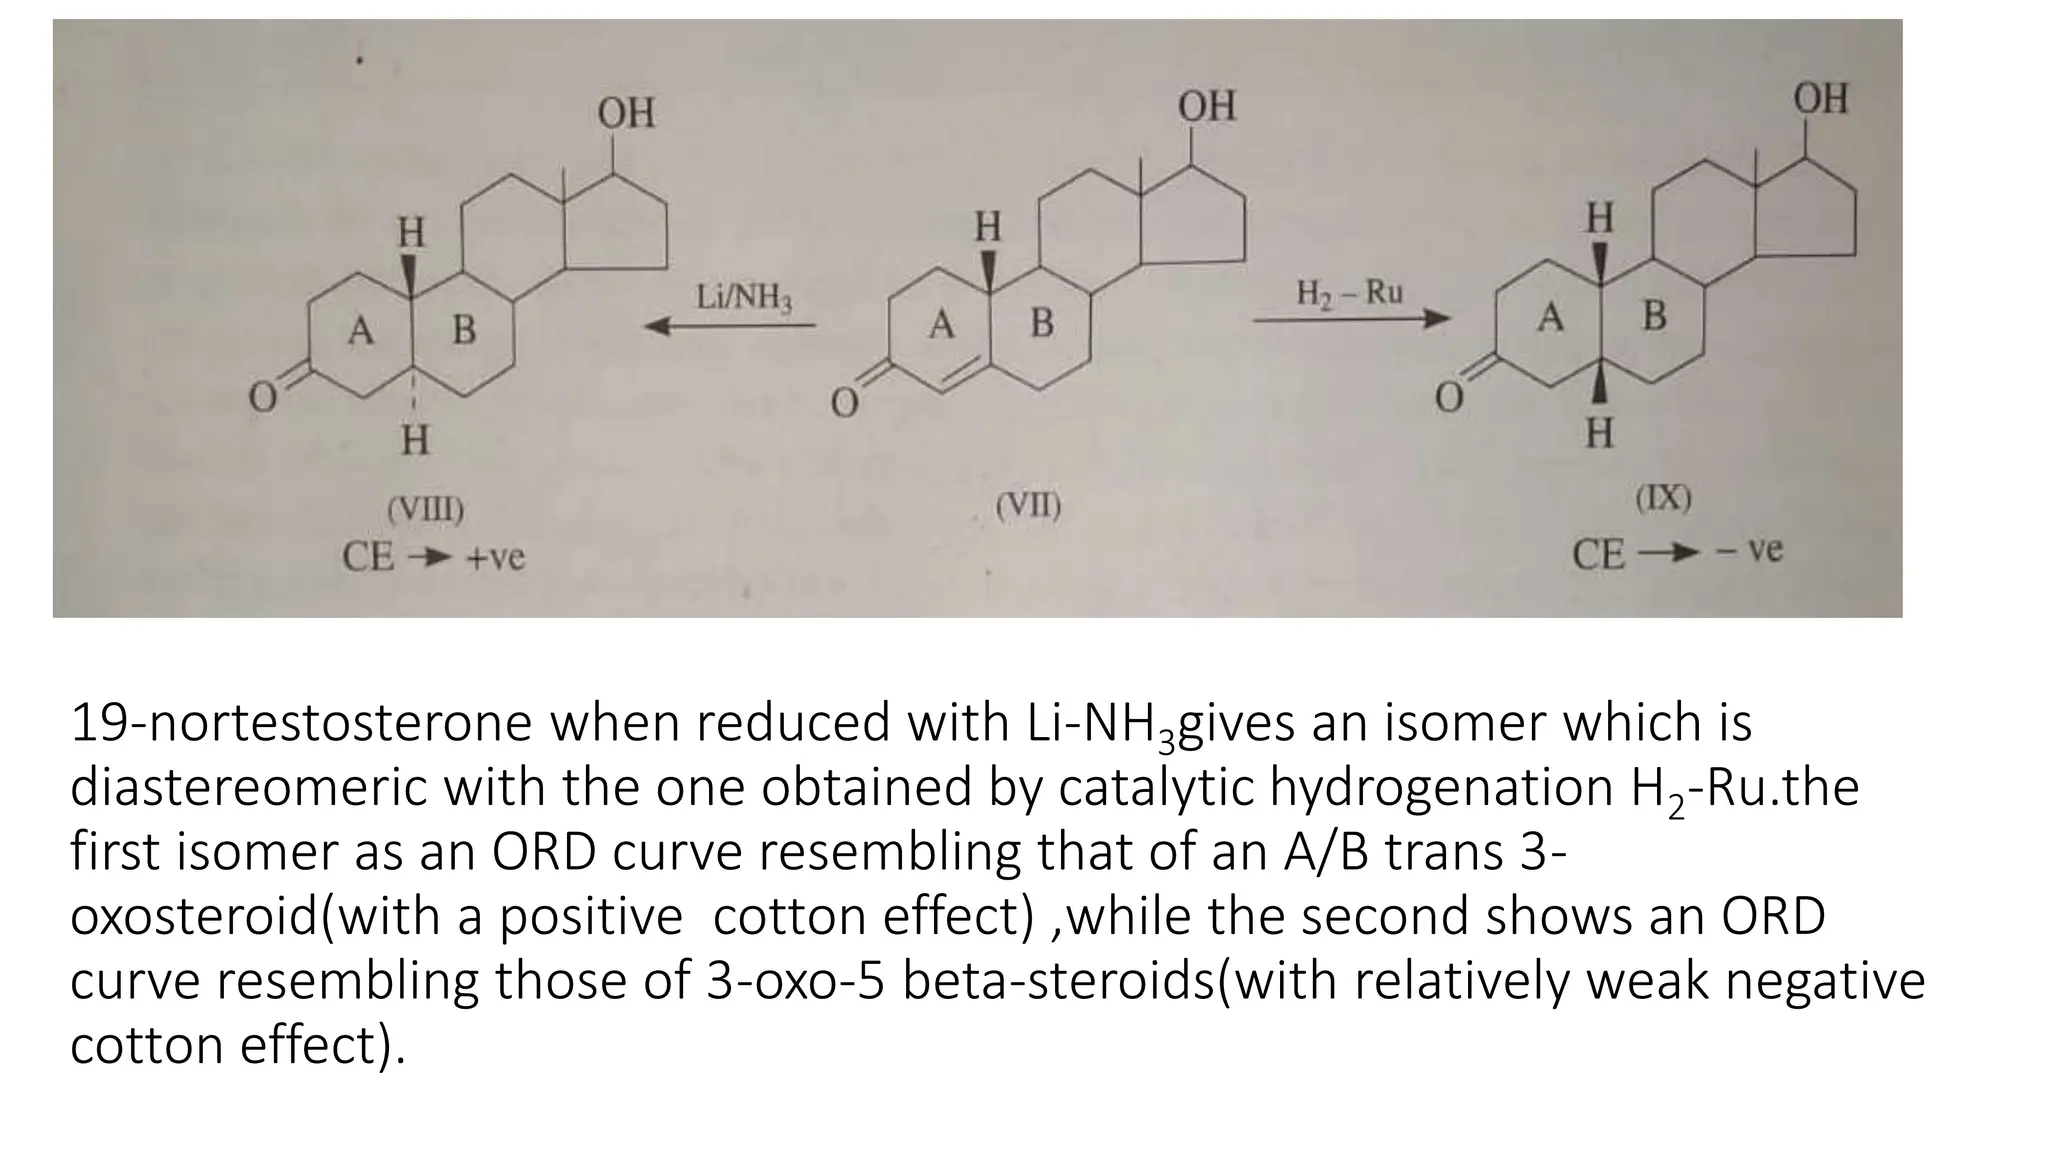
- Analysis of cotton effect curves provides information about functional groups, configuration, and conformational changes in molecules. They allow determination of absolute configuration when compared to reference compounds.


![REFERENCE:
• Stereochemistry of Organic Compounds by D. Nasipuri Second Edition
[page no.423- 425]
• http:/www.sciencedirect.com
• http:/www.access science.com
• https://epgp.inflibnet.ac.in/Home/About
• Inorganic stereochemistry by David L. Kepert [volume 6]
[page no.398-402].](https://image.slidesharecdn.com/darshanas11113-231121130857-8bf6f748/75/cotton-effect-17-2048.jpg)