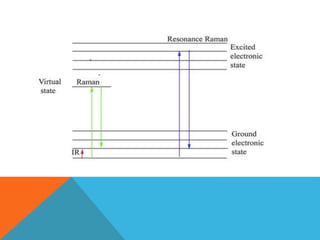
EPANDING THE CONTENT OF AN OUTLINE using notes.pptx
Raman Spectroscopy Techniques for Analyzing Molecular Vibrations
1.
2. Raman spectroscopy was discovered by C. V. Raman in 1928
It is a spectroscopic technique used to observe vibration , rotational,
and other low-frequency modes in a system.
3. Resonance Raman spectroscopy (RR spectroscopy)
RAMAN technique in which the incident photon energy is close
in energy to an electronic transitions of a compound or material
under examination.
The frequency coincidence (or resonance) can lead to greatly
enhanced intensity of RAMAN scattering, which facilitates the
study of chemical compounds present at low concentrations.
Raman scattering is usually extremely weak, of the order of 1 in
10 million photons that hit a sample are scattered with the loss
(Stokes) or gain (anti-Stokes) of energy because of changes in
vibrational energy of the molecules in the sample.
Resonance enhancement of Raman scattering requires that the
wavelength of the laser used is close to that of an electronic
transition.
4. Theory of resonance Raman scattering
In resonance Raman spectroscopy, the wavelength of the incoming
photons coincides with an electronic transitions of the molecule or
material.
Electronic excitation of a molecule results in structural changes which
are reflected in the enhancement of Raman scattering of certain
vibrational modes. Vibrational modes that undergo a change in bond
length and/or force constant during the electronic excitation can show a
large increase in polarizability and hence Raman intensity. This is
known as Tsuboi's rule, which gives a qualitative relationship between
the nature of an electronic transition and the enhancement pattern in
resonance Raman spectroscopy.
5.
6. In larger molecules the change in electron density can be
largely confined to one part of the molecule, chromophor,
and in these cases the Raman bands that are enhanced are
primarily from those parts of the molecule in which the
electronic transition leads to a change in bond length or
force constant in the excited state of the chroomophor.
For large molecules such as proteins, this selectivity helps
to identify the observed bands as originating from
vibrational modes of specific parts of the
molecules or proteins, such as heme unit
within myoglobin.
7. RR spectroscopy provide information about the vibrations of
molecules, and can also be used for identifying unknown
substances and analysis of bioinorganic molecules.
RR spectroscopy is an extension of conventional Raman
spectroscopy that can provide increased sensitivity to specific
(colored) compounds that are present at low (micro to millimolar)
in complex mixture of compounds.
An advantage of resonance Raman spectroscopy over (normal)
Raman spectroscopy is that the intensity of bands can be increased
by several orders of magnitude. Identification of the band
associated with the O–O stretching vibration was confirmed by
using 18O–16O and 16O–16O isotopologes in cytochrome oxidase.
8. Applications
Raman scattering from specific modes under resonance
conditions means that it is especially useful for large
biomolecules with chromophores the resonance
scattering from charge-transfer (CT) electronic
transitions of the metal complex generally result in
enhancement of metal- ligand stretching modes.
Hemoglobin, tuning the laser to near the charge-transfer
electronic transition of the iron center results in a
spectrum reflecting only the stretching and bending
modes associated with the tetrapyrrole-iron group.
9. The Raman spectrum of a protein containing perhaps hundreds of
peptide bonds but only a single porphyrin molecule may show only
the vibrations associated with the porphyrin. This reduces the
complexity of the spectrum and allows for easier identification of
an unknown protein.
The main advantage of RR spectroscopy over non-resonant Raman
spectroscopy is the large increase in intensity of the bands in
question (by as much as a factor of 106) when pulsed lasers are
used.
10. This is in stark contrast to non-resonant Raman spectra, which
usually requires concentrations greater than 0.01 M.
RR spectra usually exhibit fewer bands than the non resonant
Raman spectrum of a compound, and the enhancement seen for each
band can vary depending on the electronic transitions with which the
laser is resonant.
RR spectroscopy are obtained with lasers at visible and near-UV
wavelengths, spectra are more likely to be affected by fluorescence.
Furthermore, photo-degradation (photo-bleaching) and heating of the
sample can occur as the sample also absorbs the excitation light,
dissipating the energy as heat.
11. Resonance hyper-Raman spectroscopy
Resonance hyper-Raman spectroscopy is a variation on resonance
Raman spectroscopy in which the aim is to achieve an excitation to a
particular energy level in the target molecule of the sample by a
phenomenon known as two-photon absorption. In two-photon
absorption, two photons are simultaneously absorbed into a molecule.
When that molecule relaxes from this excited state to its ground state,
only one photon is emitted. This is a type of fluorescence.
12. • Resonance hyper Raman spectroscopy is one of the types of “non-
linear” Raman spectroscopy. Non-linear signifies reduced
emission energy compared to input energy.
• The energy into the system no longer matches the energy out of the
system due to the energy input in hyper-Raman spectroscopy is
much larger than that of typical Raman spectroscopy.
• Non-linear Raman spectroscopy tends to be more sensitive than
conventional Raman spectroscopy, it can significantly reduce, or
even eliminate the effects of fluorescence.
13. References
Rossetti, R., S. Nakahara, and Louis E. Brus. "Quantum size effects in the redox
potentials, resonance Raman spectra, and electronic spectra of CdS crystallites
in aqueous solution." The Journal of Chemical Physics 79.2 (1983): 1086-1088.
Spiro, Thomas G., and Thomas C. Strekas. "Resonance Raman spectra of
heme proteins. Effects of oxidation and spin state." Journal of the American
Chemical Society 96.2 (1974): 338-345.
Spaulding, L. D., et al. "Resonance Raman spectra of
metallooctaethylporphyrins. Structural probe of metal displacement." Journal of
the American Chemical Society 97.9 (1975): 2517-2525.