Downloaded 220 times


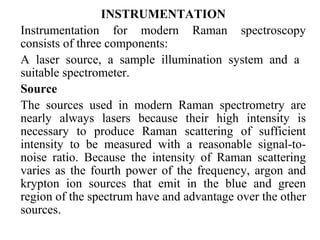
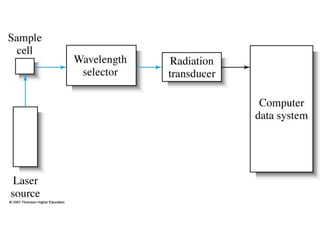
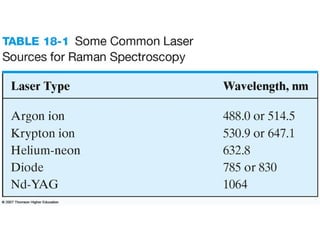


This document provides an overview of Raman spectroscopy. It discusses how Raman spectroscopy works, including that it involves scattering of monochromatic light when it interacts with molecular vibrations, resulting in a shift in wavelength. It describes the discovery of the Raman effect by C.V. Raman and how Raman spectroscopy has advantages over infrared spectroscopy such as not being interfered with by water. The document also outlines the instrumentation used in Raman spectroscopy and applications such as analyzing inorganic and organic species.


