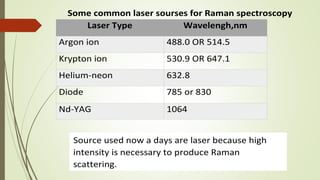
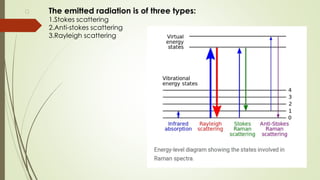
Title
“RAMAN
SPECTROSCOPY”
Sr.No. Title Page No.
1. Introduction 3
2. Background 4
3. Objective 5
4. Important 5
5. Methods and materials 6
6. Experimental details 9
7. Types 14
8. Application 19
9. Difference 21
10. Result 22
11. Discussion and conclusion 23
INDEX
INTRODUCTION
Raman spectroscopy was discovered by C.V.Raman in 1928
It is a spectroscopic technique used to observe vibration,
rotational and other low-frequency modes in a system.
Raman spectroscopy is commonly used in chemistry to
provide a fingerprint by which molecules can be identified.
When the radiation pass through the transparent medium the species present
scatter a fraction of the beam in all direction.
Raman scattering result from the same type of the quantities vibration changed
associate with IR spectra.
In 1928,Sir Dr.C.V. Raman while studying scattering of light found that when
a beam of monochromatic light was passed through organic liquid such
as benzene,toluene,etc. the scattered light contained other frequencies in
addition to that incident light.
BACKGROUND
Raman spectroscopy (named after indian physicist C.V.Raman)is a spectroscopic
technique typically used.
To determine vibrational modes of molecules, although
Rotational and other low-frequency modes of systems may also be observed.
The Raman effect was named afterone of its discoverers,
The indian scientist C.V.Raman,who observed the effect in organic liquids in 1928
together with K.S.Krishnan.
Raman won the Nobel prize in physics in 1930 for this discovery.
The first observation of raman spectra in gases was in 1929.
Raman spectroscopy was used to provide the first catlog of molecular vibrational
frequencies.
Objectives
Raman spectroscopy is a non-destructive chemical analysis technique which
provides detailed information about chemical structure,phase and
polymorphy,crystallinity and molecular interactions.It is based upon the interaction
of light with the chemical bonds within a material.
IMPORTANT
Raman spectroscopy can differentiate chemical structures,even if they contain the
same atoms in different arrangements.Analyse your sample multiple times without
damage.If you can use an optical microscope to focus onto the analysis region,you
can use a raman microscope to collect its Raman spectrum.
METHOD AND MATERIALS
Instrumentation for modern Raman spectroscopy consists of three components:
• Laser sourse
• Sample illumination system
• Suitable spectrometer
1.SOURCE:
• The sources used in modern Raman spectrometry are nearly always
lasers because their high intensity is necessary to produce Raman
scattering of sufficient intensity to be measured with a reasonable
signal-to-noise ratio.
• Because the intensity of Raman scattering varies as the fourth power of
the frequency,argon and krypton ion sources that emit in the blue
and green region of the spectrum have and advantage over the
other sources.
Some common laser sourses for Raman spectroscopy
Laser Type Wavelengh,nm
Argon ion 488.0 OR 514.5
Krypton ion 530.9 OR 647.1
Helium-neon 632.8
Diode 785 or 830
Nd-YAG 1064
Source used now a days are laser because high
intensity is necessary to produce Raman
scattering.
2.Sample illumination system
i. Liquid samples: A major advantage of sample handling in Raman spectroscopy
compared with Infrared arises because water is a weak Raman Scattered but a
strong absorber of infrared radiation.Thus,aqueous solutions can be studied by
Raman spectroscopy but not by infrared.
This advantage is particularly important for biological and inorganic systems and
in studies dealing with water pollution problems.
ii. Solid samples:Raman spectea of solid samples are often acquired by filling a small
cavity with the sample after it has been ground to a fine powder.Polymers can
usually be examined directly with no sample pretreatment.
iii. Gas samples:Gas are normally contain in glass tubes,1-2 cm in diameter and about
1mm thick.Gases can also be sealed in small capillary tubes.
3.Raman spectrometers
 Raman spectrometers were similar in design and used the same type of
components as the classical Ultraviolet/visible dispersing instruments.
 Most employed double grating systems to minimize the spurious radiation
reaching the transducer.Photomultipliers served as transducers.
 Now Raman spectrometers being marketed are either fourier transform
instruments equipped with cooled germanium transducers or multichannel
instruments based upon charge-coupled devices.
The advantages of using laser
1.We do not need to cool the sample and need not use filter to get monochromatic
beam of radiation.
2.Raman spectra can be recorded by using small amount of analyte.
3.Second order raman spectra can be recorded.
4.The polarization of laser beam is well defined and may be controlled within 0.1%.
5.Brodening due to Doppler effect can be minimized.
6.As width of laser line is of the order of 0.005 cm or less, a precise information could
be obtained.
The emitted radiation is of three types:
1.Stokes scattering
2.Anti-stokes scattering
3.Rayleigh scattering
 A series of displaced lines with slightly different frequencies on both sides of
central line.This phenomenon of scattering with modified frequency is called
as Raman scattering.
 The lines in Raman scattering are frequently arranged symmetrically on both
sides of the Rayleigh line.The frequency shift Δυ occurs when some of the
energy of the scattered photon is taken up by a molecule,which is excited
into vibrational motion.
 The lines of frequency less than that of Rayleigh line(υ < υ’)are called as
Stoke’s lines.
 The lines with frequency greater than Rayleigh line(υ > υ’)are called as anti-
stoke’s lines.
DIFFERENT TYPES OF RAMAN SPECTROSCOPY
Resonance Raman Spectroscopy (RRS)
Surface-enhanced Raman Spectroscopy (SERS)
Micro-Raman Spectroscopy
Nonlimear Raman Spectroscopic techniques
Resonance Raman Spectroscopy
• Resonance Raman scattering refers to a phenomenon in which Raman line
intensities are greatly enhanced by excitation with wavelengths that closely
approach that of an electronic absorption peak of an analyte.
• Under this circumstance,the magnetudes of Raman peaks associated with the
most symmetric vibrations re enhanced by a factor of 10^2 to 10^6.
•As a consequence, resonance Raman spectra have been obtained at analyte
concentrations as low as 10^-8M.
•The most important application of resonance Raman spectroscopy has been to
the study of biological molecules under physiologically significant conditions;that
is,in the presence of water and at low to moderate concentration levels.
•As an example,the technique has been used to determine the oxidation state
and spin of iron atoms in hemoglobin and cytochrome-c.
Surface-Enhanced Raman Spectroscopy(SERS)
 Surface enhanced Raman spectroscopy involves obtaining Raman spectra in the
usual way on samples that are adsorbed on the surface of colloidal metal
particles(usually silver,gold,or copper) or on roughened surfaces of pieces of these
metals.
 For reasons that are not fully understood,the Raman lines of the adsorbed molecule
are often enhancedby a factor of 10^3 to 10^6.
 When surface enhancement is combined with the resonance enhancement
tecqnique discussed in the previous section, the net increase in signal intensity is
roughly the product of the intensity produced by each of the techniques.
 Consequently,detection limits in the 10^-9 to 10^-12M range have been observed.
FOURIER TRANSFORM RAMAN SPECTROSCOPY
The Raman instrument can be on the same bench as the FTIR.
Often, a YAG:Nd3+laser (1064 nm)is used to excite the sample,
so that the excitation energy is lower than the absorption band energies
of organic systems.
Fluorescence is then minimized.
Instruments may be combined with
a microscope,or optical fiber,so that
scanning over a few(microns)of surface
area,and Raman mapping is easily
performed.
APPLICATION
• Raman spectroscopy is used in many varied fields-in fact,any application
where non-destructive,
Microscopic,Chemical analysis and imaging is required.
• Whether the goal is qualitative or quantitative data,Raman analysis can
provide keyinformation easily and quickly.
• It can be used to rapidly characterise the chemical composition and
structure of a sample,whether solid,liquid,gas,gel,slurry or powder.
• Raman spectra of organic species
Raman spectra are similar to infrared spectra in that thay have regions that are
useful for functional group detection and fingerprint regions that permit the
identification of specific compounds.
Raman spectra yield more information about certain types of organic compounds
than do their infrared counterparts.
•Quantitative applications
Raman spectra tend to be less cluttered with peaks than infrared spectra. As a
consequence,peak overlap in mixtures is less likely,and quantitative measurements
are simpler. In addition,Raman sampling devices are not subject to attack by
moisture,and small amounts of water in a sample do not interfere.
•Biological applications of Raman spectroscopy
Raman spectroscopy has been applied widely for the study of biological systems.
The advantages of his technique include the small sample requirement,the
minimal sensitivity toward interference by water,the spectral detail,and the
conformational and environmental sensitivity.
DIFFERENCE
RESULT
The light beam is made up of many waves of light,each with different frequencies
all propagating along the same path.
The results of a raman spectroscopy analysisare usually represented
graphicaly,with the intensity of the scattered light(y-axis)plotted against
the frequency of light (x-axis).
Also considered an indication of energy ,frequency is usually measured by a unit
known as the wavenumber,which is represented as reciprocal centimeters.
DISCUSSION AND CONCLUSION
Raman spectroscopy is one type of vibrational spectroscopy which
requires good understanding of the properties of light.
It provides a chemical “fingerprint”of the substance measured and is
therefore frequently used whenever unknown materials need to be
identified.
Near-infrared excitation is preferred for biomedical applications.
Recent optical fiber probe developments allow accurate real-time analysis.

Raman spectroscopy PPT.pdf

  • 1.
  • 2.
    Sr.No. Title PageNo. 1. Introduction 3 2. Background 4 3. Objective 5 4. Important 5 5. Methods and materials 6 6. Experimental details 9 7. Types 14 8. Application 19 9. Difference 21 10. Result 22 11. Discussion and conclusion 23 INDEX
  • 3.
    INTRODUCTION Raman spectroscopy wasdiscovered by C.V.Raman in 1928 It is a spectroscopic technique used to observe vibration, rotational and other low-frequency modes in a system. Raman spectroscopy is commonly used in chemistry to provide a fingerprint by which molecules can be identified. When the radiation pass through the transparent medium the species present scatter a fraction of the beam in all direction. Raman scattering result from the same type of the quantities vibration changed associate with IR spectra.
  • 4.
    In 1928,Sir Dr.C.V.Raman while studying scattering of light found that when a beam of monochromatic light was passed through organic liquid such as benzene,toluene,etc. the scattered light contained other frequencies in addition to that incident light.
  • 5.
    BACKGROUND Raman spectroscopy (namedafter indian physicist C.V.Raman)is a spectroscopic technique typically used. To determine vibrational modes of molecules, although Rotational and other low-frequency modes of systems may also be observed. The Raman effect was named afterone of its discoverers, The indian scientist C.V.Raman,who observed the effect in organic liquids in 1928 together with K.S.Krishnan. Raman won the Nobel prize in physics in 1930 for this discovery. The first observation of raman spectra in gases was in 1929. Raman spectroscopy was used to provide the first catlog of molecular vibrational frequencies.
  • 6.
    Objectives Raman spectroscopy isa non-destructive chemical analysis technique which provides detailed information about chemical structure,phase and polymorphy,crystallinity and molecular interactions.It is based upon the interaction of light with the chemical bonds within a material. IMPORTANT Raman spectroscopy can differentiate chemical structures,even if they contain the same atoms in different arrangements.Analyse your sample multiple times without damage.If you can use an optical microscope to focus onto the analysis region,you can use a raman microscope to collect its Raman spectrum.
  • 7.
    METHOD AND MATERIALS Instrumentationfor modern Raman spectroscopy consists of three components: • Laser sourse • Sample illumination system • Suitable spectrometer
  • 9.
    1.SOURCE: • The sourcesused in modern Raman spectrometry are nearly always lasers because their high intensity is necessary to produce Raman scattering of sufficient intensity to be measured with a reasonable signal-to-noise ratio. • Because the intensity of Raman scattering varies as the fourth power of the frequency,argon and krypton ion sources that emit in the blue and green region of the spectrum have and advantage over the other sources.
  • 10.
    Some common lasersourses for Raman spectroscopy Laser Type Wavelengh,nm Argon ion 488.0 OR 514.5 Krypton ion 530.9 OR 647.1 Helium-neon 632.8 Diode 785 or 830 Nd-YAG 1064 Source used now a days are laser because high intensity is necessary to produce Raman scattering.
  • 11.
    2.Sample illumination system i.Liquid samples: A major advantage of sample handling in Raman spectroscopy compared with Infrared arises because water is a weak Raman Scattered but a strong absorber of infrared radiation.Thus,aqueous solutions can be studied by Raman spectroscopy but not by infrared. This advantage is particularly important for biological and inorganic systems and in studies dealing with water pollution problems. ii. Solid samples:Raman spectea of solid samples are often acquired by filling a small cavity with the sample after it has been ground to a fine powder.Polymers can usually be examined directly with no sample pretreatment. iii. Gas samples:Gas are normally contain in glass tubes,1-2 cm in diameter and about 1mm thick.Gases can also be sealed in small capillary tubes.
  • 12.
    3.Raman spectrometers  Ramanspectrometers were similar in design and used the same type of components as the classical Ultraviolet/visible dispersing instruments.  Most employed double grating systems to minimize the spurious radiation reaching the transducer.Photomultipliers served as transducers.  Now Raman spectrometers being marketed are either fourier transform instruments equipped with cooled germanium transducers or multichannel instruments based upon charge-coupled devices.
  • 13.
    The advantages ofusing laser 1.We do not need to cool the sample and need not use filter to get monochromatic beam of radiation. 2.Raman spectra can be recorded by using small amount of analyte. 3.Second order raman spectra can be recorded. 4.The polarization of laser beam is well defined and may be controlled within 0.1%. 5.Brodening due to Doppler effect can be minimized. 6.As width of laser line is of the order of 0.005 cm or less, a precise information could be obtained.
  • 14.
    The emitted radiationis of three types: 1.Stokes scattering 2.Anti-stokes scattering 3.Rayleigh scattering
  • 15.
     A seriesof displaced lines with slightly different frequencies on both sides of central line.This phenomenon of scattering with modified frequency is called as Raman scattering.  The lines in Raman scattering are frequently arranged symmetrically on both sides of the Rayleigh line.The frequency shift Δυ occurs when some of the energy of the scattered photon is taken up by a molecule,which is excited into vibrational motion.  The lines of frequency less than that of Rayleigh line(υ < υ’)are called as Stoke’s lines.  The lines with frequency greater than Rayleigh line(υ > υ’)are called as anti- stoke’s lines.
  • 16.
    DIFFERENT TYPES OFRAMAN SPECTROSCOPY Resonance Raman Spectroscopy (RRS) Surface-enhanced Raman Spectroscopy (SERS) Micro-Raman Spectroscopy Nonlimear Raman Spectroscopic techniques
  • 17.
    Resonance Raman Spectroscopy •Resonance Raman scattering refers to a phenomenon in which Raman line intensities are greatly enhanced by excitation with wavelengths that closely approach that of an electronic absorption peak of an analyte. • Under this circumstance,the magnetudes of Raman peaks associated with the most symmetric vibrations re enhanced by a factor of 10^2 to 10^6. •As a consequence, resonance Raman spectra have been obtained at analyte concentrations as low as 10^-8M. •The most important application of resonance Raman spectroscopy has been to the study of biological molecules under physiologically significant conditions;that is,in the presence of water and at low to moderate concentration levels. •As an example,the technique has been used to determine the oxidation state and spin of iron atoms in hemoglobin and cytochrome-c.
  • 19.
    Surface-Enhanced Raman Spectroscopy(SERS) Surface enhanced Raman spectroscopy involves obtaining Raman spectra in the usual way on samples that are adsorbed on the surface of colloidal metal particles(usually silver,gold,or copper) or on roughened surfaces of pieces of these metals.  For reasons that are not fully understood,the Raman lines of the adsorbed molecule are often enhancedby a factor of 10^3 to 10^6.  When surface enhancement is combined with the resonance enhancement tecqnique discussed in the previous section, the net increase in signal intensity is roughly the product of the intensity produced by each of the techniques.  Consequently,detection limits in the 10^-9 to 10^-12M range have been observed.
  • 20.
    FOURIER TRANSFORM RAMANSPECTROSCOPY The Raman instrument can be on the same bench as the FTIR. Often, a YAG:Nd3+laser (1064 nm)is used to excite the sample, so that the excitation energy is lower than the absorption band energies of organic systems. Fluorescence is then minimized. Instruments may be combined with a microscope,or optical fiber,so that scanning over a few(microns)of surface area,and Raman mapping is easily performed.
  • 21.
    APPLICATION • Raman spectroscopyis used in many varied fields-in fact,any application where non-destructive, Microscopic,Chemical analysis and imaging is required. • Whether the goal is qualitative or quantitative data,Raman analysis can provide keyinformation easily and quickly. • It can be used to rapidly characterise the chemical composition and structure of a sample,whether solid,liquid,gas,gel,slurry or powder. • Raman spectra of organic species Raman spectra are similar to infrared spectra in that thay have regions that are useful for functional group detection and fingerprint regions that permit the identification of specific compounds. Raman spectra yield more information about certain types of organic compounds than do their infrared counterparts.
  • 22.
    •Quantitative applications Raman spectratend to be less cluttered with peaks than infrared spectra. As a consequence,peak overlap in mixtures is less likely,and quantitative measurements are simpler. In addition,Raman sampling devices are not subject to attack by moisture,and small amounts of water in a sample do not interfere. •Biological applications of Raman spectroscopy Raman spectroscopy has been applied widely for the study of biological systems. The advantages of his technique include the small sample requirement,the minimal sensitivity toward interference by water,the spectral detail,and the conformational and environmental sensitivity.
  • 23.
  • 24.
    RESULT The light beamis made up of many waves of light,each with different frequencies all propagating along the same path. The results of a raman spectroscopy analysisare usually represented graphicaly,with the intensity of the scattered light(y-axis)plotted against the frequency of light (x-axis). Also considered an indication of energy ,frequency is usually measured by a unit known as the wavenumber,which is represented as reciprocal centimeters.
  • 25.
    DISCUSSION AND CONCLUSION Ramanspectroscopy is one type of vibrational spectroscopy which requires good understanding of the properties of light. It provides a chemical “fingerprint”of the substance measured and is therefore frequently used whenever unknown materials need to be identified. Near-infrared excitation is preferred for biomedical applications. Recent optical fiber probe developments allow accurate real-time analysis.