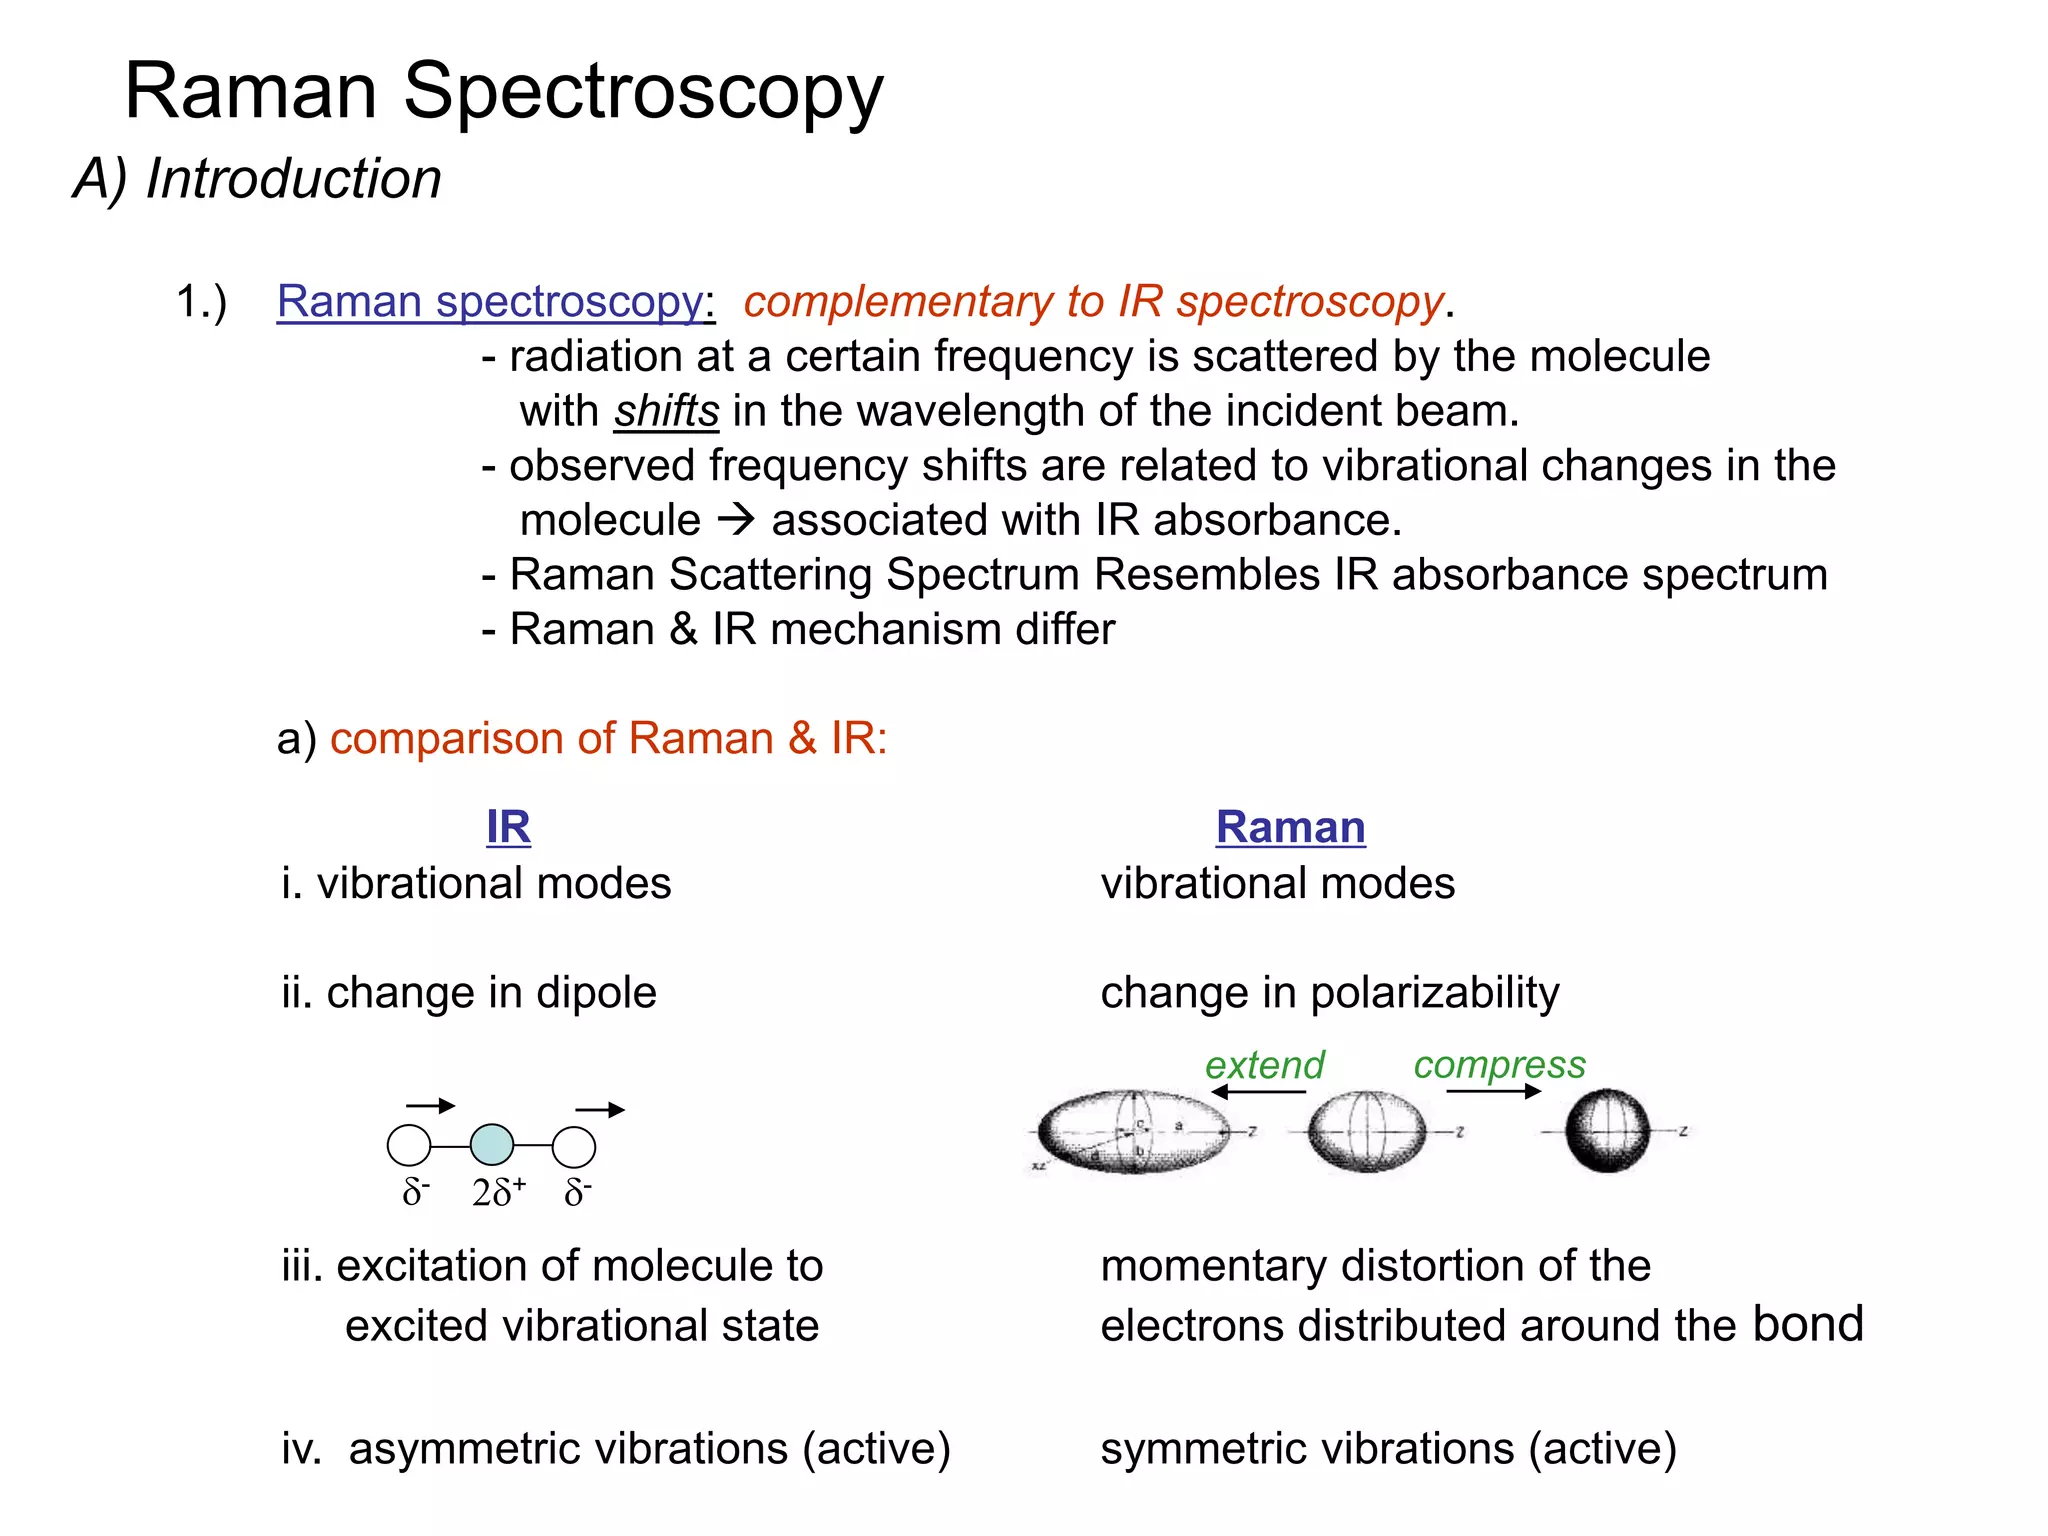
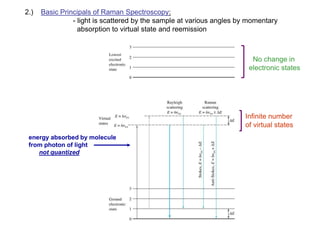
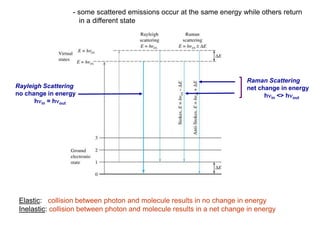
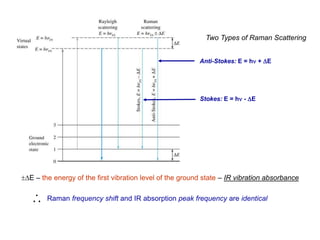
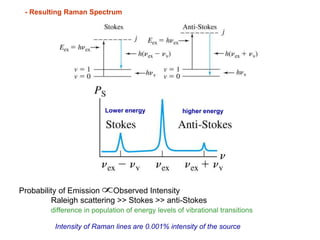
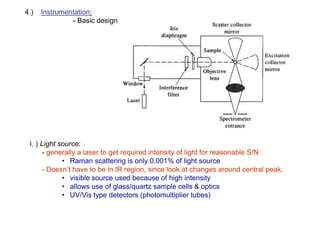
Raman Spectroscopy
A) Introduction
1.) Raman spectroscopy: complementary to IR spectroscopy.
- radiation at a certain frequency is scattered by the molecule
with shifts in the wavelength of the incident beam.
- observed frequency shifts are related to vibrational changes in the
molecule  associated with IR absorbance.
- Raman Scattering Spectrum Resembles IR absorbance spectrum
- Raman & IR mechanism differ
a) comparison of Raman & IR:
IR Raman
i. vibrational modes vibrational modes
ii. change in dipole change in polarizability
iii. excitation of molecule to momentary distortion of the
excited vibrational state electrons distributed around the bond
iv. asymmetric vibrations (active) symmetric vibrations (active)
d- 2d+ d-
extend compress
2.) Basic Principals of Raman Spectroscopy:
- light is scattered by the sample at various angles by momentary
absorption to virtual state and reemission
energy absorbed by molecule
from photon of light
not quantized
No change in
electronic states
Infinite number
of virtual states
- some scattered emissions occur at the same energy while others return
in a different state
Rayleigh Scattering
no change in energy
hnin = hnout
Elastic: collision between photon and molecule results in no change in energy
Inelastic: collision between photon and molecule results in a net change in energy
Raman Scattering
net change in energy
hnin <> hnout
Anti-Stokes: E = hn + DE
Two Types of Raman Scattering
Stokes: E = hn - DE
DE – the energy of the first vibration level of the ground state – IR vibration absorbance
Raman frequency shift and IR absorption peak frequency are identical
- Resulting Raman Spectrum
Probability of Emission Observed Intensity
Raleigh scattering >> Stokes >> anti-Stokes
difference in population of energy levels of vibrational transitions
Intensity of Raman lines are 0.001% intensity of the source
Lower energy higher energy

3.) Active Raman Vibrations:
- need change in polarizability of molecule during vibration
- polarizability related to electron cloud distribution
example:
O = C = O IR inactive
Raman active
O = C = O IR active
Raman inactive
IR & Raman are complimentary. Can be cases where vibration is both IR & Raman
active (eg. SO2 – non-linear molecule)
In general:
IR tends to emphasize polar functional groups (R-OH, , etc.)
Raman emphasizes aromatic & carbon backbone (C=C, -CH2-, etc.)
- Raman does not “see” many common polar solvents can
use with aqueous samples – advantage over IR
C
O
Raman frequency range: 4000 -50 cm-1(Stokes and anti-stokes)
- comparison of Raman and IR Spectra
4.) Instrumentation:
- Basic design
i. ) Light source:
- generally a laser to get required intensity of light for reasonable S/N
• Raman scattering is only 0.001% of light source
- Doesn’t have to be in IR region, since look at changes around central peak.
• visible source used because of high intensity
• allows use of glass/quartz sample cells & optics
• UV/Vis type detectors (photomultiplier tubes)
4.) Applications:
a) Qualitative Information
i. characteristic regions for different groups as in IR
ii. Raman correlation charts available
iii. Good for aqueous based samples
iv. Useful for a variety of samples, organic, inorganic & biological
b) Quantitative Information – not routinely used
i. fewer technical problems than IR, fewer peaks
ii. Interference from fluorescence
iii. Higher cost
iii. Signal weak – require modified Raman methods
1) Resonance Raman spectroscopy allows detection
of 10-3 ->10-7M by using lasers light with
wavelength approaching electronic absorption
2) Surface enhanced Raman spectroscopy places
samples on metal or rough surfaces that increase
Raman scattering

Raman Spectroscopy

  • 1.
    Raman Spectroscopy A) Introduction 1.)Raman spectroscopy: complementary to IR spectroscopy. - radiation at a certain frequency is scattered by the molecule with shifts in the wavelength of the incident beam. - observed frequency shifts are related to vibrational changes in the molecule  associated with IR absorbance. - Raman Scattering Spectrum Resembles IR absorbance spectrum - Raman & IR mechanism differ a) comparison of Raman & IR: IR Raman i. vibrational modes vibrational modes ii. change in dipole change in polarizability iii. excitation of molecule to momentary distortion of the excited vibrational state electrons distributed around the bond iv. asymmetric vibrations (active) symmetric vibrations (active) d- 2d+ d- extend compress
  • 2.
    2.) Basic Principalsof Raman Spectroscopy: - light is scattered by the sample at various angles by momentary absorption to virtual state and reemission energy absorbed by molecule from photon of light not quantized No change in electronic states Infinite number of virtual states
  • 3.
    - some scatteredemissions occur at the same energy while others return in a different state Rayleigh Scattering no change in energy hnin = hnout Elastic: collision between photon and molecule results in no change in energy Inelastic: collision between photon and molecule results in a net change in energy Raman Scattering net change in energy hnin <> hnout
  • 4.
    Anti-Stokes: E =hn + DE Two Types of Raman Scattering Stokes: E = hn - DE DE – the energy of the first vibration level of the ground state – IR vibration absorbance Raman frequency shift and IR absorption peak frequency are identical
  • 5.
    - Resulting RamanSpectrum Probability of Emission Observed Intensity Raleigh scattering >> Stokes >> anti-Stokes difference in population of energy levels of vibrational transitions Intensity of Raman lines are 0.001% intensity of the source Lower energy higher energy 
  • 6.
    3.) Active RamanVibrations: - need change in polarizability of molecule during vibration - polarizability related to electron cloud distribution example: O = C = O IR inactive Raman active O = C = O IR active Raman inactive IR & Raman are complimentary. Can be cases where vibration is both IR & Raman active (eg. SO2 – non-linear molecule) In general: IR tends to emphasize polar functional groups (R-OH, , etc.) Raman emphasizes aromatic & carbon backbone (C=C, -CH2-, etc.) - Raman does not “see” many common polar solvents can use with aqueous samples – advantage over IR C O Raman frequency range: 4000 -50 cm-1(Stokes and anti-stokes)
  • 7.
    - comparison ofRaman and IR Spectra
  • 8.
    4.) Instrumentation: - Basicdesign i. ) Light source: - generally a laser to get required intensity of light for reasonable S/N • Raman scattering is only 0.001% of light source - Doesn’t have to be in IR region, since look at changes around central peak. • visible source used because of high intensity • allows use of glass/quartz sample cells & optics • UV/Vis type detectors (photomultiplier tubes)
  • 9.
    4.) Applications: a) QualitativeInformation i. characteristic regions for different groups as in IR ii. Raman correlation charts available iii. Good for aqueous based samples iv. Useful for a variety of samples, organic, inorganic & biological b) Quantitative Information – not routinely used i. fewer technical problems than IR, fewer peaks ii. Interference from fluorescence iii. Higher cost iii. Signal weak – require modified Raman methods 1) Resonance Raman spectroscopy allows detection of 10-3 ->10-7M by using lasers light with wavelength approaching electronic absorption 2) Surface enhanced Raman spectroscopy places samples on metal or rough surfaces that increase Raman scattering