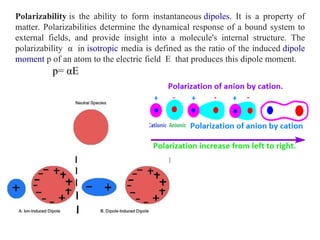
Polarizability is theability to form instantaneous dipoles. It is a property of
matter. Polarizabilities determine the dynamical response of a bound system to
external fields, and provide insight into a molecule's internal structure. The
polarizability α in isotropic media is defined as the ratio of the induced dipole
moment p of an atom to the electric field E that produces this dipole moment.
p= αE
4.
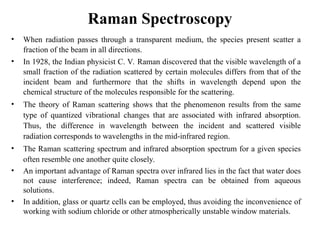
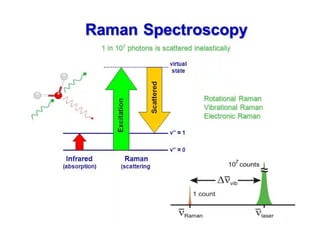
Raman Spectroscopy
• Whenradiation passes through a transparent medium, the species present scatter a
fraction of the beam in all directions.
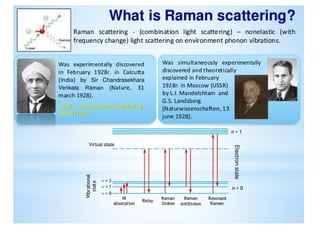
• In 1928, the Indian physicist C. V. Raman discovered that the visible wavelength of a
small fraction of the radiation scattered by certain molecules differs from that of the
incident beam and furthermore that the shifts in wavelength depend upon the
chemical structure of the molecules responsible for the scattering.
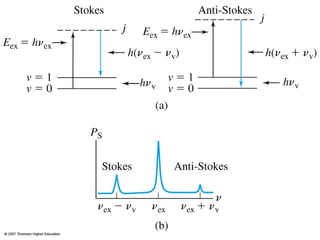
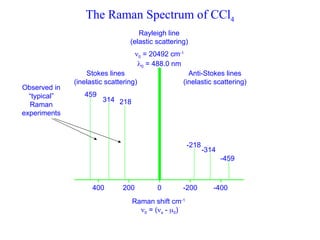
• The theory of Raman scattering shows that the phenomenon results from the same
type of quantized vibrational changes that are associated with infrared absorption.
Thus, the difference in wavelength between the incident and scattered visible
radiation corresponds to wavelengths in the mid-infrared region.
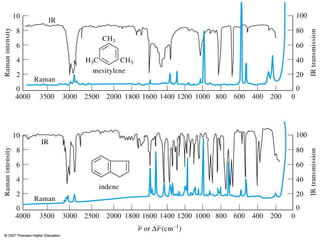
• The Raman scattering spectrum and infrared absorption spectrum for a given species
often resemble one another quite closely.
• An important advantage of Raman spectra over infrared lies in the fact that water does
not cause interference; indeed, Raman spectra can be obtained from aqueous
solutions.
• In addition, glass or quartz cells can be employed, thus avoiding the inconvenience of
working with sodium chloride or other atmospherically unstable window materials.
5.
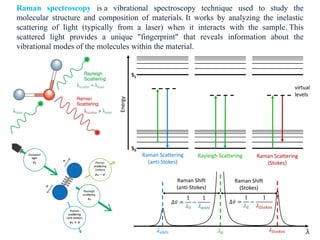
Raman spectroscopy isa vibrational spectroscopy technique used to study the
molecular structure and composition of materials. It works by analyzing the inelastic
scattering of light (typically from a laser) when it interacts with the sample. This
scattered light provides a unique "fingerprint" that reveals information about the
vibrational modes of the molecules within the material.
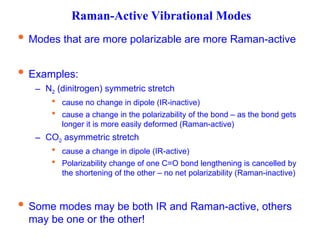
Raman-Active Vibrational Modes
Modes that are more polarizable are more Raman-active
Examples:
– N2 (dinitrogen) symmetric stretch
cause no change in dipole (IR-inactive)
cause a change in the polarizability of the bond – as the bond gets
longer it is more easily deformed (Raman-active)
– CO2 asymmetric stretch
cause a change in dipole (IR-active)
Polarizability change of one C=O bond lengthening is cancelled by
the shortening of the other – no net polarizability (Raman-inactive)
Some modes may be both IR and Raman-active, others
may be one or the other!
11.
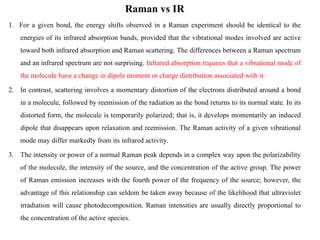
Raman vs IR
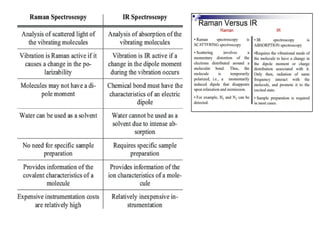
1.For a given bond, the energy shifts observed in a Raman experiment should be identical to the
energies of its infrared absorption bands, provided that the vibrational modes involved are active
toward both infrared absorption and Raman scattering. The differences between a Raman spectrum
and an infrared spectrum are not surprising. Infrared absorption requires that a vibrational mode of
the molecule have a change in dipole moment or charge distribution associated with it.
2. In contrast, scattering involves a momentary distortion of the electrons distributed around a bond
in a molecule, followed by reemission of the radiation as the bond returns to its normal state. In its
distorted form, the molecule is temporarily polarized; that is, it develops momentarily an induced
dipole that disappears upon relaxation and reemission. The Raman activity of a given vibrational
mode may differ markedly from its infrared activity.
3. The intensity or power of a normal Raman peak depends in a complex way upon the polarizability
of the molecule, the intensity of the source, and the concentration of the active group. The power
of Raman emission increases with the fourth power of the frequency of the source; however, the
advantage of this relationship can seldom be taken away because of the likelihood that ultraviolet
irradiation will cause photodecomposition. Raman intensities are usually directly proportional to
the concentration of the active species.
13.
Sample Illumination System
Samplehandling for Raman spectroscopic measurements is simpler than for infrared spectroscopy
because glass can be used for windows, lenses, and other optical components instead of the more
fragile and atmospherically less stable crystalline halides. In addition, the laser source is easily
focused on a small sample area and the emitted radiation efficiently focused on a slit.
Consequently, very small samples can be investigated. A common sample holder for
nonabsorbing liquid samples is an ordinary glass melting-point capillary.
• Liquid Samples: A major advantage of sample handling in Raman spectroscopy compared with
infrared arises because water is a weak Raman scatterer but a strong absorber of infrared radiation.
Thus, aqueous solutions can be studied by Raman spectroscopy but not by infrared. This
advantage is particularly important for biological and inorganic systems and in studies dealing
with water pollution problems.
• Solid Samples: Raman spectra of solid samples are often acquired by filling a small cavity with
the sample after it has been ground to a fine powder. Polymers can usually be examined directly
with no sample pretreatment.
14.
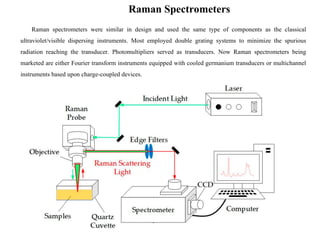
Raman Spectrometers
Raman spectrometerswere similar in design and used the same type of components as the classical
ultraviolet/visible dispersing instruments. Most employed double grating systems to minimize the spurious
radiation reaching the transducer. Photomultipliers served as transducers. Now Raman spectrometers being
marketed are either Fourier transform instruments equipped with cooled germanium transducers or multichannel
instruments based upon charge-coupled devices.
16.
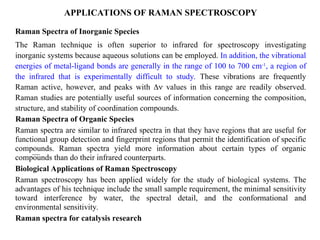
APPLICATIONS OF RAMANSPECTROSCOPY
Raman Spectra of Inorganic Species
The Raman technique is often superior to infrared for spectroscopy investigating
inorganic systems because aqueous solutions can be employed. In addition, the vibrational
energies of metal-ligand bonds are generally in the range of 100 to 700 cm-1
, a region of
the infrared that is experimentally difficult to study. These vibrations are frequently
Raman active, however, and peaks with values in this range are readily observed.
Raman studies are potentially useful sources of information concerning the composition,
structure, and stability of coordination compounds.
Raman Spectra of Organic Species
Raman spectra are similar to infrared spectra in that they have regions that are useful for
functional group detection and fingerprint regions that permit the identification of specific
compounds. Raman spectra yield more information about certain types of organic
compounds than do their infrared counterparts.
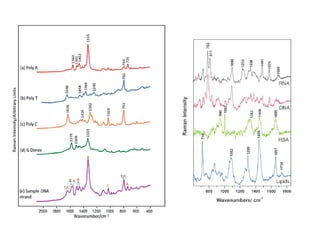
Biological Applications of Raman Spectroscopy
Raman spectroscopy has been applied widely for the study of biological systems. The
advantages of his technique include the small sample requirement, the minimal sensitivity
toward interference by water, the spectral detail, and the conformational and
environmental sensitivity.
Raman spectra for catalysis research
17.
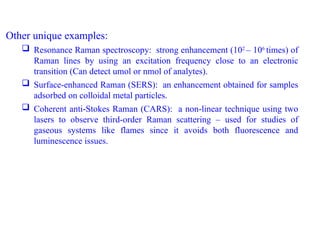
Other unique examples:
Resonance Raman spectroscopy: strong enhancement (102
– 106
times) of
Raman lines by using an excitation frequency close to an electronic
transition (Can detect umol or nmol of analytes).
Surface-enhanced Raman (SERS): an enhancement obtained for samples
adsorbed on colloidal metal particles.
Coherent anti-Stokes Raman (CARS): a non-linear technique using two
lasers to observe third-order Raman scattering – used for studies of
gaseous systems like flames since it avoids both fluorescence and
luminescence issues.
19.
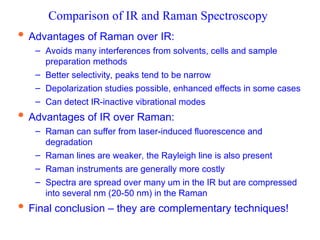
Comparison of IRand Raman Spectroscopy
Advantages of Raman over IR:
– Avoids many interferences from solvents, cells and sample
preparation methods
– Better selectivity, peaks tend to be narrow
– Depolarization studies possible, enhanced effects in some cases
– Can detect IR-inactive vibrational modes
Advantages of IR over Raman:
– Raman can suffer from laser-induced fluorescence and
degradation
– Raman lines are weaker, the Rayleigh line is also present
– Raman instruments are generally more costly
– Spectra are spread over many um in the IR but are compressed
into several nm (20-50 nm) in the Raman
Final conclusion – they are complementary techniques!
20.
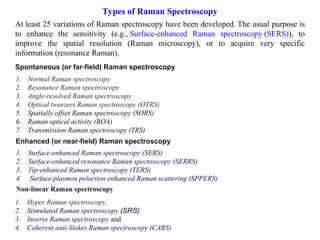
Types of RamanSpectroscopy
At least 25 variations of Raman spectroscopy have been developed. The usual purpose is
to enhance the sensitivity (e.g., Surface-enhanced Raman spectroscopy (SERS)), to
improve the spatial resolution (Raman microscopy), or to acquire very specific
information (resonance Raman).
1. Normal Raman spectroscopy
2. Resonance Raman spectroscopy
3. Angle-resolved Raman spectroscopy
4. Optical tweezers Raman spectroscopy (OTRS)
5. Spatially offset Raman spectroscopy (SORS)
6. Raman optical activity (ROA)
7. Transmission Raman spectroscopy (TRS)
Spontaneous (or far-field) Raman spectroscopy
Enhanced (or near-field) Raman spectroscopy
1. Surface-enhanced Raman spectroscopy (SERS)
2. Surface-enhanced resonance Raman spectroscopy (SERRS)
3. Tip-enhanced Raman spectroscopy (TERS)
4. Surface plasmon polariton enhanced Raman scattering (SPPERS)
Non-linear Raman spectroscopy
1. Hyper Raman spectroscopy,
2. Stimulated Raman spectroscopy (SRS)
3. Inverse Raman spectroscopy and
4. Coherent anti-Stokes Raman spectroscopy (CARS)
21.
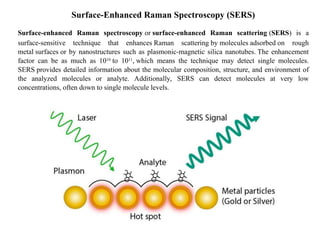
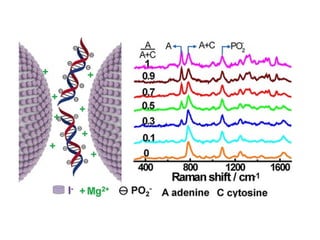
Surface-Enhanced Raman Spectroscopy(SERS)
Surface-enhanced Raman spectroscopy or surface-enhanced Raman scattering (SERS) is a
surface-sensitive technique that enhances Raman scattering by molecules adsorbed on rough
metal surfaces or by nanostructures such as plasmonic-magnetic silica nanotubes. The enhancement
factor can be as much as 1010
to 1011
, which means the technique may detect single molecules.
SERS provides detailed information about the molecular composition, structure, and environment of
the analyzed molecules or analyte. Additionally, SERS can detect molecules at very low
concentrations, often down to single molecule levels.
24.
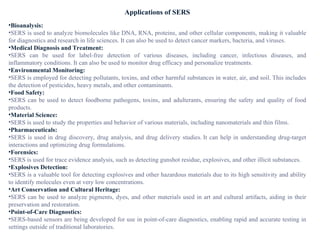
Applications of SERS
•Bioanalysis:
•SERSis used to analyze biomolecules like DNA, RNA, proteins, and other cellular components, making it valuable
for diagnostics and research in life sciences. It can also be used to detect cancer markers, bacteria, and viruses.
•Medical Diagnosis and Treatment:
•SERS can be used for label-free detection of various diseases, including cancer, infectious diseases, and
inflammatory conditions. It can also be used to monitor drug efficacy and personalize treatments.
•Environmental Monitoring:
•SERS is employed for detecting pollutants, toxins, and other harmful substances in water, air, and soil. This includes
the detection of pesticides, heavy metals, and other contaminants.
•Food Safety:
•SERS can be used to detect foodborne pathogens, toxins, and adulterants, ensuring the safety and quality of food
products.
•Material Science:
•SERS is used to study the properties and behavior of various materials, including nanomaterials and thin films.
•Pharmaceuticals:
•SERS is used in drug discovery, drug analysis, and drug delivery studies. It can help in understanding drug-target
interactions and optimizing drug formulations.
•Forensics:
•SERS is used for trace evidence analysis, such as detecting gunshot residue, explosives, and other illicit substances.
•Explosives Detection:
•SERS is a valuable tool for detecting explosives and other hazardous materials due to its high sensitivity and ability
to identify molecules even at very low concentrations.
•Art Conservation and Cultural Heritage:
•SERS can be used to analyze pigments, dyes, and other materials used in art and cultural artifacts, aiding in their
preservation and restoration.
•Point-of-Care Diagnostics:
•SERS-based sensors are being developed for use in point-of-care diagnostics, enabling rapid and accurate testing in
settings outside of traditional laboratories.
Editor's Notes
#10 Hard atoms have low polarizabilities. Molecular hardness is similar. When frontier orbitals (HOMO and LUMO) have small energy separations, they are easily distorted by an applied field and are called “soft”. Ex. a hard base has a low energy (Strongly bound) HOMO.