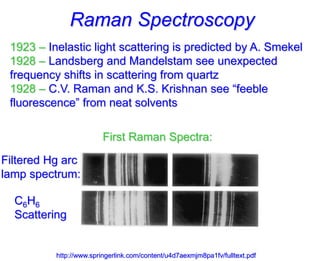
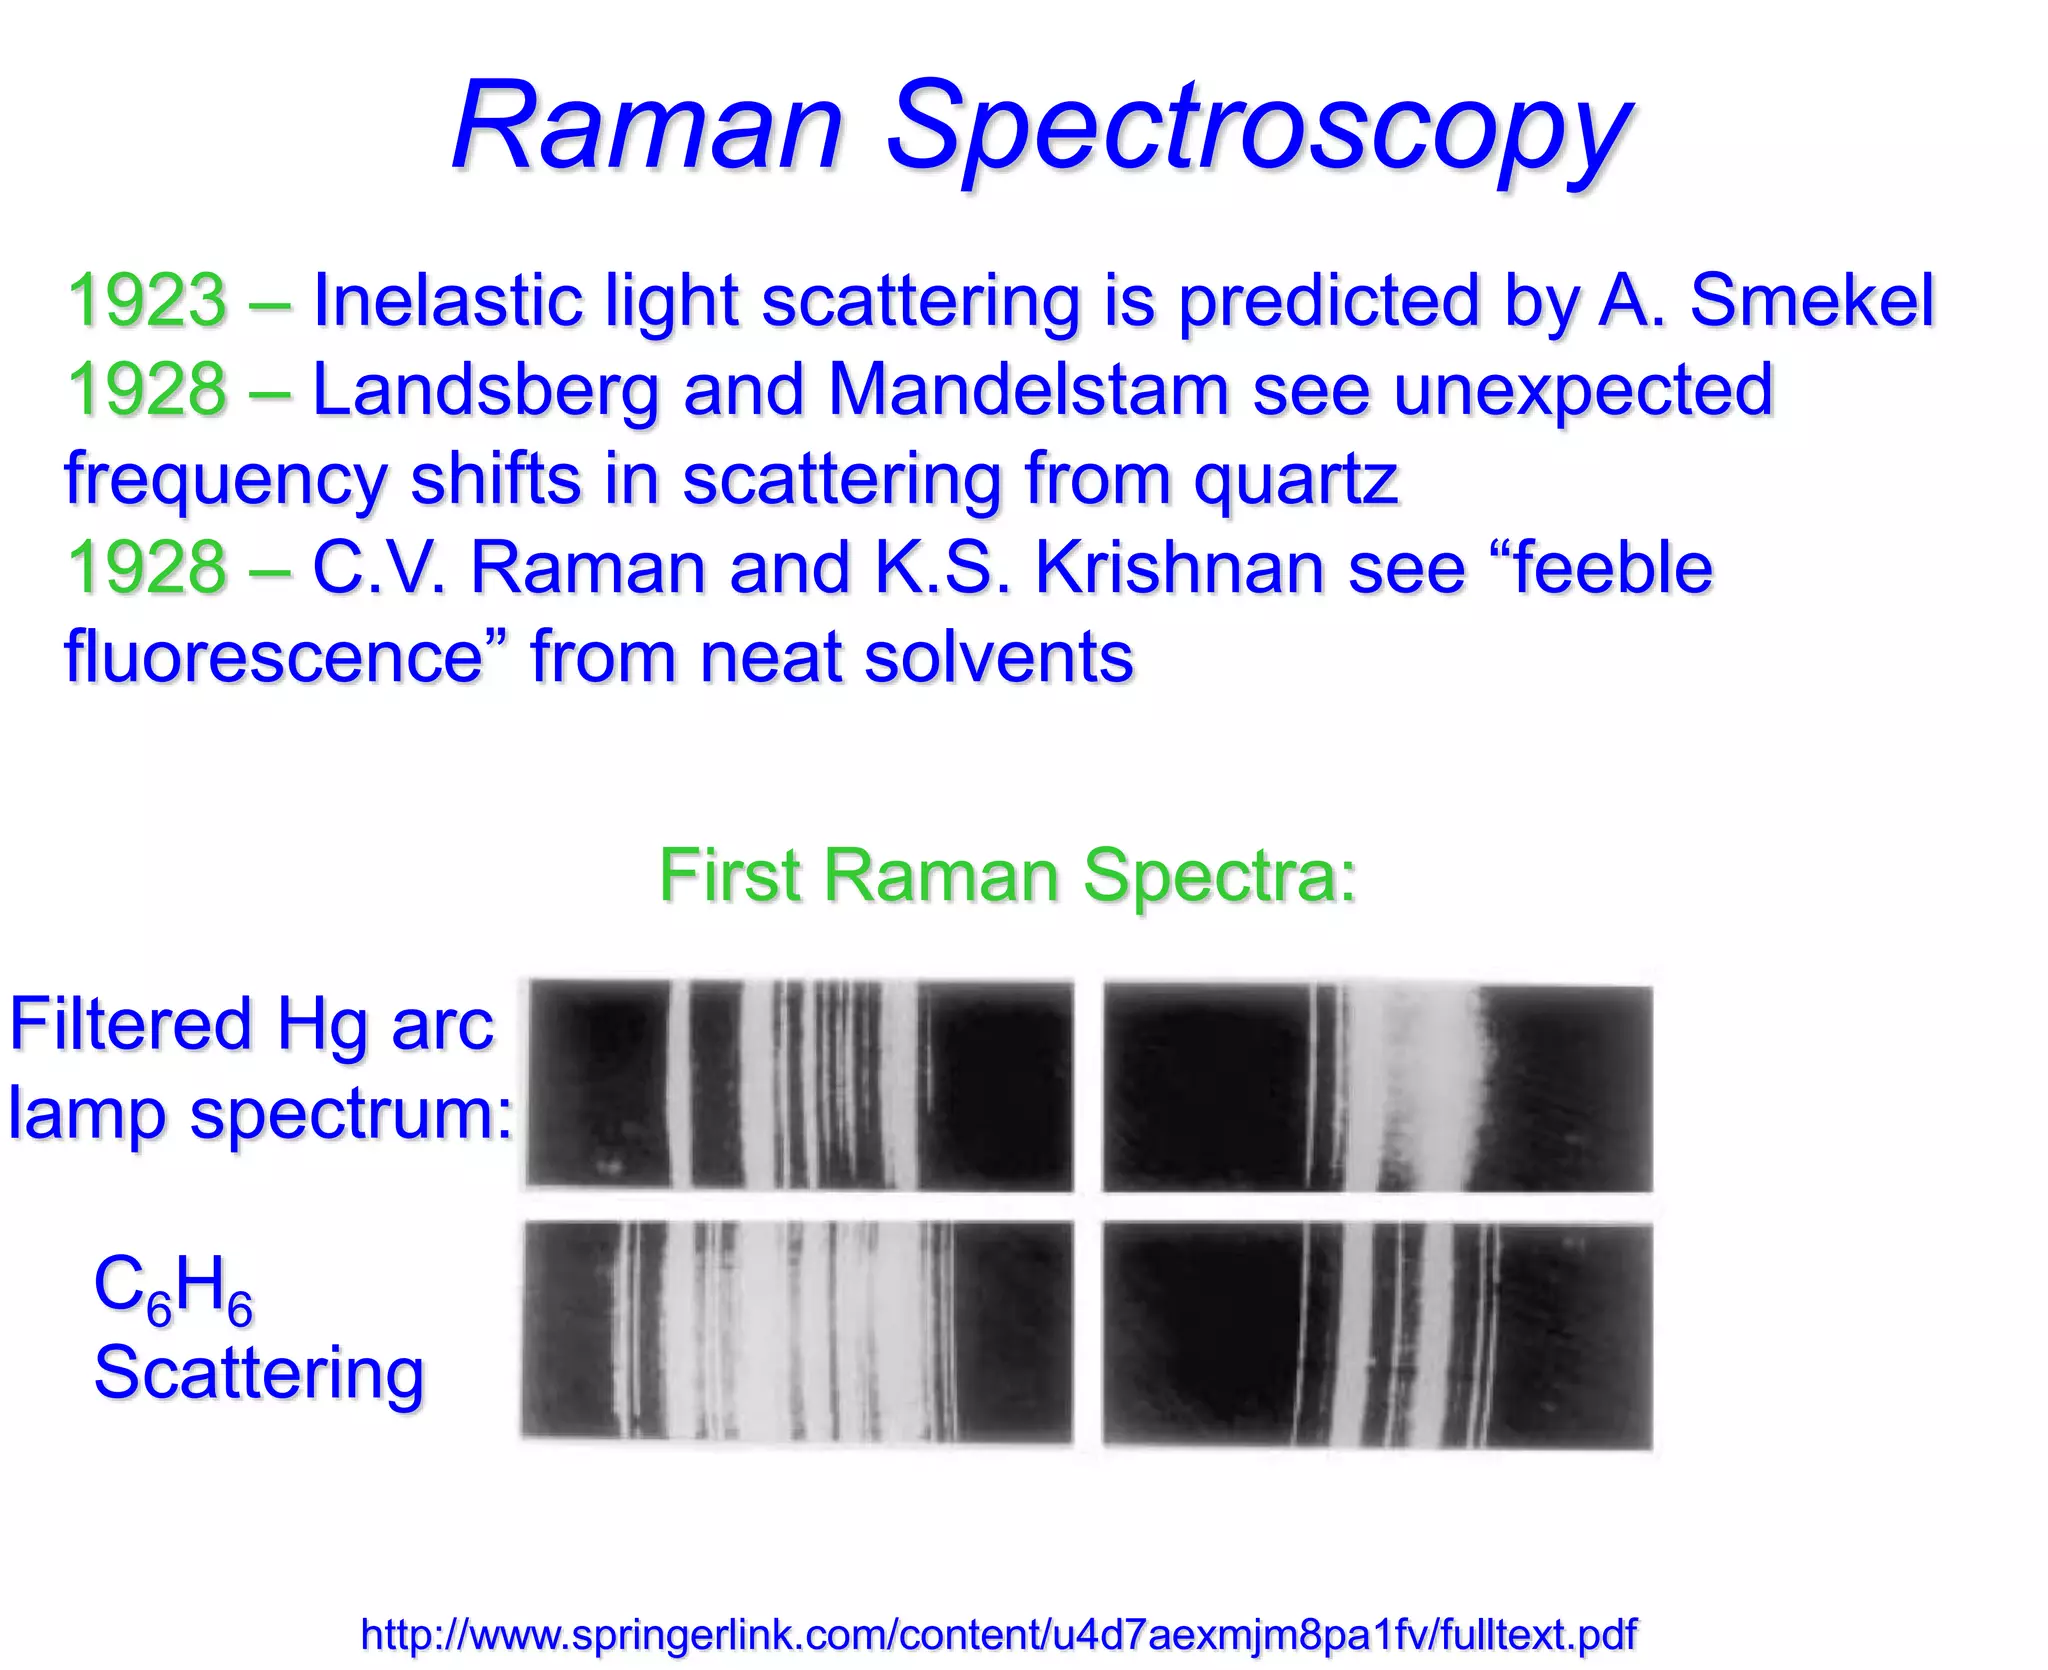
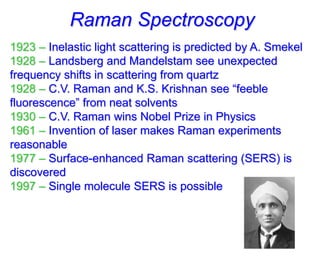
- Raman spectroscopy was first predicted in 1923 and observed experimentally in 1928 when unexpected frequency shifts were seen in light scattered from quartz and solvents.
- C.V. Raman won the Nobel Prize in 1930 for his work on observing and explaining the Raman effect. The invention of the laser in 1961 made Raman experiments more practical.
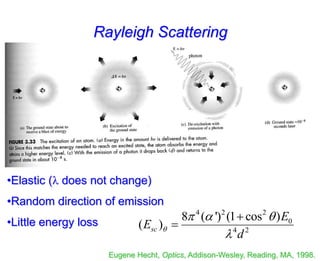
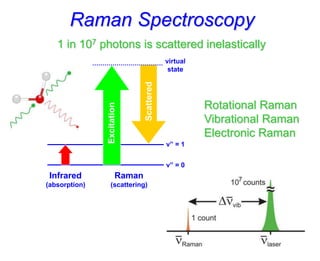
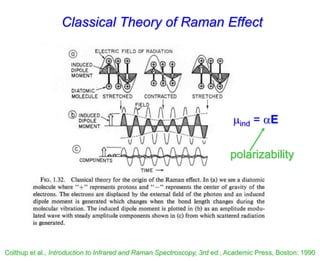
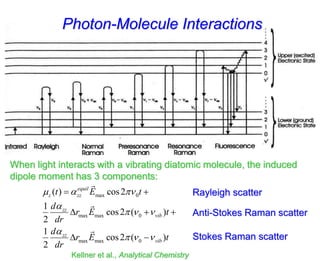
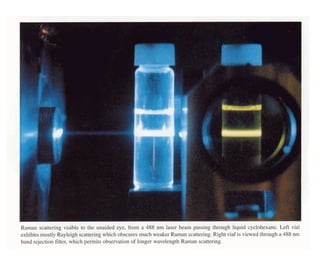
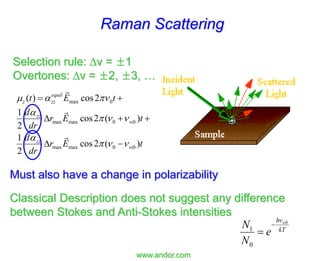
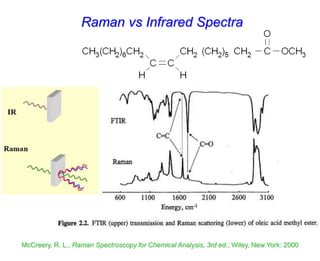
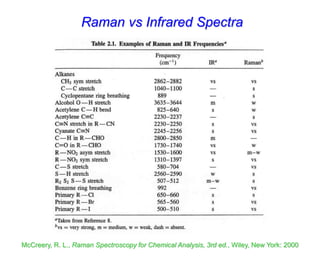
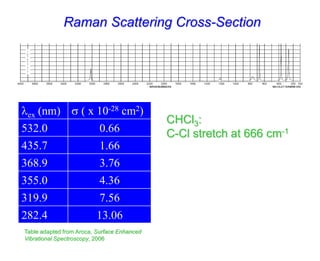
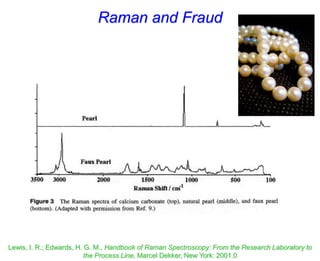
- Raman spectroscopy provides molecular vibration information through inelastic light scattering. It can be used to analyze a variety of samples including liquids and biological materials.