Downloaded 613 times

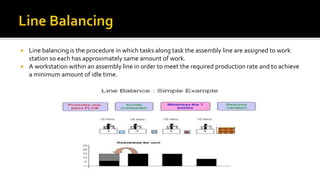
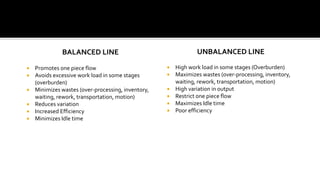
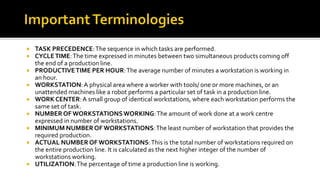
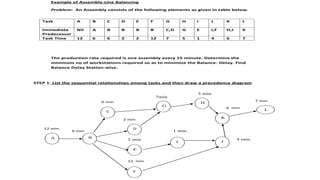
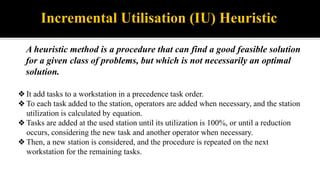

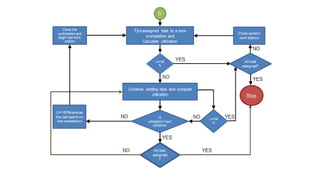
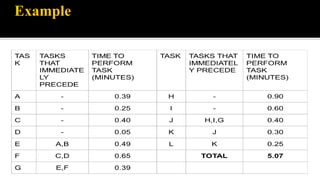
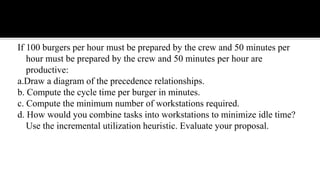
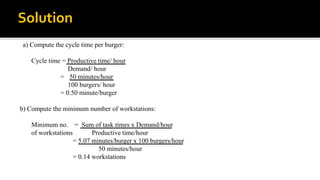
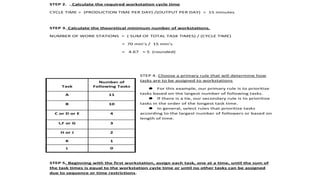
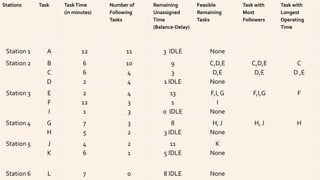
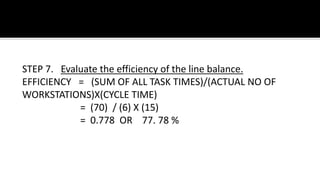
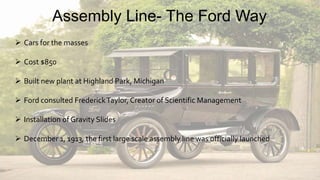


The document discusses line balancing in assembly lines, emphasizing task allocation to ensure equal workload across workstations and minimize idle time and waste, which leads to increased efficiency. It outlines key concepts such as cycle time, workstation utilization, and the incremental utilization heuristic to solve line-balancing problems. Additionally, examples from fast food operations and historical references to Ford's assembly line implementation illustrate the practical applications and benefits of line balancing.