Downloaded 126 times
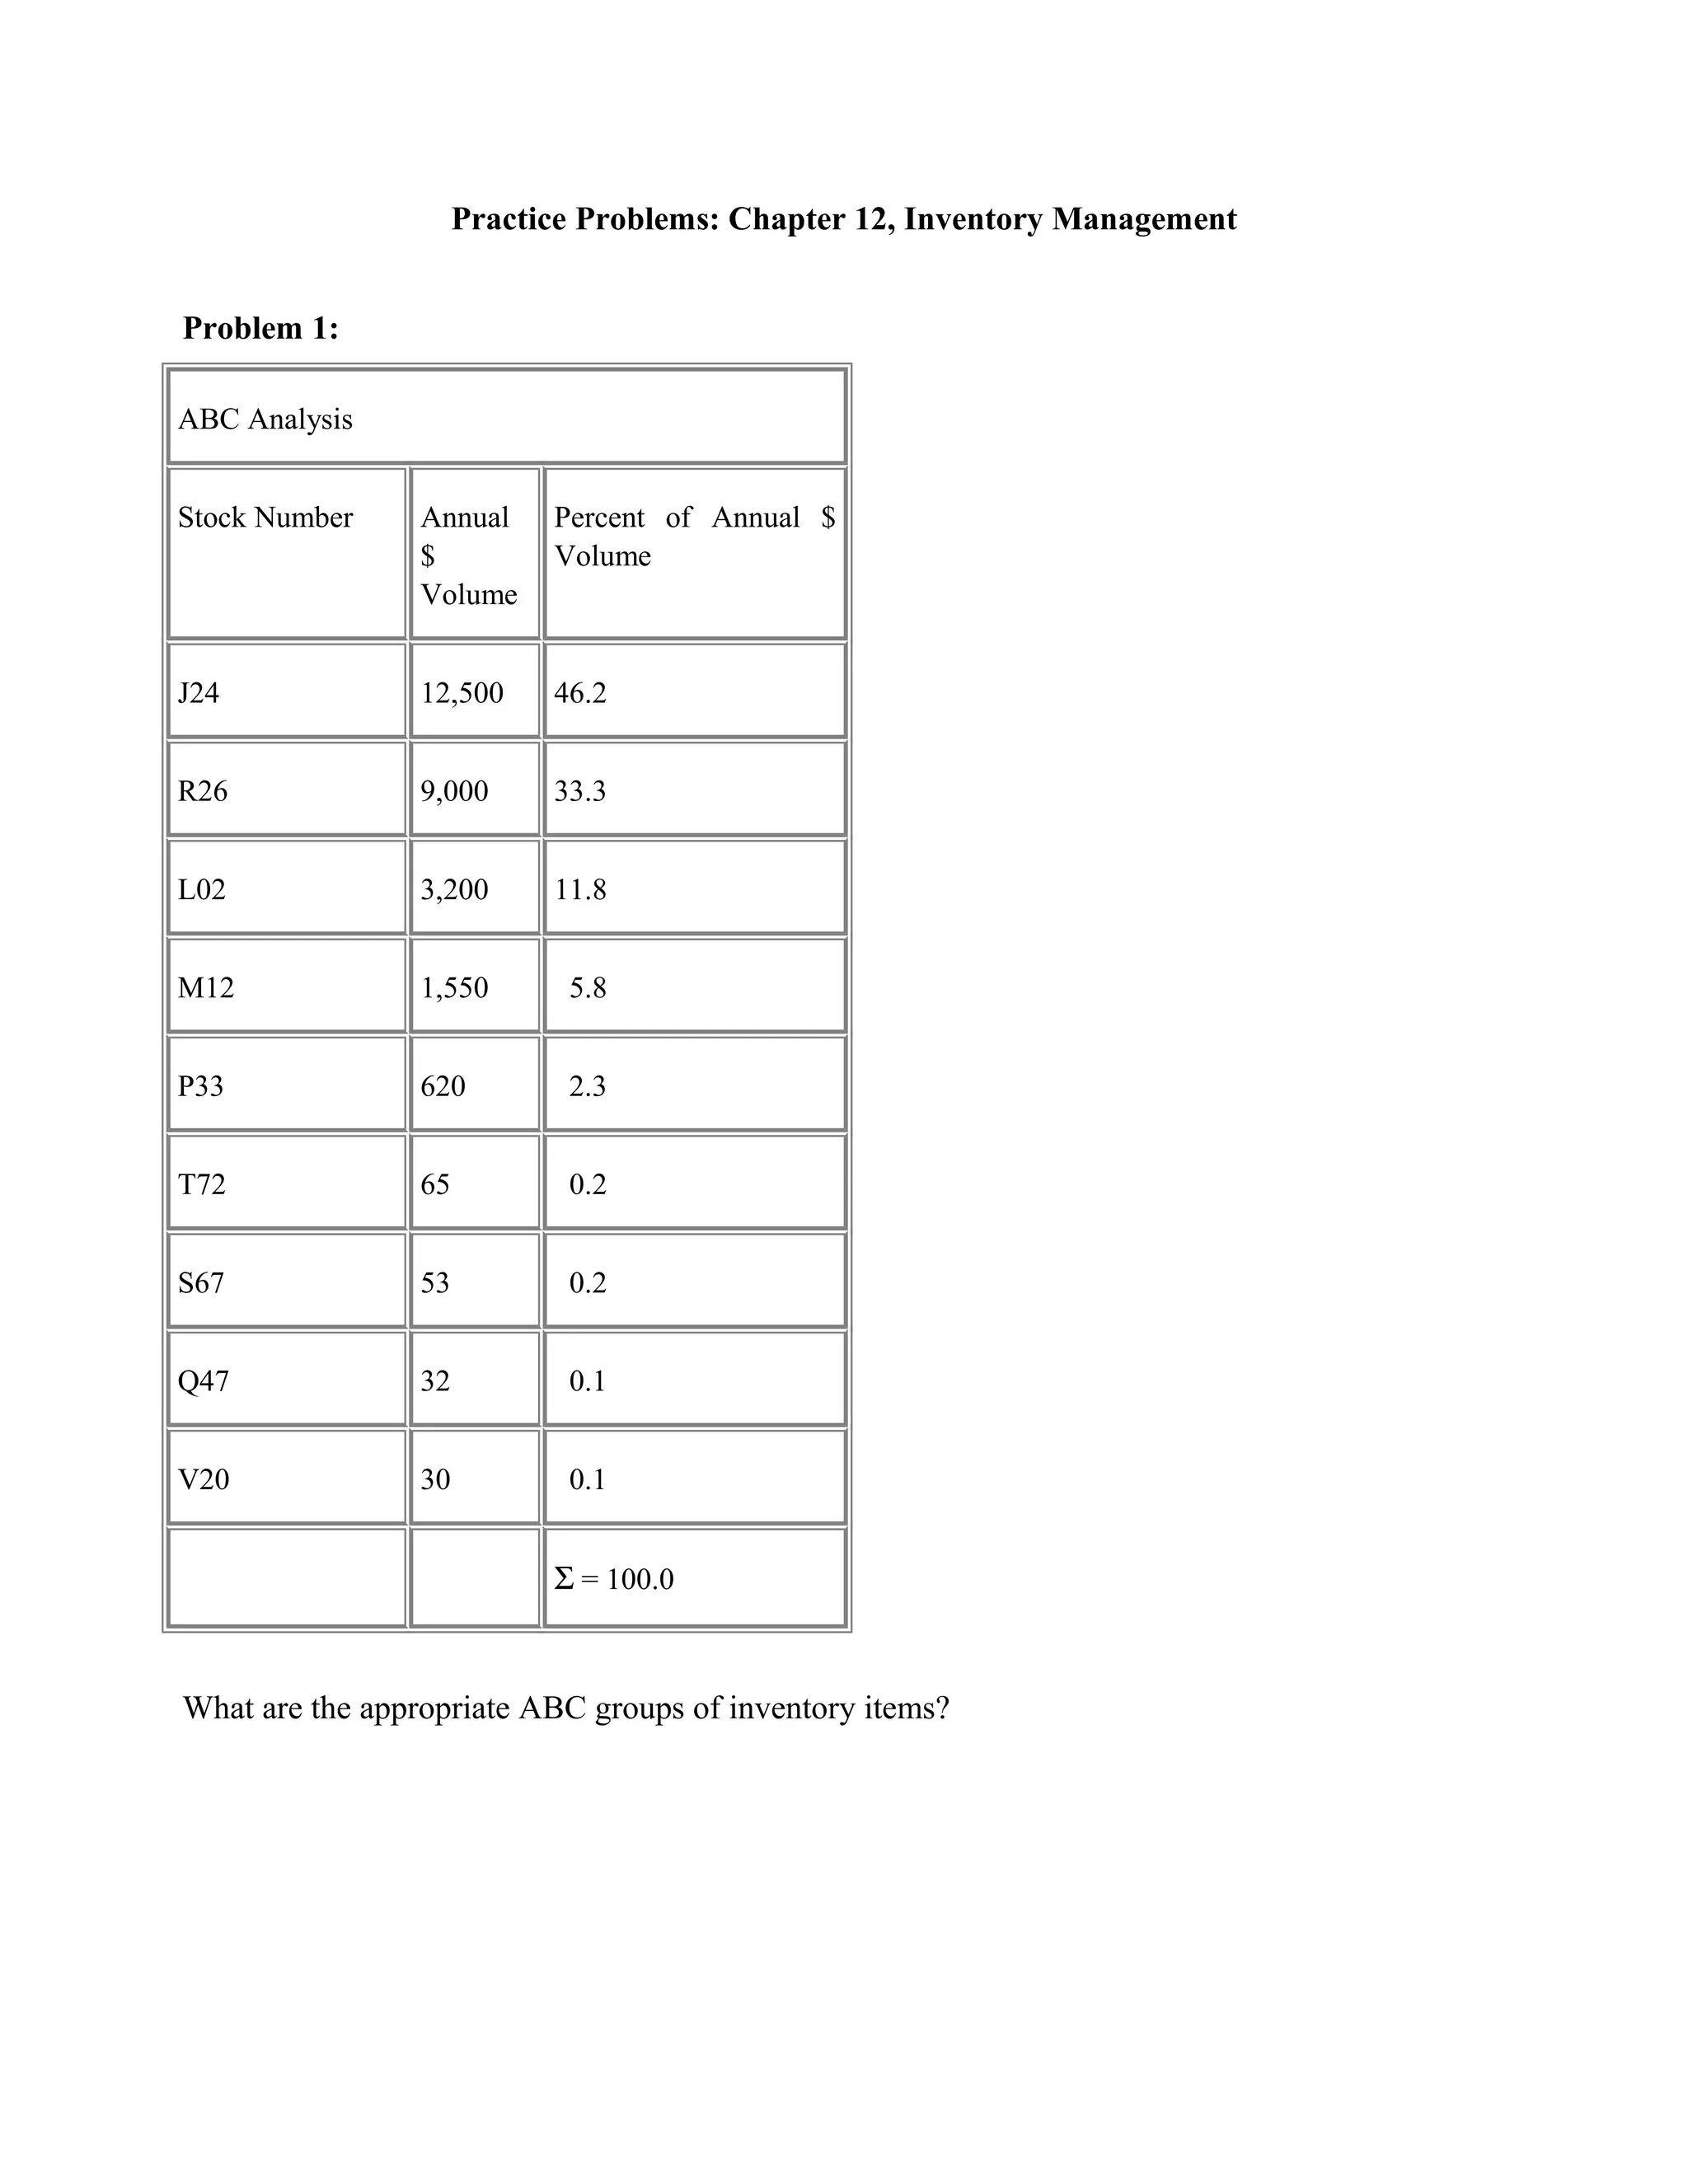


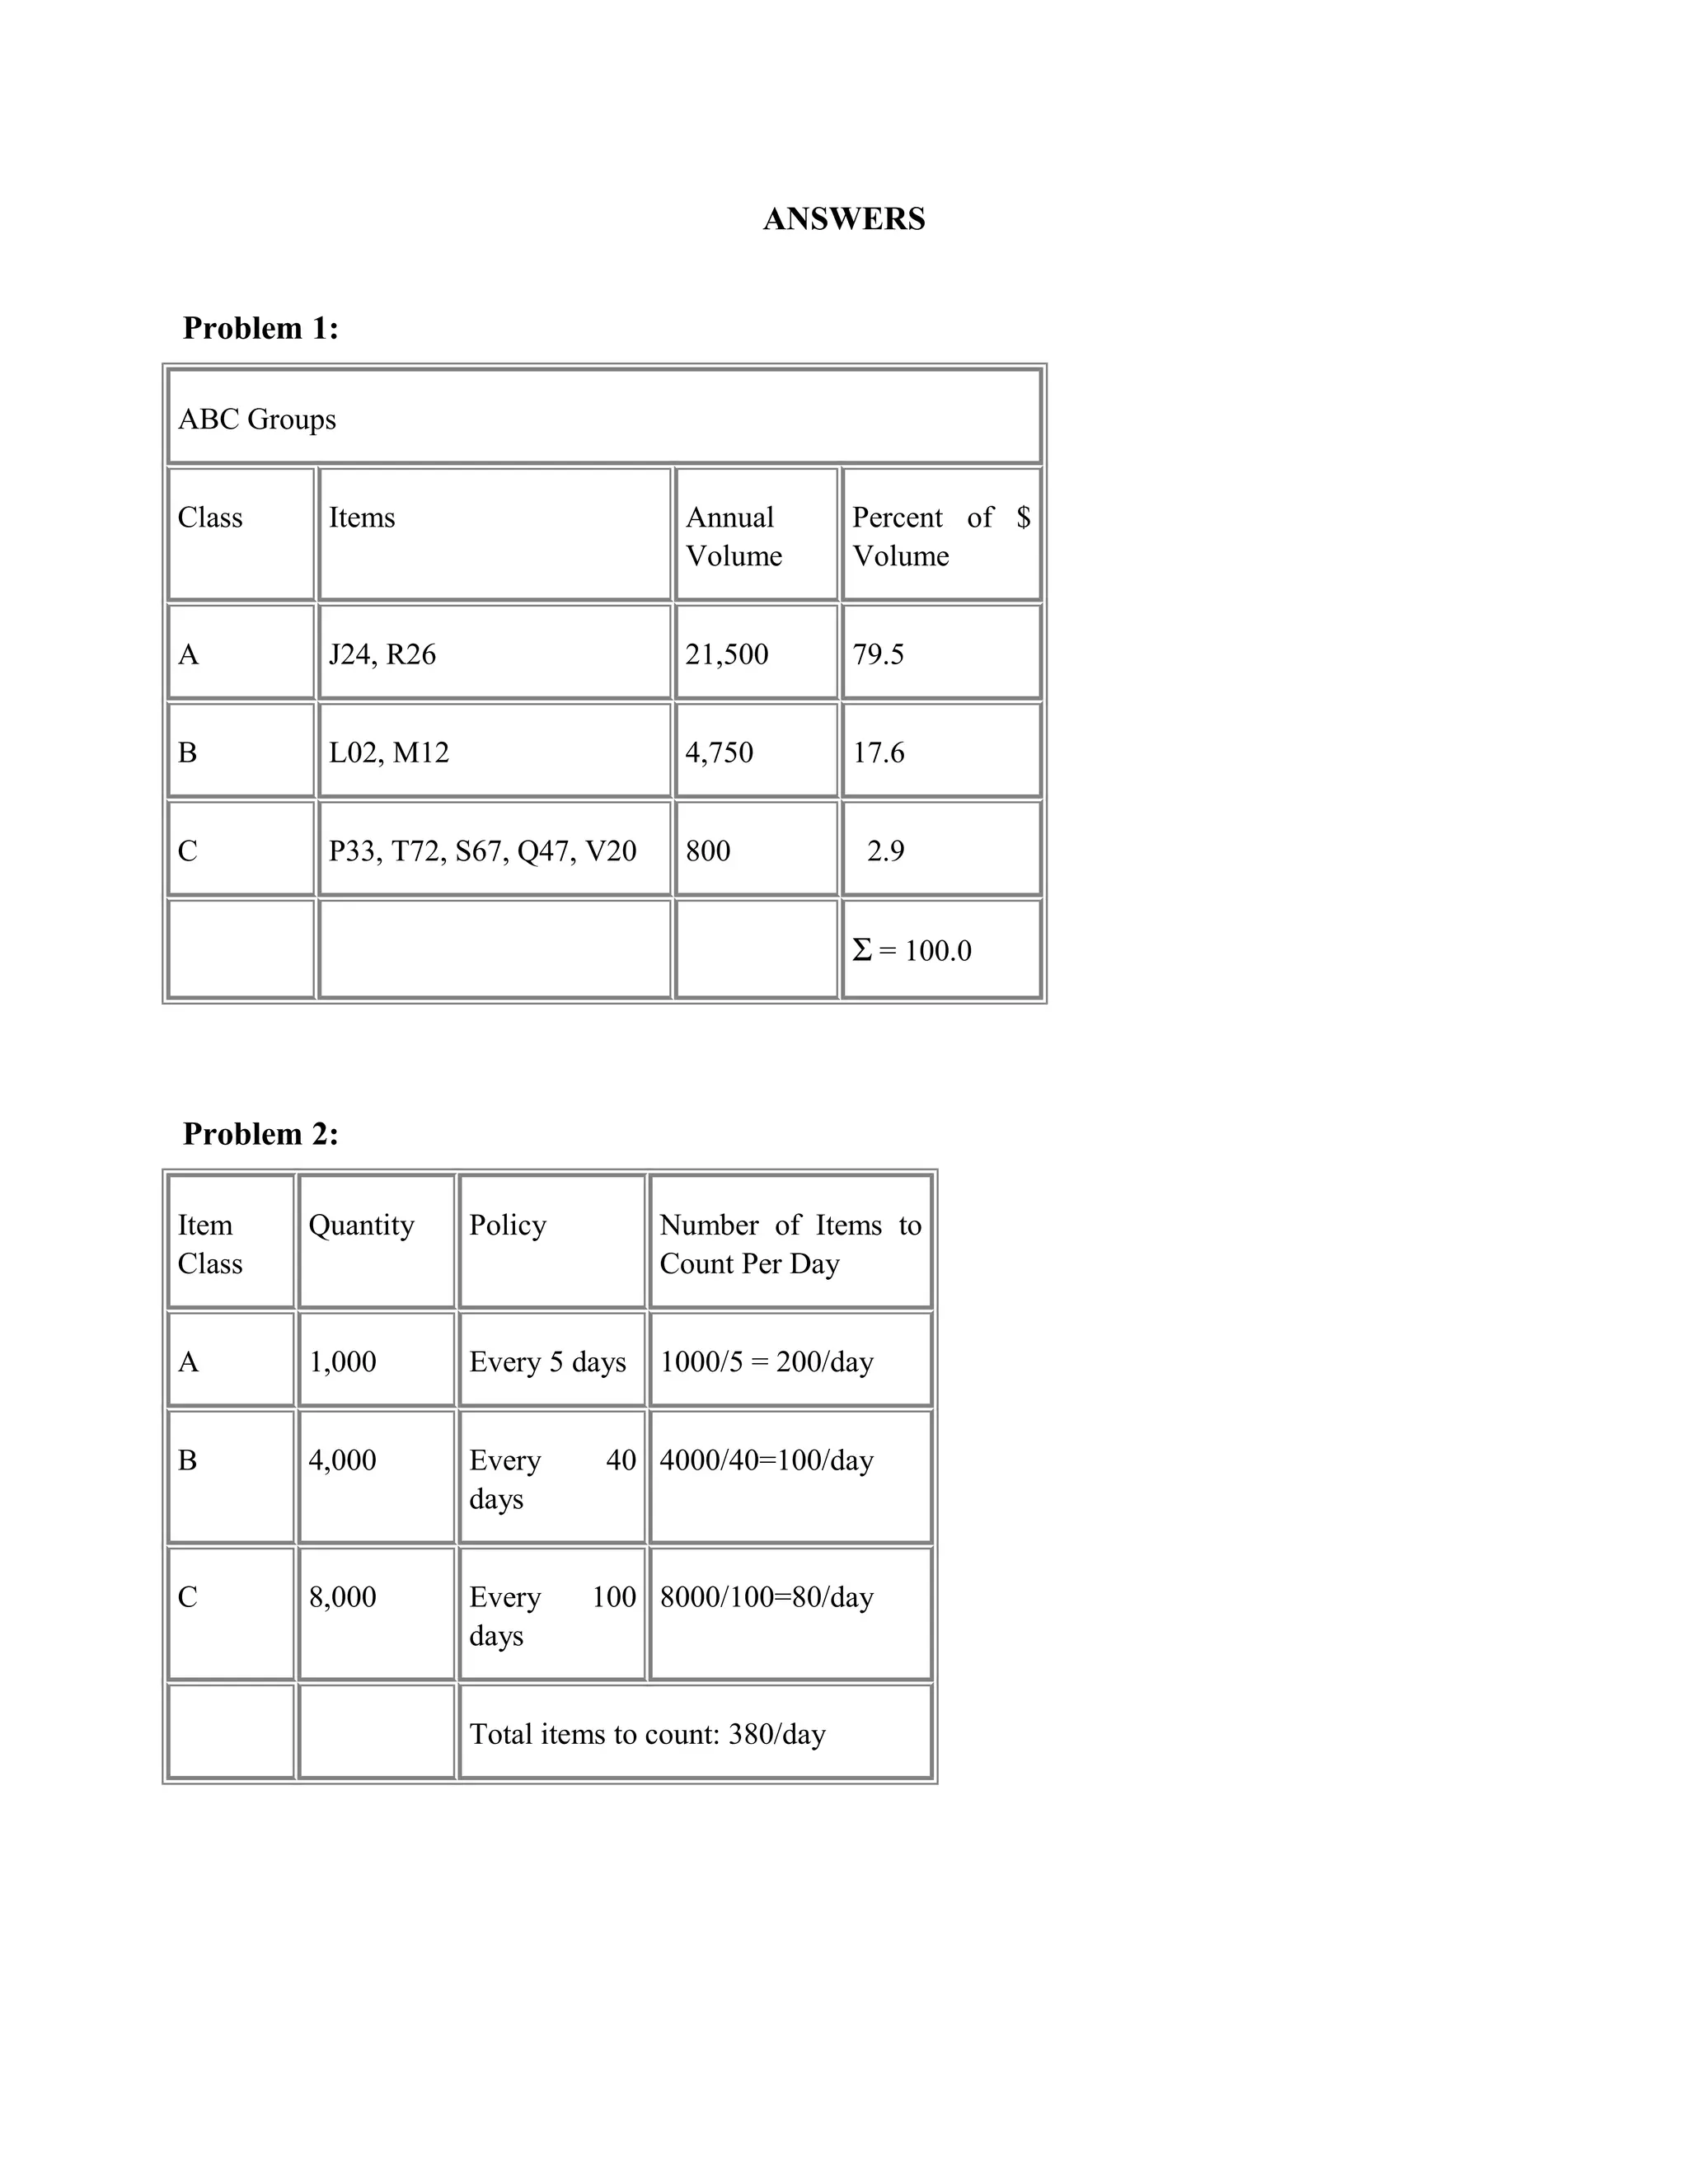


The document contains practice problems related to inventory management. Problem 1 involves classifying inventory items into ABC categories based on annual dollar volume. Problems 2-5 calculate order quantities, order frequencies, and total costs for inventory items. Problems 6-11 involve calculations related to safety stock, reorder points, economic order quantities, and inventory policies under different demand assumptions.


![Product1 [4] capacity planning](https://cdn.slidesharecdn.com/ss_thumbnails/product14-capacityplanning-190226032041-thumbnail.jpg?width=640&height=640&fit=bounds)


![Production & Operation Management Chapter21[1]](https://cdn.slidesharecdn.com/ss_thumbnails/chapter211-140613051621-phpapp02-thumbnail.jpg?width=640&height=640&fit=bounds)


