1

Process Analysis
2

OBJECTIVES

• Process Analysis
• Process Flowcharting
• Types of Processes
• Process Performance Metrics
3

Process Analysis Terms


Process: Is any part of an organization that
takes inputs and transforms them into outputs



Cycle Time: Is the average successive time
between completions of successive units



Utilization: Is the ratio of the time that a
resource is actually activated relative to the
time that it is available for use
Process Flowcharting
Defined


Process flowcharting is the use of a diagram to
present the major elements of a process



The basic elements can include tasks or
operations, flows of materials or customers,
decision points, and storage areas or queues



It is an ideal methodology by which to begin
analyzing a process

4
5

PROCESS ANALYSIS
Standard Symbols used for Flowcharting
Symbol

Activity
Operation

Transportation
or Movement
Inspection
Delay/Temporary
Storage

Definition of Activity
Modification of an object

Change in location of an
Item
Examination of an Object
(Qlty/Qty parameters)
Retention of an Object in a
location awaiting next
activity
6

Decision Point
(Awaiting decision
on further Action)

Storage

Combined
Activity

Location awaiting
next activity

Items in stored
condition (no
unauthorized
removal)

Two activities
occur
simultaneously
•

PROCESS ANALYSIS – Key
Terms
What is a process?
A process is any part of an organization that takes Inputs and transforms
them into Outputs

•

Cycle time
(unit item)

•

•

the elapsed time between starting and completing a job
(Average time between completion of units)

Run time

is the time required to produce a batch of parts
(for the batch) (this is calculated by multiplying the time required to
produce each unit by the batch size)

Set-up time
(for the m/c)

is the time required to prepare a m/c to produce an item

7
•

Operation time

is the sum of set-up time and runtime for a batch
of parts that are run on a m/c

(for the Batch)

•

Thro’put time
( for the Unit)

the time that the unit spends actually being
worked plus the time spent waiting in

aQ

•

Thro’put Rate

•

Value Added time

(for the Batch)

(for the unit)

•

Thro’put Ratio

is the Output rate that the process is expected to
produce over a period of time
the time in which useful work is actually being
done on the unit
Process Velocity :
the ratio of the total thro’put time to the value added
time

8
9

•

Make-to-order

•

Make-to-stock

•

Hybrid

(Either Unit or
Batch)

(Either Unit or
Batch)

(Unit or Batch )

A process that is activated only in response to an
actual order

A process that produces standard products that are
stored in finished Goods Inventory : the product is
quickly delivered to the customer

Combines the feature of both make-to-order and
make-to-stock
(A generic product is made and customised in a final
process to meet actual orders)
Make-to-Order

customer
Customer Order
Product
Production
Make-to-Stock
Forecast orders

customer

Production

Customer Order
Product

Finished Goods
Inventory

Product
Assemble-to-Order
Forecast orders

customer

Production of
Subassemblies
Customer order

Product

Assembly
of the Order

Subassembly
Inventory
of Subassemblies
13



Efficiency



Productivity



Utilization



Little’s Law

Actual Output
Standard Output

Output
Input
Time activated
Time available

(definition as follows)

Thro’put time = Work-in-Proccess
Thro’put Rate
14

Example: Flowchart of
Student Going to School
Go to
school
today?

No
Abstain

Yes

Drive to
school

Walk to
class
15

Types of Processes
Single-stage Process
Stage 1

Multi-stage Process
Stage 1

Stage 2

Stage 3
16

Other Process Terminology
(Continued)


Bottleneck
– Occurs when the limited capacity of a process
causes work to pile up or become unevenly
distributed in the flow of a process
– If an employee works too slow in a multi-stage
process, work will begin to pile up in front of
that employee. In this case the employee
represents the limited capacity causing the
bottleneck.



Pacing
– Refers to the fixed timing of the movement of
items through the process
17

Other Types of Processes


Make-to-order
– Activated only in response to an actual order
– Both work-in-process and finished goods
inventory kept to a minimum



Make-to-stock
– Process activated to meet expected or
forecast demand
– Customer orders are served from target
stocking level
Process Performance
Metrics

18



Operation time = Setup time + Run time



Throughput time = Average time for a unit to
move through the system



Velocity = Throughput time
Value-added time
Process Performance
Metrics (Continued)


Cycle time = Average time between
completion of units



Throughput rate =
1
.
Cycle time



Efficiency = Actual output
Standard Output

19
Process Performance Metrics
(Continued)



Productivity = Output
Input



Utilization = Time Activated
Time Available

20
Cycle Time Example

21

Suppose you had to produce 600 units in 80
hours to meet the demand requirements of a
product. What is the cycle time to meet this
demand requirement?
demand requirement?
Answer: There are 4,800 minutes (60
minutes/hour x 80 hours) in 80 hours. So the
average time between completions would have
to be: Cycle time = 4,800/600 units = 8 minutes.
22

Process Throughput Time
Reduction


Perform activities in parallel



Change the sequence of activities



Reduce interruptions
23

Question Bowl
Which of the following are possible
examples of “cycle times”?
a. Time for each television to come off an
assembly line.
b. Time it takes for a stock purchase
c. Time it takes for an instructor to grade
an exam
d. Time it takes to complete an automobile
e. All of the above

Answer: e. All of the above
24

Question Bowl
Which of the following are used as
symbols in a Process Flowchart?
a. Decision points
b. Blocking
c. Starving
d. Bottleneck
e. All of the above
Answer: a. Decision points (A diamond
shaped symbol.)
25

Question Bowl
Which type of process is configured as
follows?
1

2

Single-stage process
b. Multi-stage process
c. Make-to-order process
d. Make-to-stock process
e. All of the above
Answer: b. Multi-stage process
a.

3
26

Question Bowl

a.
b.
c.
d.
e.

When an assembly line employee is waiting
for a unit of work to come down the line so
they can stop being idle and get back to
work, it is an example of which of the
following process terms?
Buffering
Blocking
Starving
Bottleneck
All of the above

Answer: c. Starving
27

Question Bowl

a.
b.
c.
d.
e.

When a company waits until they have an
order for their product in hand before
beginning any production for that order, we
can characterize their operation as which of
the following processes?
Single-stage process
Multi-stage process
Make-to-order process
Make-to-stock process
All of the above

Answer: c. Make-to-order process
28

Question Bowl

a.
b.
c.
d.
e.

If the Run Time for a batch of parts is 45 minutes
on a machine, and the Setup Time is 65 minutes,
which of the following is the Operation Time?
75 minutes
110 minutes
Only 45 minutes
65/45 minutes or 1.44 hours
Can not be computed on the data above
Answer: b. 110 minutes ( Operation Time is the sum of
Run Time and Setup Time, or 65 + 45 = 110 minutes)
29

Question Bowl
If the standard expected phone calls for a
telephone marketers is 24 per hour, and one
telephone marketer did 27 per hour, which of
the following can be used to describe their
Answer: c. 112.5%
Efficiency?
(Ratio of actual
a.
88.8%
performance/expected performance,
b.
100%
or (27/24) x 100 = 110 minutes)
c.
d.
e.

112.5%
Well over 150%
Can not computed on the information given.
30

Solved Problems – OPERATIONS MANAGEMENT
(Class of 2010)
Q5. A processor makes 2 components, A and B, which are then packed together as final product
(each product sold contains one A and one B). The processor can do only one component at a
time: either it can make As or it can make Bs. There is a setup time when switching from A to
B
Current plans are to make 100 units of component A, then 100 units of component B, and then
100 units of A and 100 units of B to be packed to be supplied as 100 units of Final Product
The setup and runtimes for each component are given below:-

Component

Setup / Changeover
Time

Run Time / Unit

A

5 min

0.2 min

B

10 min

0.1 min

Assume that packaging of 2 components is totally automated and takes only 2 seconds / unit
of the final product. The packaging time is small enough that you can ignore it. What is the
average hourly output in terms of no. of units of packaged products (which includes 1 of A
and 1 of B)
31

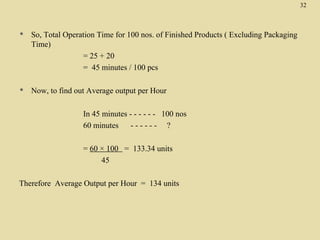
Answer. In order to make final goods, we have to assemble both component A and
component B.
So, let us find out the final operation time for both the components :

Component A
Operation Time = Setuptime + Runtime (for batch)
= 5 + [ (0.2 × 100)]
= 25 minutes



Component B
Operation Time = Setuptime + Runtime (for batch)
= 10 + [ (0.1 × 100)]
= 20 minutes
32



So, Total Operation Time for 100 nos. of Finished Products ( Excluding Packaging
Time)
= 25 + 20
= 45 minutes / 100 pcs



Now, to find out Average output per Hour
In 45 minutes - - - - - - 100 nos
60 minutes
------ ?
= 60 × 100 = 133.34 units
45

Therefore Average Output per Hour = 134 units

Ch5 process analysis

  • 1.
  • 2.
    2 OBJECTIVES • Process Analysis •Process Flowcharting • Types of Processes • Process Performance Metrics
  • 3.
    3 Process Analysis Terms  Process:Is any part of an organization that takes inputs and transforms them into outputs  Cycle Time: Is the average successive time between completions of successive units  Utilization: Is the ratio of the time that a resource is actually activated relative to the time that it is available for use
  • 4.
    Process Flowcharting Defined  Process flowchartingis the use of a diagram to present the major elements of a process  The basic elements can include tasks or operations, flows of materials or customers, decision points, and storage areas or queues  It is an ideal methodology by which to begin analyzing a process 4
  • 5.
    5 PROCESS ANALYSIS Standard Symbolsused for Flowcharting Symbol Activity Operation Transportation or Movement Inspection Delay/Temporary Storage Definition of Activity Modification of an object Change in location of an Item Examination of an Object (Qlty/Qty parameters) Retention of an Object in a location awaiting next activity
  • 6.
    6 Decision Point (Awaiting decision onfurther Action) Storage Combined Activity Location awaiting next activity Items in stored condition (no unauthorized removal) Two activities occur simultaneously
  • 7.
    • PROCESS ANALYSIS –Key Terms What is a process? A process is any part of an organization that takes Inputs and transforms them into Outputs • Cycle time (unit item) • • the elapsed time between starting and completing a job (Average time between completion of units) Run time is the time required to produce a batch of parts (for the batch) (this is calculated by multiplying the time required to produce each unit by the batch size) Set-up time (for the m/c) is the time required to prepare a m/c to produce an item 7
  • 8.
    • Operation time is thesum of set-up time and runtime for a batch of parts that are run on a m/c (for the Batch) • Thro’put time ( for the Unit) the time that the unit spends actually being worked plus the time spent waiting in aQ • Thro’put Rate • Value Added time (for the Batch) (for the unit) • Thro’put Ratio is the Output rate that the process is expected to produce over a period of time the time in which useful work is actually being done on the unit Process Velocity : the ratio of the total thro’put time to the value added time 8
  • 9.
    9 • Make-to-order • Make-to-stock • Hybrid (Either Unit or Batch) (EitherUnit or Batch) (Unit or Batch ) A process that is activated only in response to an actual order A process that produces standard products that are stored in finished Goods Inventory : the product is quickly delivered to the customer Combines the feature of both make-to-order and make-to-stock (A generic product is made and customised in a final process to meet actual orders)
  • 10.
  • 11.
  • 12.
    Assemble-to-Order Forecast orders customer Production of Subassemblies Customerorder Product Assembly of the Order Subassembly Inventory of Subassemblies
  • 13.
    13  Efficiency  Productivity  Utilization  Little’s Law Actual Output StandardOutput Output Input Time activated Time available (definition as follows) Thro’put time = Work-in-Proccess Thro’put Rate
  • 14.
    14 Example: Flowchart of StudentGoing to School Go to school today? No Abstain Yes Drive to school Walk to class
  • 15.
    15 Types of Processes Single-stageProcess Stage 1 Multi-stage Process Stage 1 Stage 2 Stage 3
  • 16.
    16 Other Process Terminology (Continued)  Bottleneck –Occurs when the limited capacity of a process causes work to pile up or become unevenly distributed in the flow of a process – If an employee works too slow in a multi-stage process, work will begin to pile up in front of that employee. In this case the employee represents the limited capacity causing the bottleneck.  Pacing – Refers to the fixed timing of the movement of items through the process
  • 17.
    17 Other Types ofProcesses  Make-to-order – Activated only in response to an actual order – Both work-in-process and finished goods inventory kept to a minimum  Make-to-stock – Process activated to meet expected or forecast demand – Customer orders are served from target stocking level
  • 18.
    Process Performance Metrics 18  Operation time= Setup time + Run time  Throughput time = Average time for a unit to move through the system  Velocity = Throughput time Value-added time
  • 19.
    Process Performance Metrics (Continued)  Cycletime = Average time between completion of units  Throughput rate = 1 . Cycle time  Efficiency = Actual output Standard Output 19
  • 20.
    Process Performance Metrics (Continued)  Productivity= Output Input  Utilization = Time Activated Time Available 20
  • 21.
    Cycle Time Example 21 Supposeyou had to produce 600 units in 80 Suppose you had to produce 600 units in 80 hours to meet the demand requirements of a hours to meet the demand requirements of a product. What is the cycle time to meet this product. What is the cycle time to meet this demand requirement? demand requirement? Answer: There are 4,800 minutes (60 Answer: There are 4,800 minutes (60 minutes/hour x 80 hours) in 80 hours. So the minutes/hour x 80 hours) in 80 hours. So the average time between completions would have average time between completions would have to be: Cycle time = 4,800/600 units = 8 minutes. to be: Cycle time = 4,800/600 units = 8 minutes.
  • 22.
    22 Process Throughput Time Reduction  Performactivities in parallel  Change the sequence of activities  Reduce interruptions
  • 23.
    23 Question Bowl Which ofthe following are possible examples of “cycle times”? a. Time for each television to come off an assembly line. b. Time it takes for a stock purchase c. Time it takes for an instructor to grade an exam d. Time it takes to complete an automobile e. All of the above Answer: e. All of the above
  • 24.
    24 Question Bowl Which ofthe following are used as symbols in a Process Flowchart? a. Decision points b. Blocking c. Starving d. Bottleneck e. All of the above Answer: a. Decision points (A diamond shaped symbol.)
  • 25.
    25 Question Bowl Which typeof process is configured as follows? 1 2 Single-stage process b. Multi-stage process c. Make-to-order process d. Make-to-stock process e. All of the above Answer: b. Multi-stage process a. 3
  • 26.
    26 Question Bowl a. b. c. d. e. When anassembly line employee is waiting for a unit of work to come down the line so they can stop being idle and get back to work, it is an example of which of the following process terms? Buffering Blocking Starving Bottleneck All of the above Answer: c. Starving
  • 27.
    27 Question Bowl a. b. c. d. e. When acompany waits until they have an order for their product in hand before beginning any production for that order, we can characterize their operation as which of the following processes? Single-stage process Multi-stage process Make-to-order process Make-to-stock process All of the above Answer: c. Make-to-order process
  • 28.
    28 Question Bowl a. b. c. d. e. If theRun Time for a batch of parts is 45 minutes on a machine, and the Setup Time is 65 minutes, which of the following is the Operation Time? 75 minutes 110 minutes Only 45 minutes 65/45 minutes or 1.44 hours Can not be computed on the data above Answer: b. 110 minutes ( Operation Time is the sum of Run Time and Setup Time, or 65 + 45 = 110 minutes)
  • 29.
    29 Question Bowl If thestandard expected phone calls for a telephone marketers is 24 per hour, and one telephone marketer did 27 per hour, which of the following can be used to describe their Answer: c. 112.5% Efficiency? (Ratio of actual a. 88.8% performance/expected performance, b. 100% or (27/24) x 100 = 110 minutes) c. d. e. 112.5% Well over 150% Can not computed on the information given.
  • 30.
    30 Solved Problems –OPERATIONS MANAGEMENT (Class of 2010) Q5. A processor makes 2 components, A and B, which are then packed together as final product (each product sold contains one A and one B). The processor can do only one component at a time: either it can make As or it can make Bs. There is a setup time when switching from A to B Current plans are to make 100 units of component A, then 100 units of component B, and then 100 units of A and 100 units of B to be packed to be supplied as 100 units of Final Product The setup and runtimes for each component are given below:- Component Setup / Changeover Time Run Time / Unit A 5 min 0.2 min B 10 min 0.1 min Assume that packaging of 2 components is totally automated and takes only 2 seconds / unit of the final product. The packaging time is small enough that you can ignore it. What is the average hourly output in terms of no. of units of packaged products (which includes 1 of A and 1 of B)
  • 31.
    31 Answer. In orderto make final goods, we have to assemble both component A and component B. So, let us find out the final operation time for both the components : Component A Operation Time = Setuptime + Runtime (for batch) = 5 + [ (0.2 × 100)] = 25 minutes  Component B Operation Time = Setuptime + Runtime (for batch) = 10 + [ (0.1 × 100)] = 20 minutes
  • 32.
    32  So, Total OperationTime for 100 nos. of Finished Products ( Excluding Packaging Time) = 25 + 20 = 45 minutes / 100 pcs  Now, to find out Average output per Hour In 45 minutes - - - - - - 100 nos 60 minutes ------ ? = 60 × 100 = 133.34 units 45 Therefore Average Output per Hour = 134 units