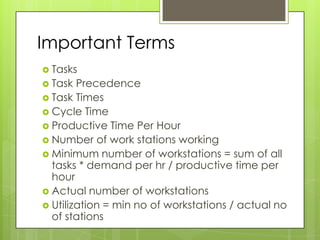
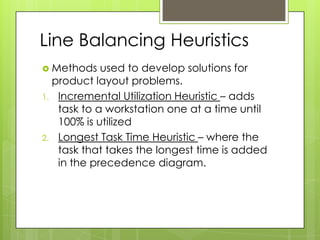
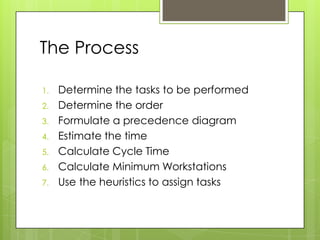
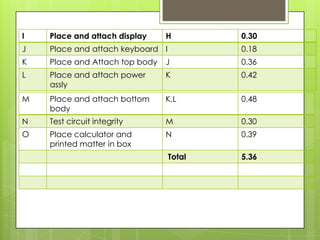
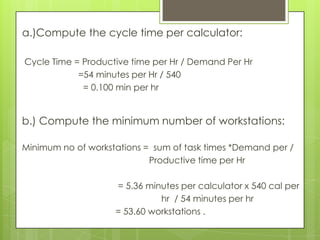
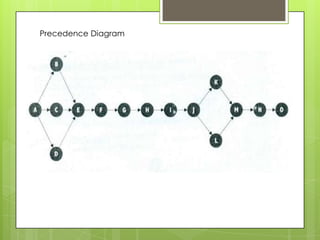
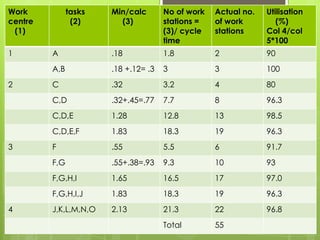
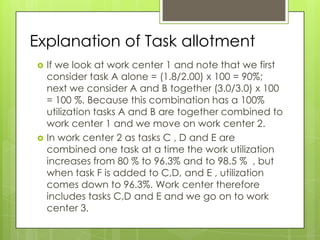
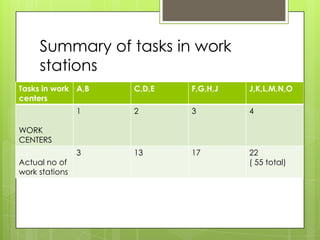
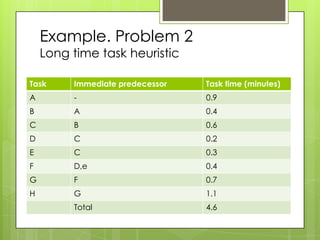
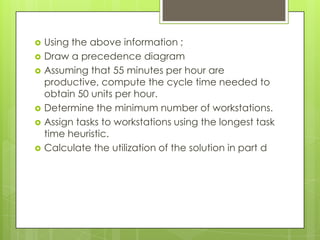
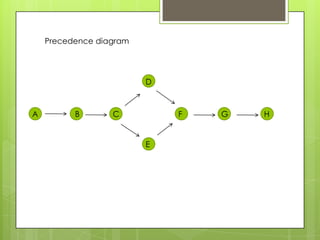
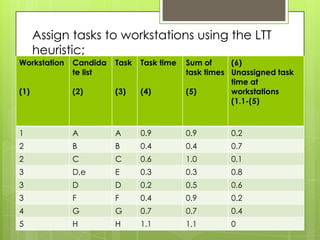
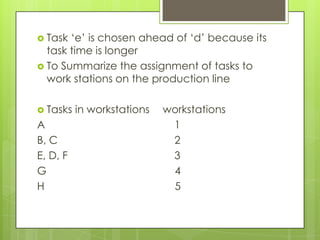
Line
Balancing
Operations Management
Introduction
 While   looking at product layout there are
  many aspects to focus on.
 Production Lines, Product design, Market
  demand, number of workers, technology
  or machines.
 This info is provided by line balancing.
Line Balancing
 Line  Balancing is levelling the workload across
  all processes in a cell or value stream to
  remove bottlenecks and excess capacity.
 A constraint slows the process down and
  results if waiting for downstream operations
  and excess capacity results in waiting and
  absorption of fixed costs.
 Emphasis on Workstation and Work Center.
Important Terms
 Tasks
 Task  Precedence
 Task Times
 Cycle Time
 Productive Time Per Hour
 Number of work stations working
 Minimum number of workstations = sum of all
  tasks * demand per hr / productive time per
  hour
 Actual number of workstations
 Utilization = min no of workstations / actual no
  of stations
Line Balancing Heuristics
 Methods   used to develop solutions for
  product layout problems.
1. Incremental Utilization Heuristic – adds
   task to a workstation one at a time until
   100% is utilized
2. Longest Task Time Heuristic – where the
   task that takes the longest time is added
   in the precedence diagram.
The Process

1.   Determine the tasks to be performed
2.   Determine the order
3.   Formulate a precedence diagram
4.   Estimate the time
5.   Calculate Cycle Time
6.   Calculate Minimum Workstations
7.   Use the heuristics to assign tasks
Example. Problem 1
Incremental Heuristic
 Textech   a large electronic manufacturer
  assembles a model AT75 handheld calculator
  at its Midland , Texas Plant.
 The assembly tasks that must be performed on
  each calculator are given below;
 The parts used in this assembly line are supplied
  by materials handling personnel to part bins
  used in each task. The assemblies are moved
  along by belt conveyors between workstations.
 Textech wants this assembly line to produce
  540 calculators per hour.
A.   Compute the cycle time per calculator in
     minutes.
B.   Compute the minimum number of workstations
C.   How would you combine the tasks into
     workstations to minimize idle time.? Evaluate
     your proposal.

Here we need to note that an average of 6 mins
   per hour In this example is not productive due
   to lunch, personal time, machine break
   down, and start up and shut down time.
Tasks   Task details                 Tasks that must   Time to perform
                                     be immediately    task (in minutes)
                                     proceed
A       Place circuit frame on Jig                     0.18
B       Place Circuit No 1 into      A                 0.12
        frame
C       Place Circuit No 2 into      A                 0.32
        frame
D       Place circuit No 3           A                 0.45
E       Attach circuits to frame     B,C,D             0.51
F       Solder circuit connections   E                 0.55
        to central circuit control

G       Place circuit assembly in    F                 0.38
        calculator inner frame
H       Attach circuit assembly to   G                 0.42
        calculator inner frame
I   Place and attach display    H         0.30
J   Place and attach keyboard I           0.18
K   Place and Attach top body   J         0.36
L   Place and attach power      K         0.42
    assly
M   Place and attach bottom     K,L       0.48
    body
N   Test circuit integrity      M         0.30
O   Place calculator and        N         0.39
    printed matter in box
                                  Total   5.36
a.)Compute the cycle time per calculator:

Cycle Time = Productive time per Hr / Demand Per Hr
            =54 minutes per Hr / 540
             = 0.100 min per hr


b.) Compute the minimum number of workstations:

Minimum no of workstations = sum of task times *Demand per /
                            Productive time per Hr

                    = 5.36 minutes per calculator x 540 cal per
                              hr / 54 minutes per hr
                    = 53.60 workstations .
Precedence Diagram
Work           tasks   Min/calc       No of work   Actual no.   Utilisation
centre          (2)      (3)          stations =   of work         (%)
 (1)                                  (3)/ cycle   stations     Col 4/col
                                      time                      5*100
1        A             .18            1.8          2            90
         A,B           .18 +.12= .3   3            3            100
2        C             .32            3.2          4            80
         C,D           .32+.45=.77    7.7          8            96.3
         C,D,E         1.28           12.8         13           98.5
         C,D,E,F       1.83           18.3         19           96.3
3        F             .55            5.5          6            91.7
         F,G           .55+.38=.93    9.3          10           93
         F,G,H,I       1.65           16.5         17           97.0
         F,G,H,I,J     1.83           18.3         19           96.3
4        J,K,L,M,N,O   2.13           21.3         22           96.8
                                      Total        55
Explanation of Task allotment
   If we look at work center 1 and note that we first
    consider task A alone = (1.8/2.00) x 100 = 90%;
    next we consider A and B together (3.0/3.0) x 100
    = 100 %. Because this combination has a 100%
    utilization tasks A and B are together combined to
    work center 1 and we move on work center 2.
   In work center 2 as tasks C , D and E are
    combined one task at a time the work utilization
    increases from 80 % to 96.3% and to 98.5 % , but
    when task F is added to C,D, and E , utilization
    comes down to 96.3%. Work center therefore
    includes tasks C,D and E and we go on to work
    center 3.
Summary of tasks in work
     stations
Tasks in work A,B   C,D,E   F,G,H,J   J,K,L,M,N,O
centers
                1   2       3         4

WORK
CENTERS
                3   13      17        22
Actual no of                          ( 55 total)
work stations
Efficiency of the proposal
 Utilization
            = minimum no of work stations /
 actual no of work stations
= 53.6 / 55
= 97.5%
Example. Problem 2
    Long time task heuristic

Task     Immediate predecessor   Task time (minutes)
A        -                       0.9
B        A                       0.4
C        B                       0.6
D        C                       0.2
E        C                       0.3
F        D,e                     0.4
G        F                       0.7
H        G                       1.1
         Total                   4.6
   Using the above information ;
   Draw a precedence diagram
   Assuming that 55 minutes per hour are
    productive, compute the cycle time needed to
    obtain 50 units per hour.
   Determine the minimum number of workstations.
   Assign tasks to workstations using the longest task
    time heuristic.
   Calculate the utilization of the solution in part d
Precedence diagram


                         D


A         B       C          F   G   H


                         E
 Assumingthat 55 minutes per hr are
 productive, compute the cycle time
 needed to obtain 50 units per hour.

cycle time = productive time per hr /
demand per hr

= 55 min per hr / 50 Products per hour
=1.1 minute per product
 c.   Determine the min.no of workstations;

Min.no.of workstations = sum of all task times x
demand per hour / productive time per hour

= 4.6 mins per product x 50 products per hour / 55
mins per hour

= 4.2 workstations
Assign tasks to workstations using the LTT
      heuristic;
Workstation   Candida   Task   Task time   Sum of     (6)
              te list                      task times Unassigned task
                                                      time at
(1)           (2)       (3)    (4)         (5)        workstations
                                                      (1.1-(5)


1             A         A      0.9         0.9       0.2
2             B         B      0.4         0.4       0.7
2             C         C      0.6         1.0       0.1
3             D,e       E      0.3         0.3       0.8
3             D         D      0.2         0.5       0.6
3             F         F      0.4         0.9       0.2
4             G         G      0.7         0.7       0.4
5             H         H      1.1         1.1       0
 Task „e‟ is chosen ahead of „d‟ because its
  task time is longer
 To Summarize the assignment of tasks to
  work stations on the production line

 Tasks   in workstations   workstations
A                            1
B, C                         2
E, D, F                      3
G                            4
H                            5
  Calculate the utilization of the solution
 Utilization = Minimum No .of workstations /
  actual no of workstations x 100
= 4.2 / 5 x 100
= 84 %
Limitations of Line Balancing

 Production  lines were designed so that
  conveyor belts paced the speed of the
  employees‟ work. This arrangement
  wasn‟t appreciated by the employees.
 Inevitable changes lead to production
  lines being out of balance.
 Rebalancing causes disruptions to
  production
Conclusions
 The classic example is Henry Ford‟s auto
 chassis line.
 • Before the “assembly line Balancing”
   was introduced in 1913, each chassis
   was assembled by one worker and
   required 12.5 hours.
 • Once the new technology was
   installed, this time was reduced to 93
   minutes.

Line balancing

  • 1.
  • 2.
    Introduction  While looking at product layout there are many aspects to focus on.  Production Lines, Product design, Market demand, number of workers, technology or machines.  This info is provided by line balancing.
  • 4.
    Line Balancing  Line Balancing is levelling the workload across all processes in a cell or value stream to remove bottlenecks and excess capacity.  A constraint slows the process down and results if waiting for downstream operations and excess capacity results in waiting and absorption of fixed costs.  Emphasis on Workstation and Work Center.
  • 5.
    Important Terms  Tasks Task Precedence  Task Times  Cycle Time  Productive Time Per Hour  Number of work stations working  Minimum number of workstations = sum of all tasks * demand per hr / productive time per hour  Actual number of workstations  Utilization = min no of workstations / actual no of stations
  • 6.
    Line Balancing Heuristics Methods used to develop solutions for product layout problems. 1. Incremental Utilization Heuristic – adds task to a workstation one at a time until 100% is utilized 2. Longest Task Time Heuristic – where the task that takes the longest time is added in the precedence diagram.
  • 7.
    The Process 1. Determine the tasks to be performed 2. Determine the order 3. Formulate a precedence diagram 4. Estimate the time 5. Calculate Cycle Time 6. Calculate Minimum Workstations 7. Use the heuristics to assign tasks
  • 8.
    Example. Problem 1 IncrementalHeuristic  Textech a large electronic manufacturer assembles a model AT75 handheld calculator at its Midland , Texas Plant.  The assembly tasks that must be performed on each calculator are given below;  The parts used in this assembly line are supplied by materials handling personnel to part bins used in each task. The assemblies are moved along by belt conveyors between workstations.  Textech wants this assembly line to produce 540 calculators per hour.
  • 9.
    A. Compute the cycle time per calculator in minutes. B. Compute the minimum number of workstations C. How would you combine the tasks into workstations to minimize idle time.? Evaluate your proposal. Here we need to note that an average of 6 mins per hour In this example is not productive due to lunch, personal time, machine break down, and start up and shut down time.
  • 10.
    Tasks Task details Tasks that must Time to perform be immediately task (in minutes) proceed A Place circuit frame on Jig 0.18 B Place Circuit No 1 into A 0.12 frame C Place Circuit No 2 into A 0.32 frame D Place circuit No 3 A 0.45 E Attach circuits to frame B,C,D 0.51 F Solder circuit connections E 0.55 to central circuit control G Place circuit assembly in F 0.38 calculator inner frame H Attach circuit assembly to G 0.42 calculator inner frame
  • 11.
    I Place and attach display H 0.30 J Place and attach keyboard I 0.18 K Place and Attach top body J 0.36 L Place and attach power K 0.42 assly M Place and attach bottom K,L 0.48 body N Test circuit integrity M 0.30 O Place calculator and N 0.39 printed matter in box Total 5.36
  • 12.
    a.)Compute the cycletime per calculator: Cycle Time = Productive time per Hr / Demand Per Hr =54 minutes per Hr / 540 = 0.100 min per hr b.) Compute the minimum number of workstations: Minimum no of workstations = sum of task times *Demand per / Productive time per Hr = 5.36 minutes per calculator x 540 cal per hr / 54 minutes per hr = 53.60 workstations .
  • 13.
  • 14.
    Work tasks Min/calc No of work Actual no. Utilisation centre (2) (3) stations = of work (%) (1) (3)/ cycle stations Col 4/col time 5*100 1 A .18 1.8 2 90 A,B .18 +.12= .3 3 3 100 2 C .32 3.2 4 80 C,D .32+.45=.77 7.7 8 96.3 C,D,E 1.28 12.8 13 98.5 C,D,E,F 1.83 18.3 19 96.3 3 F .55 5.5 6 91.7 F,G .55+.38=.93 9.3 10 93 F,G,H,I 1.65 16.5 17 97.0 F,G,H,I,J 1.83 18.3 19 96.3 4 J,K,L,M,N,O 2.13 21.3 22 96.8 Total 55
  • 15.
    Explanation of Taskallotment  If we look at work center 1 and note that we first consider task A alone = (1.8/2.00) x 100 = 90%; next we consider A and B together (3.0/3.0) x 100 = 100 %. Because this combination has a 100% utilization tasks A and B are together combined to work center 1 and we move on work center 2.  In work center 2 as tasks C , D and E are combined one task at a time the work utilization increases from 80 % to 96.3% and to 98.5 % , but when task F is added to C,D, and E , utilization comes down to 96.3%. Work center therefore includes tasks C,D and E and we go on to work center 3.
  • 16.
    Summary of tasksin work stations Tasks in work A,B C,D,E F,G,H,J J,K,L,M,N,O centers 1 2 3 4 WORK CENTERS 3 13 17 22 Actual no of ( 55 total) work stations
  • 17.
    Efficiency of theproposal  Utilization = minimum no of work stations / actual no of work stations = 53.6 / 55 = 97.5%
  • 18.
    Example. Problem 2 Long time task heuristic Task Immediate predecessor Task time (minutes) A - 0.9 B A 0.4 C B 0.6 D C 0.2 E C 0.3 F D,e 0.4 G F 0.7 H G 1.1 Total 4.6
  • 19.
    Using the above information ;  Draw a precedence diagram  Assuming that 55 minutes per hour are productive, compute the cycle time needed to obtain 50 units per hour.  Determine the minimum number of workstations.  Assign tasks to workstations using the longest task time heuristic.  Calculate the utilization of the solution in part d
  • 20.
    Precedence diagram D A B C F G H E
  • 21.
     Assumingthat 55minutes per hr are productive, compute the cycle time needed to obtain 50 units per hour. cycle time = productive time per hr / demand per hr = 55 min per hr / 50 Products per hour =1.1 minute per product
  • 22.
     c. Determine the min.no of workstations; Min.no.of workstations = sum of all task times x demand per hour / productive time per hour = 4.6 mins per product x 50 products per hour / 55 mins per hour = 4.2 workstations
  • 23.
    Assign tasks toworkstations using the LTT heuristic; Workstation Candida Task Task time Sum of (6) te list task times Unassigned task time at (1) (2) (3) (4) (5) workstations (1.1-(5) 1 A A 0.9 0.9 0.2 2 B B 0.4 0.4 0.7 2 C C 0.6 1.0 0.1 3 D,e E 0.3 0.3 0.8 3 D D 0.2 0.5 0.6 3 F F 0.4 0.9 0.2 4 G G 0.7 0.7 0.4 5 H H 1.1 1.1 0
  • 24.
     Task „e‟is chosen ahead of „d‟ because its task time is longer  To Summarize the assignment of tasks to work stations on the production line  Tasks in workstations workstations A 1 B, C 2 E, D, F 3 G 4 H 5
  • 25.
     Calculatethe utilization of the solution  Utilization = Minimum No .of workstations / actual no of workstations x 100 = 4.2 / 5 x 100 = 84 %
  • 26.
    Limitations of LineBalancing  Production lines were designed so that conveyor belts paced the speed of the employees‟ work. This arrangement wasn‟t appreciated by the employees.  Inevitable changes lead to production lines being out of balance.  Rebalancing causes disruptions to production
  • 27.
    Conclusions  The classicexample is Henry Ford‟s auto chassis line. • Before the “assembly line Balancing” was introduced in 1913, each chassis was assembled by one worker and required 12.5 hours. • Once the new technology was installed, this time was reduced to 93 minutes.