Downloaded 100 times

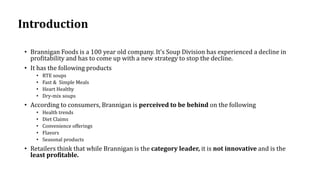
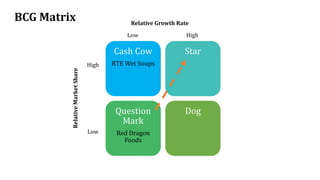
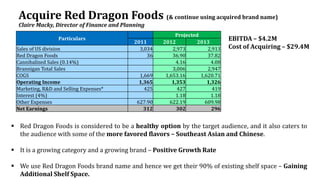
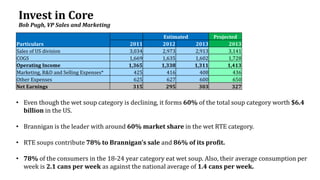
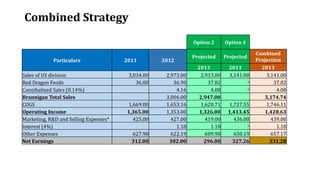

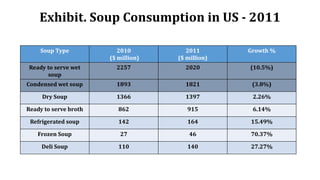
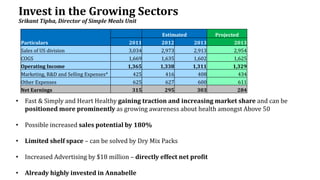

Brannigan Foods, a century-old company, is facing declining profitability in its soup division and is exploring strategies to address this issue, including the acquisition of Red Dragon Foods, which offers healthy options and popular flavors. Despite being the market leader with significant sales in the ready-to-eat soup category, Brannigan is perceived as lacking innovation and struggling to capitalize on health trends. The document outlines various projections and options for growth, including investing in new product development, marketing, and enhancing existing product lines.


