Downloaded 922 times
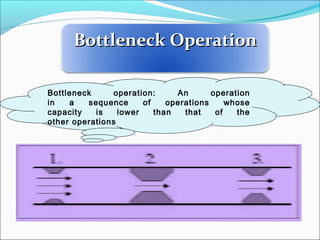


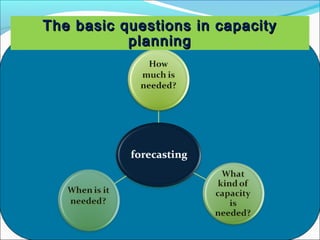

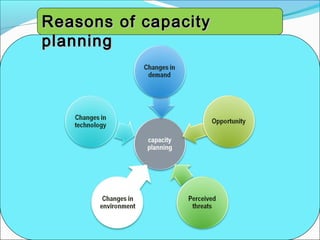

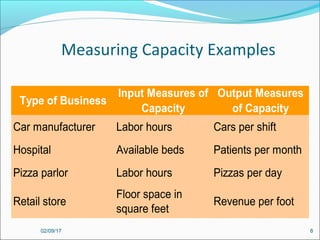
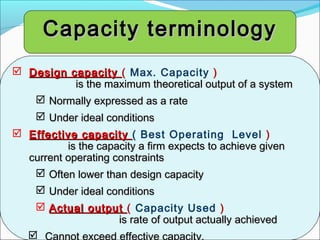
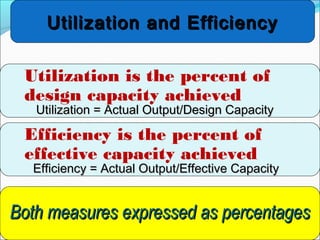


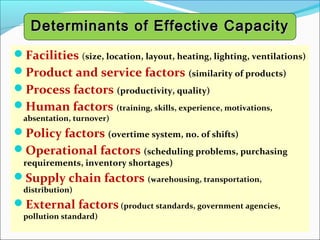
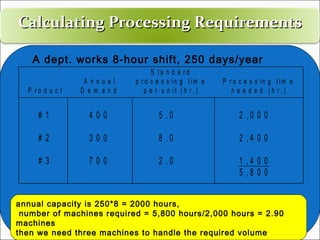


The document discusses capacity planning, highlighting its importance in determining a facility's output rate, ability to meet demand, and overall competitiveness. It defines key terms such as design capacity, effective capacity, and actual output, while also explaining the concepts of utilization and efficiency in measuring capacity. Additionally, it outlines the capacity planning process, determinants of effective capacity, and includes methodologies like cost-volume analysis and waiting-line analysis to assist in decision-making related to capacity constraints.


![Product1 [4] capacity planning](https://cdn.slidesharecdn.com/ss_thumbnails/product14-capacityplanning-190226032041-thumbnail.jpg?width=640&height=640&fit=bounds)


