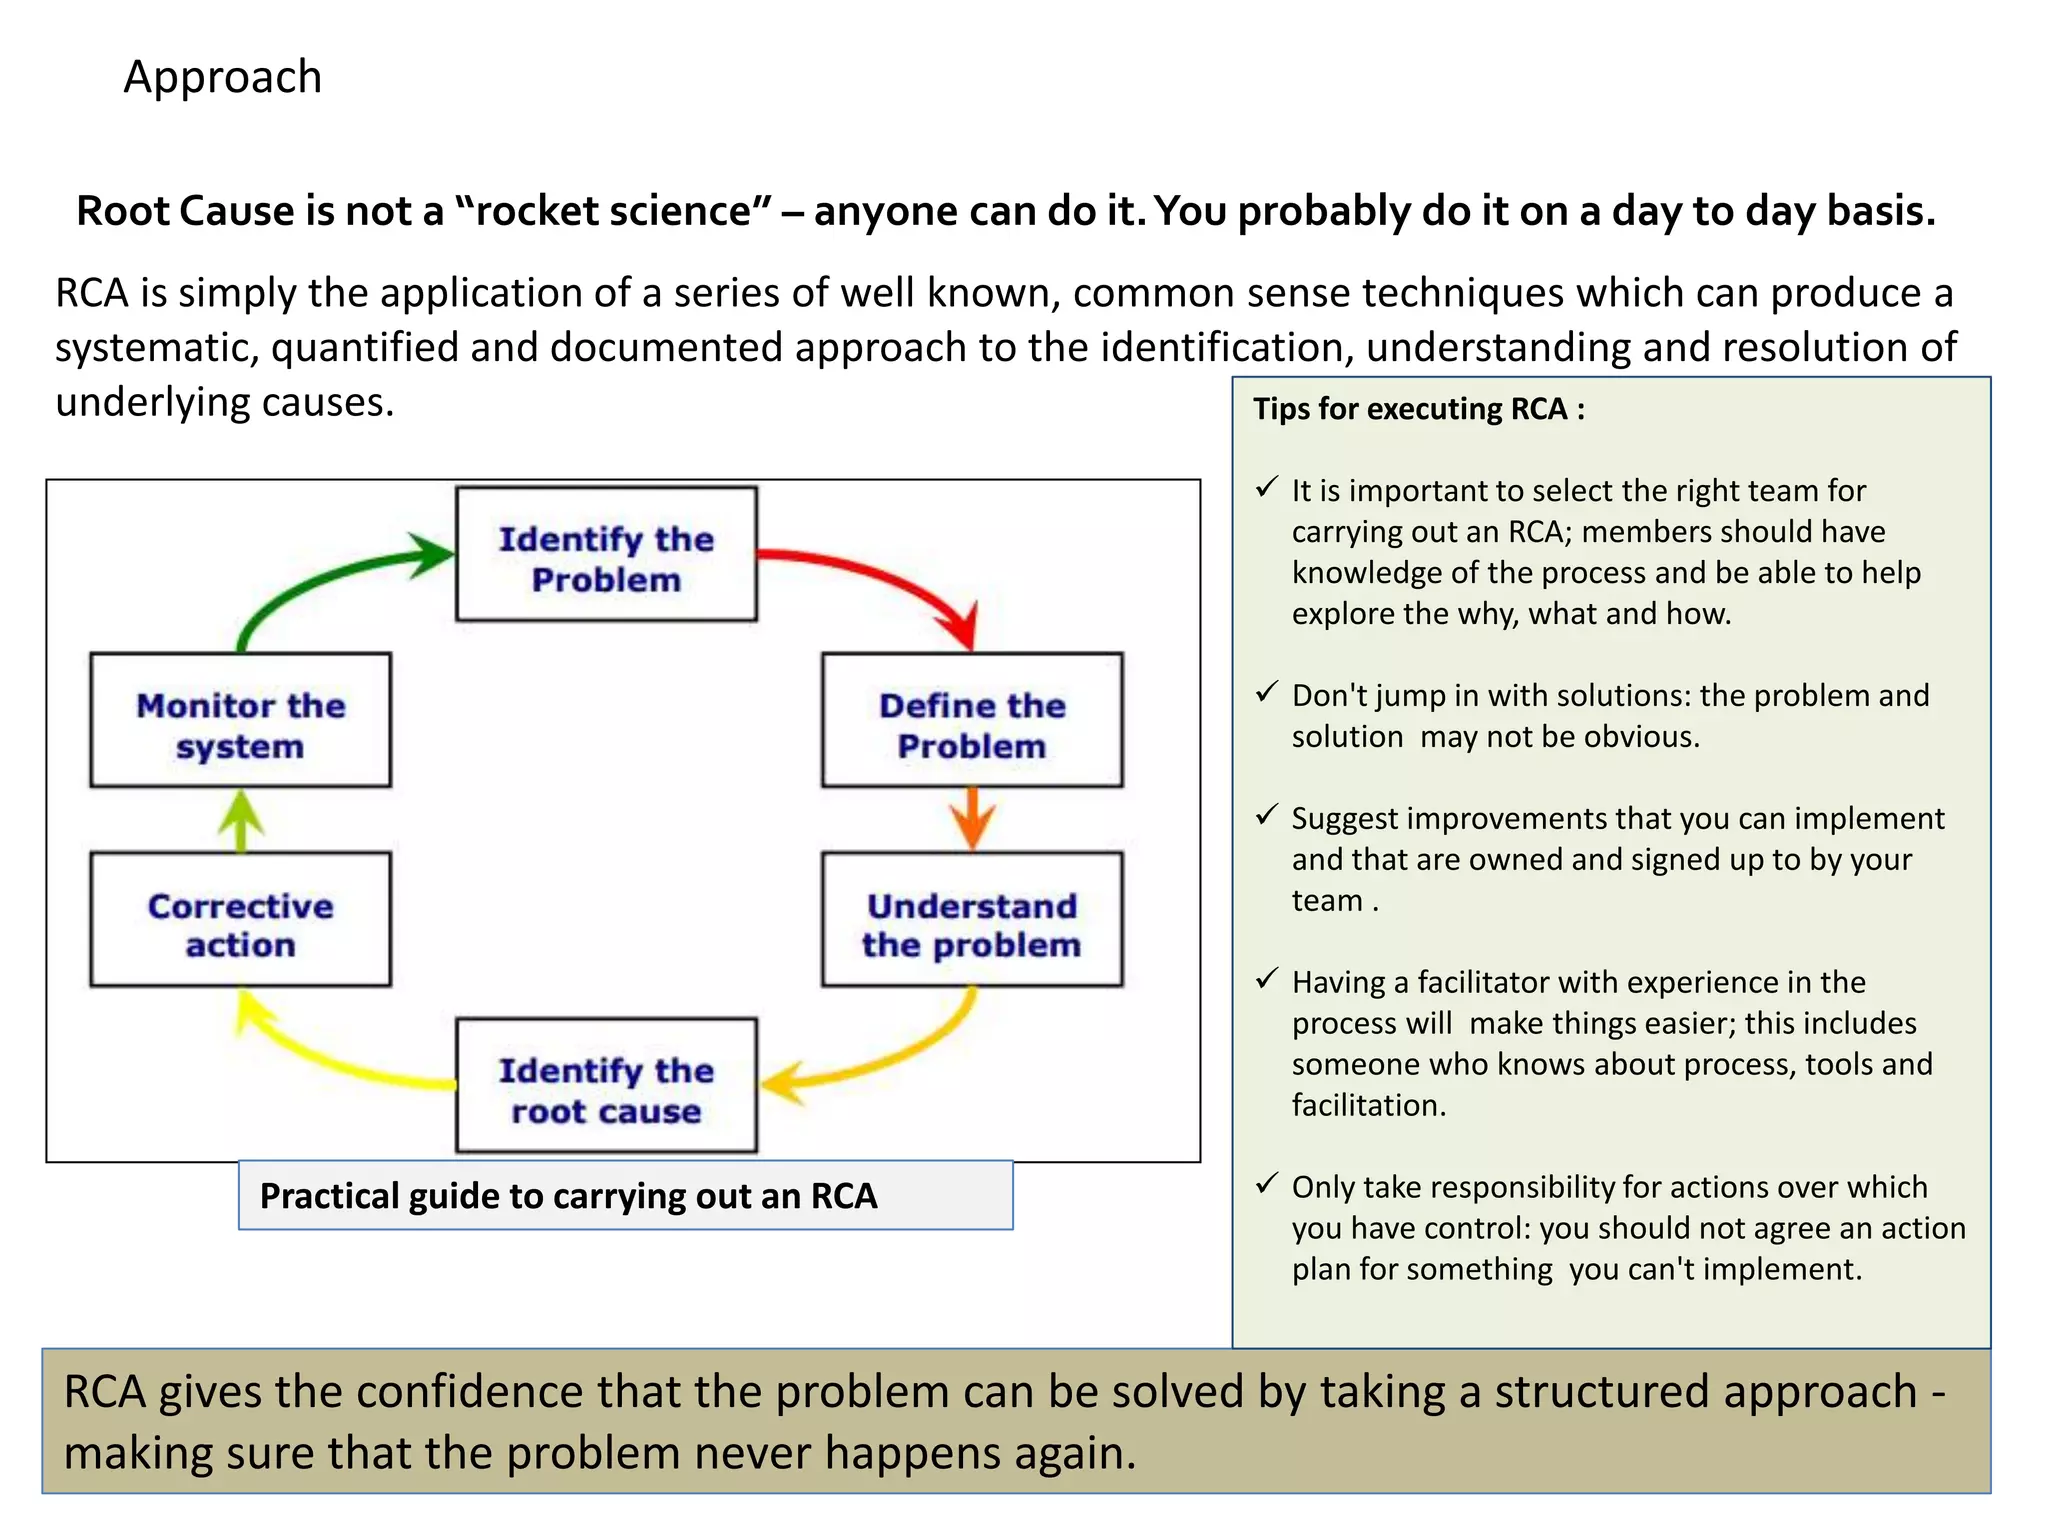
- Root cause analysis (RCA) seeks to identify the underlying cause of a problem by tracing actions back through their effects. This helps determine what happened, why, and how to reduce future recurrence.
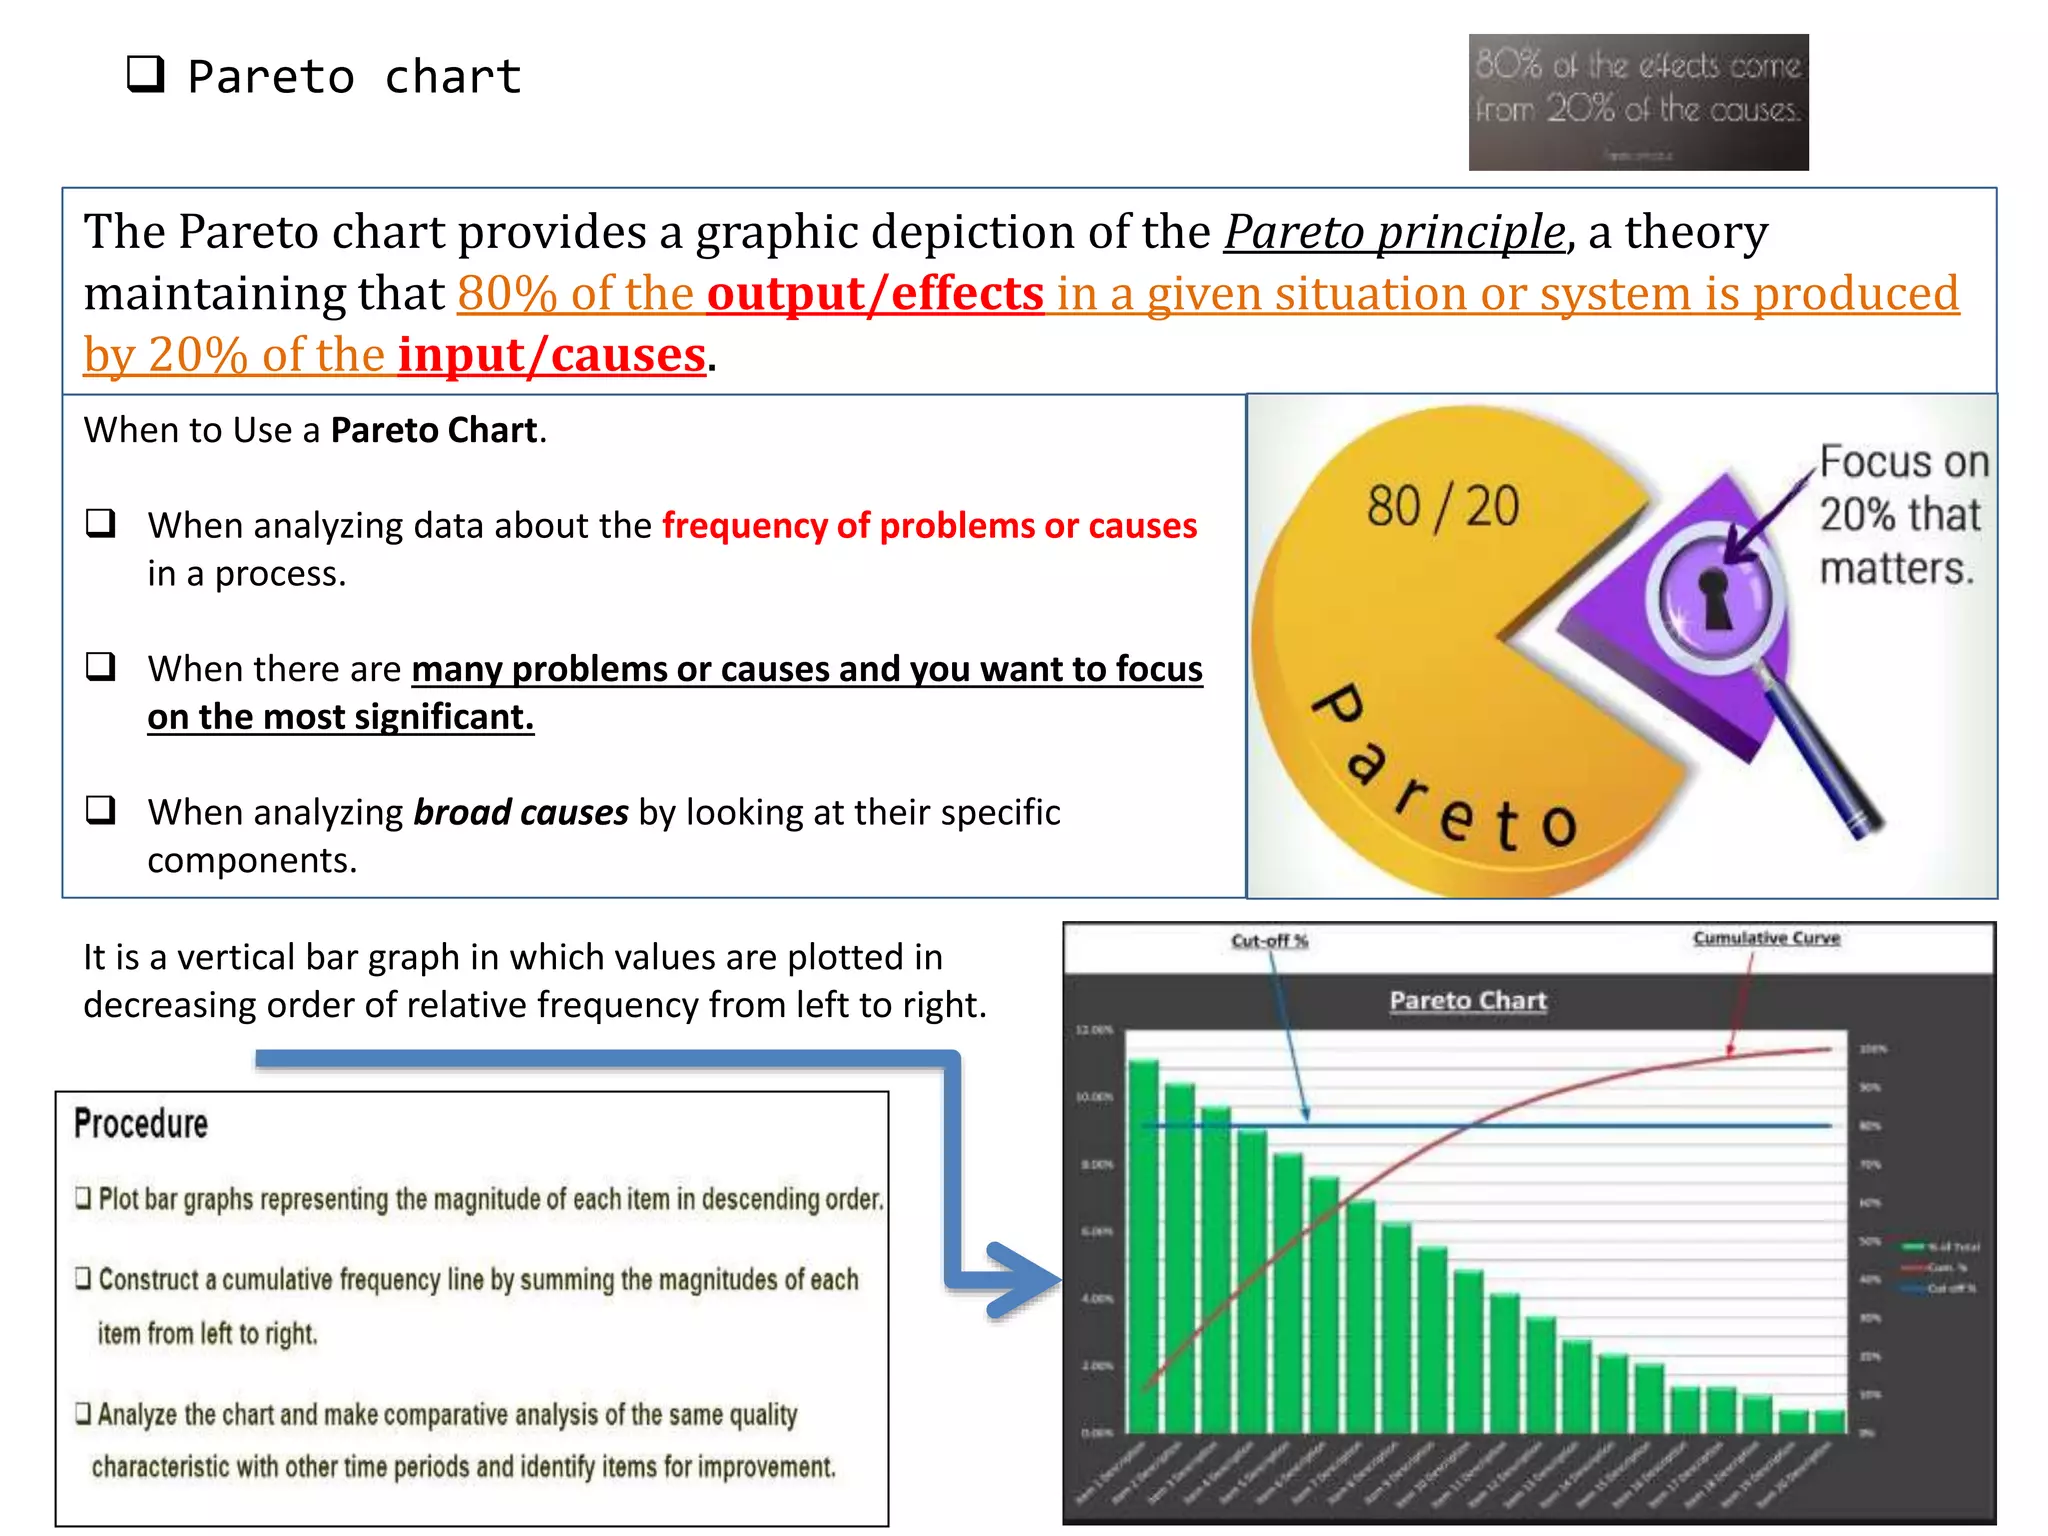
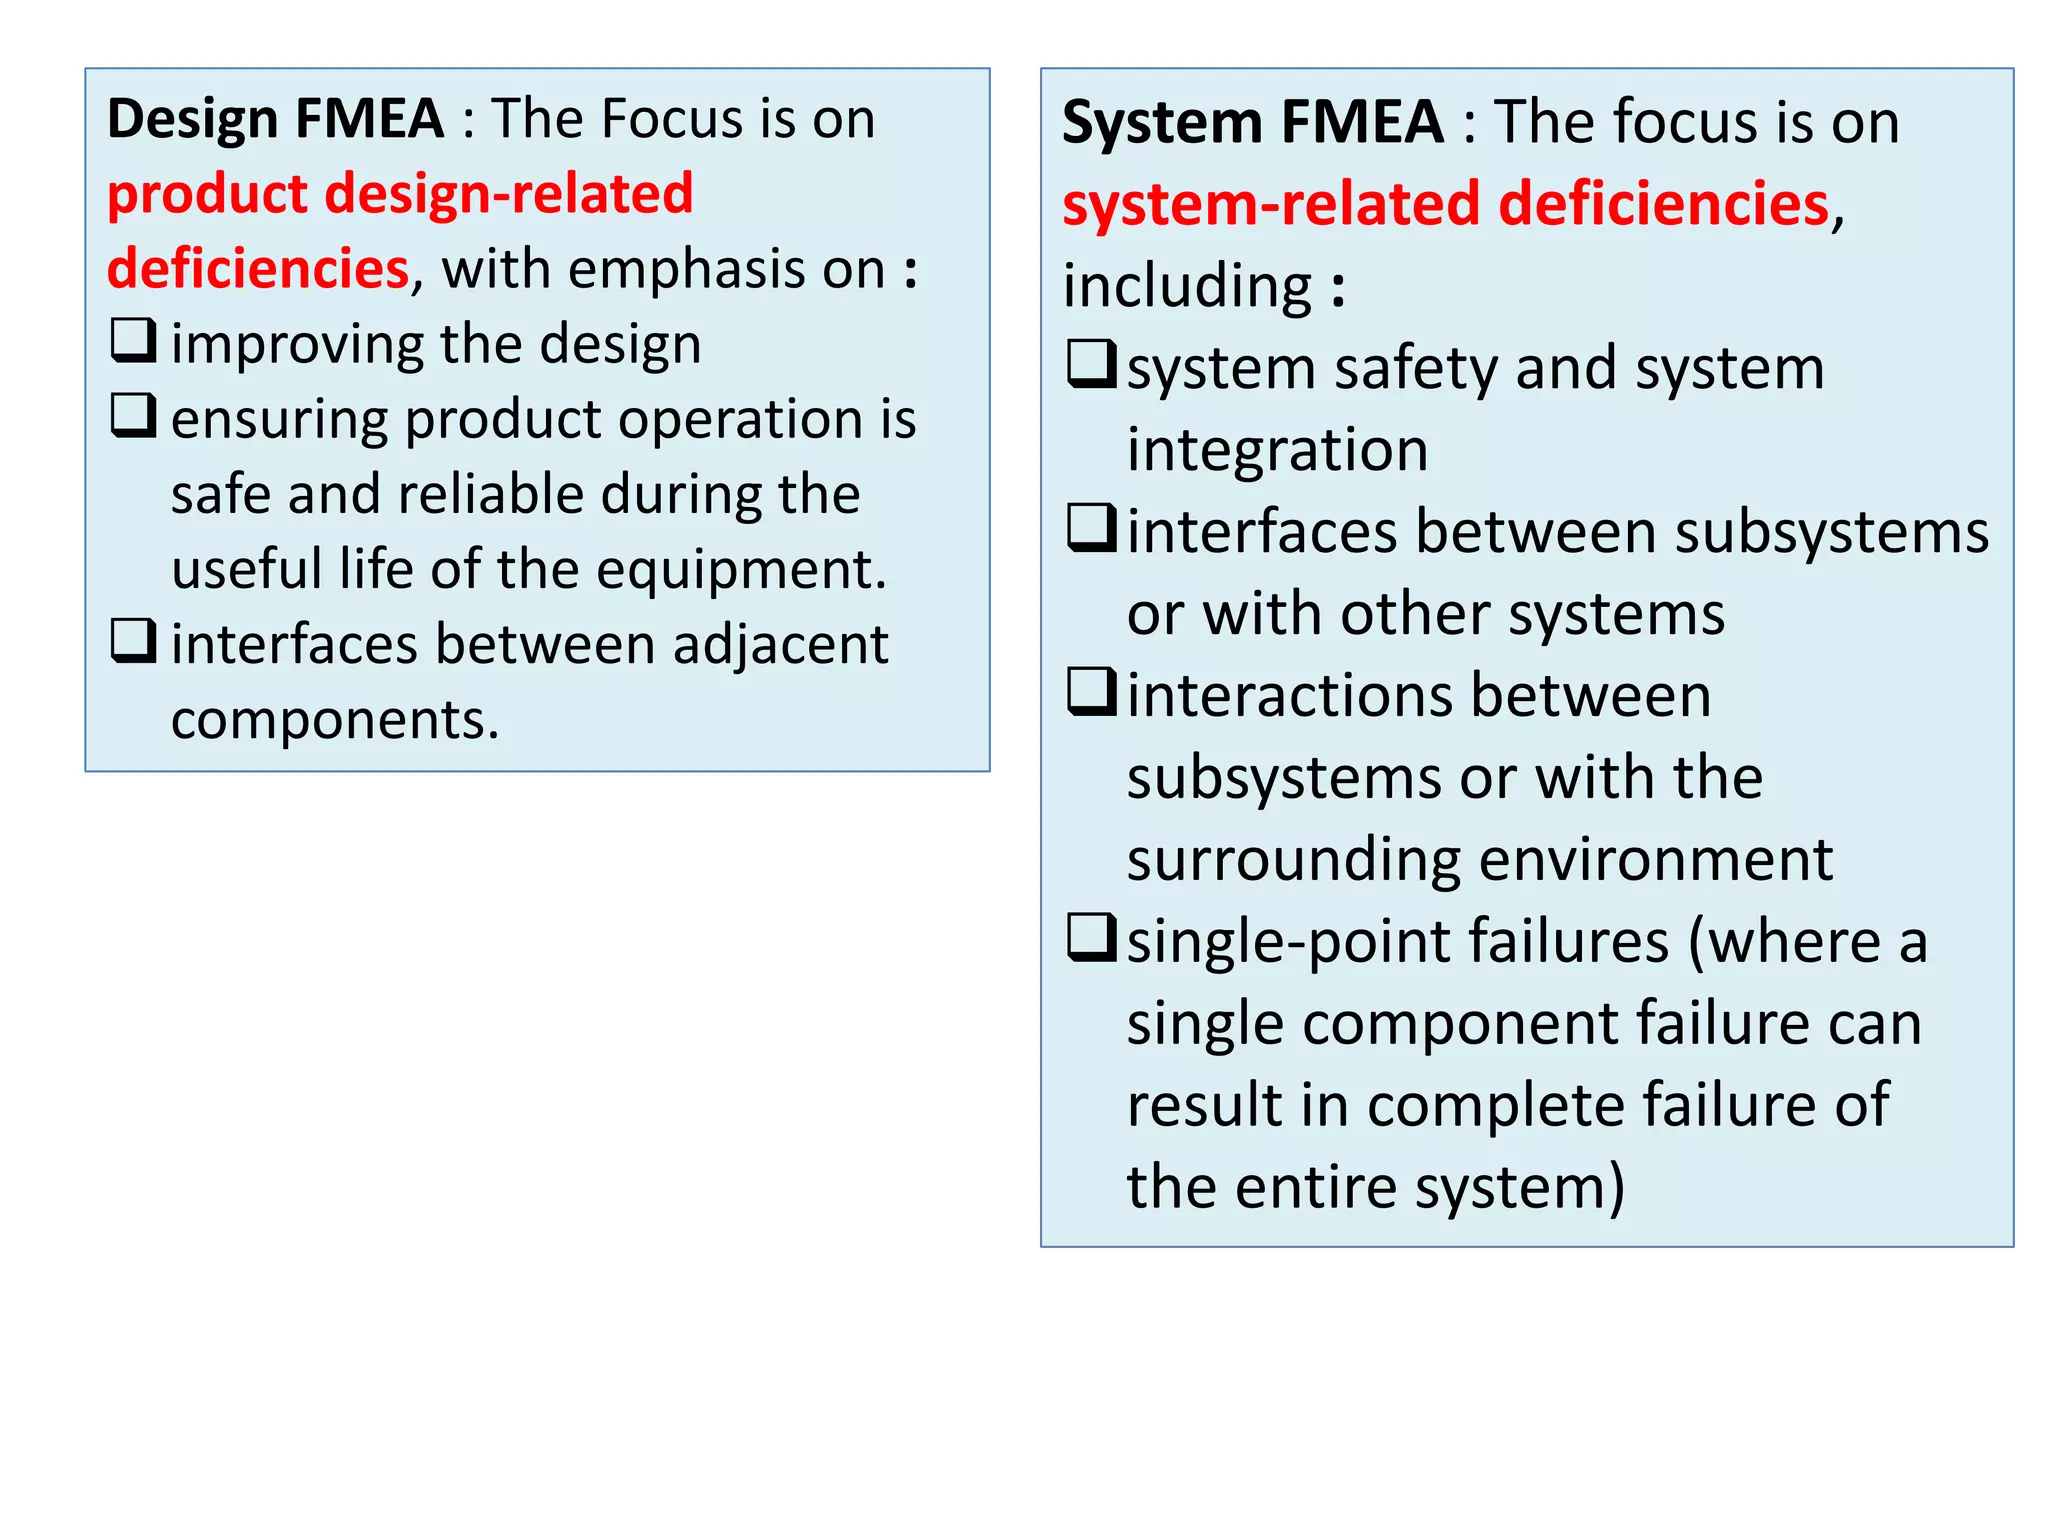
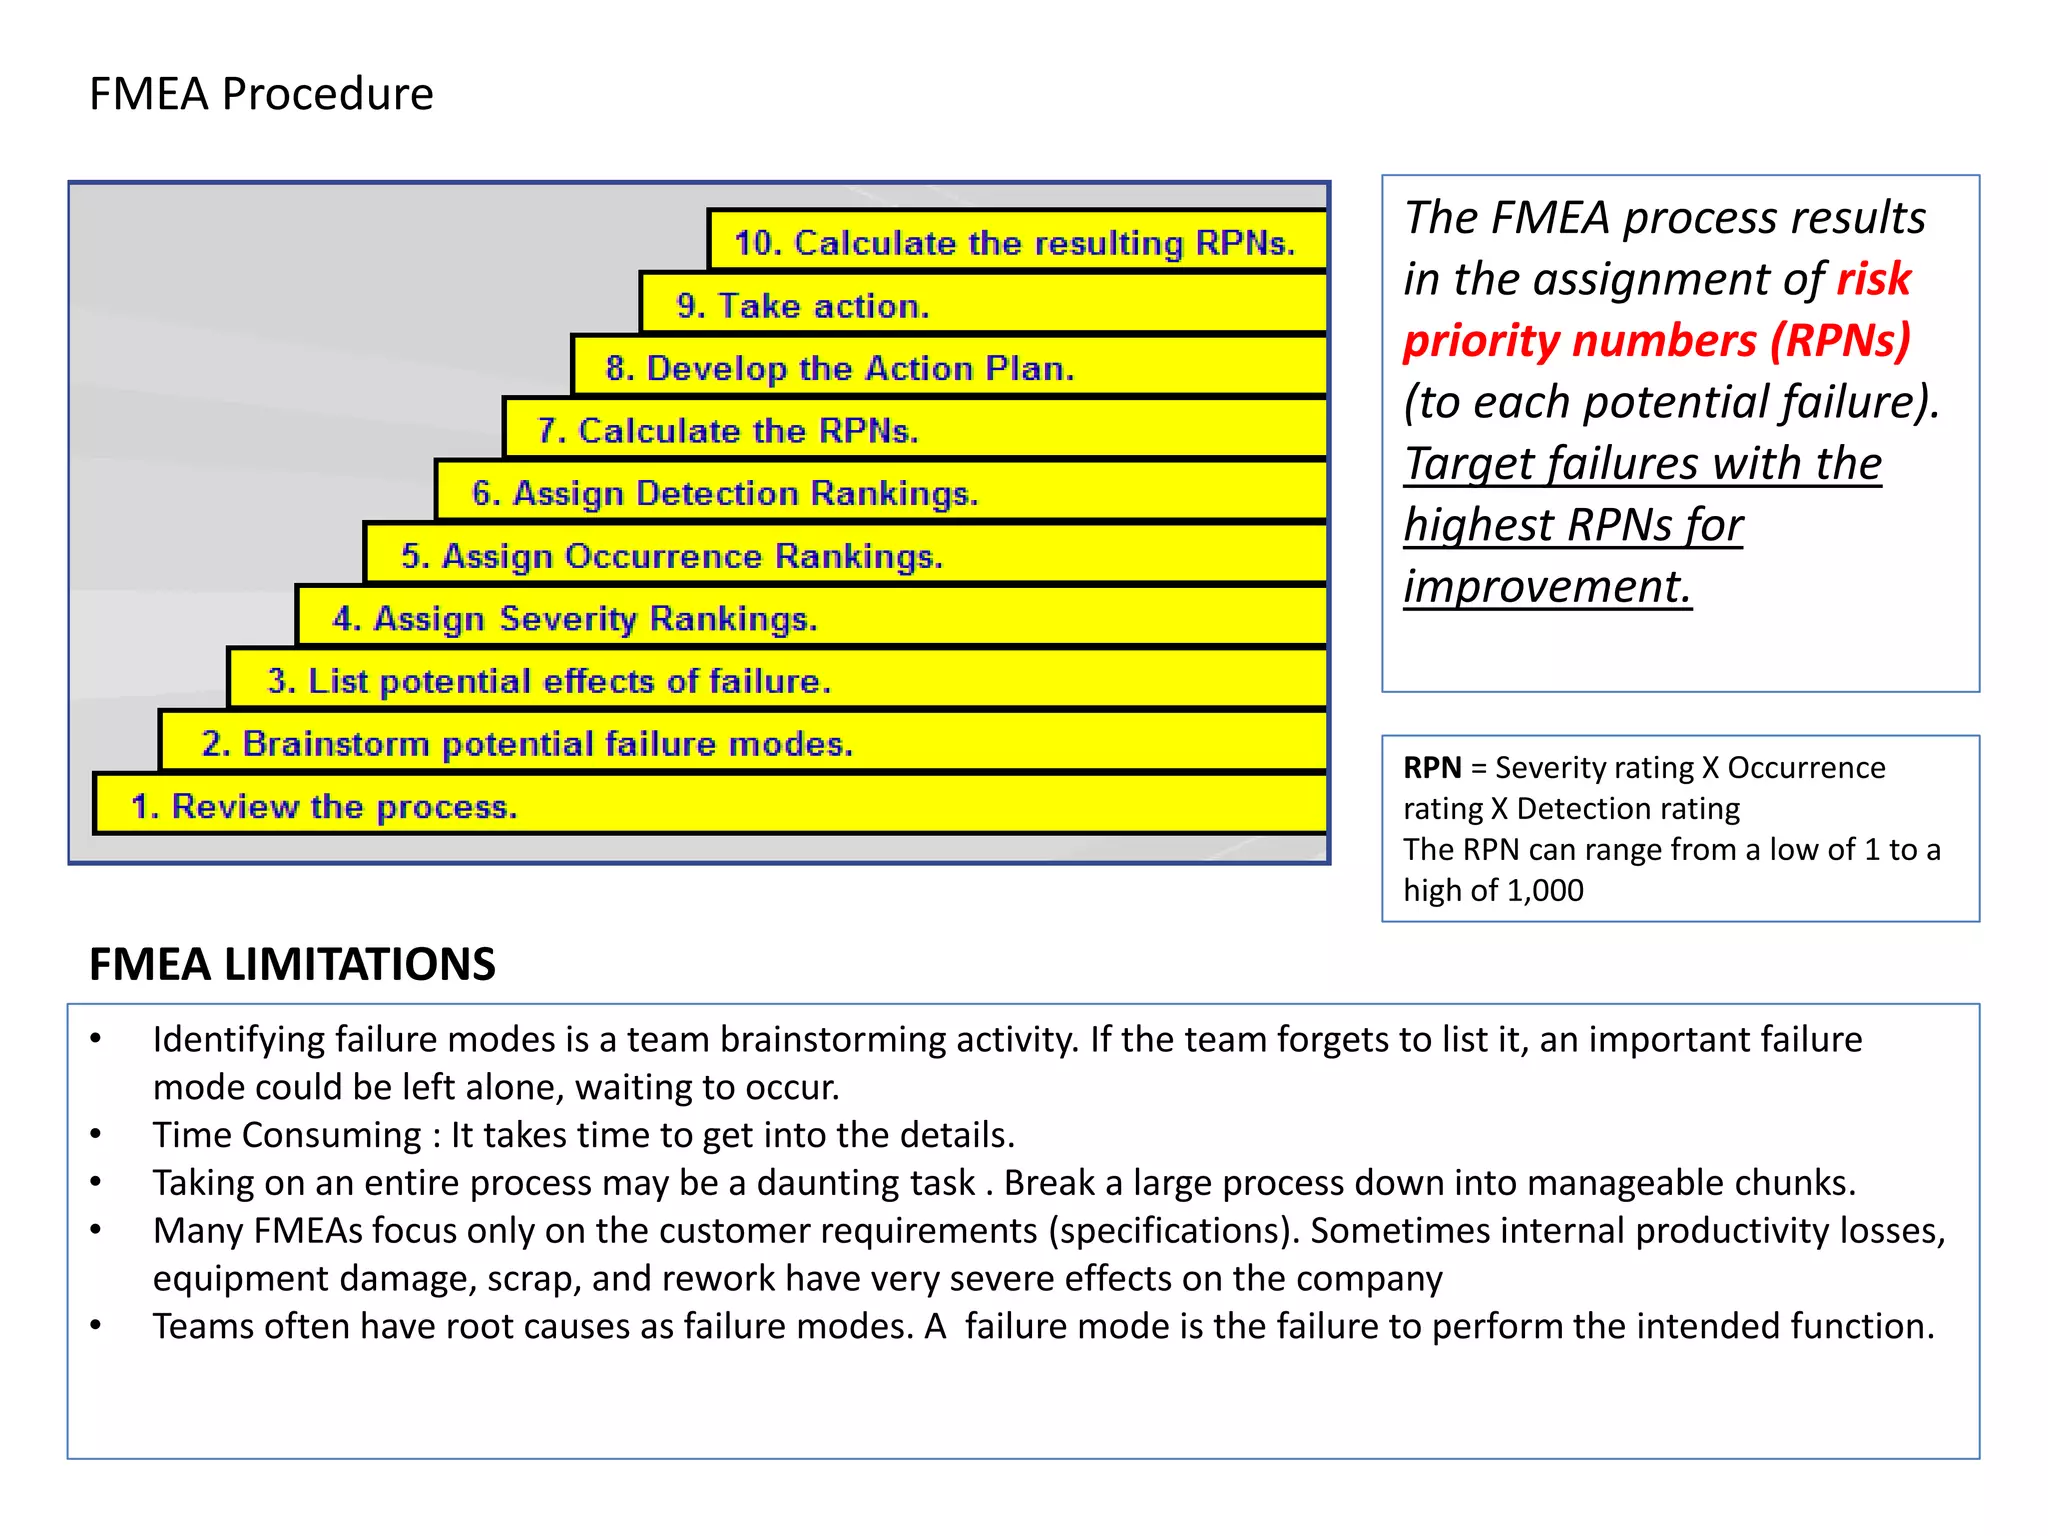
- Key techniques for RCA include the five whys analysis, fishbone diagram, Pareto chart, and failure mode and effects analysis (FMEA). These help structure the analysis and identify multiple contributing causes.
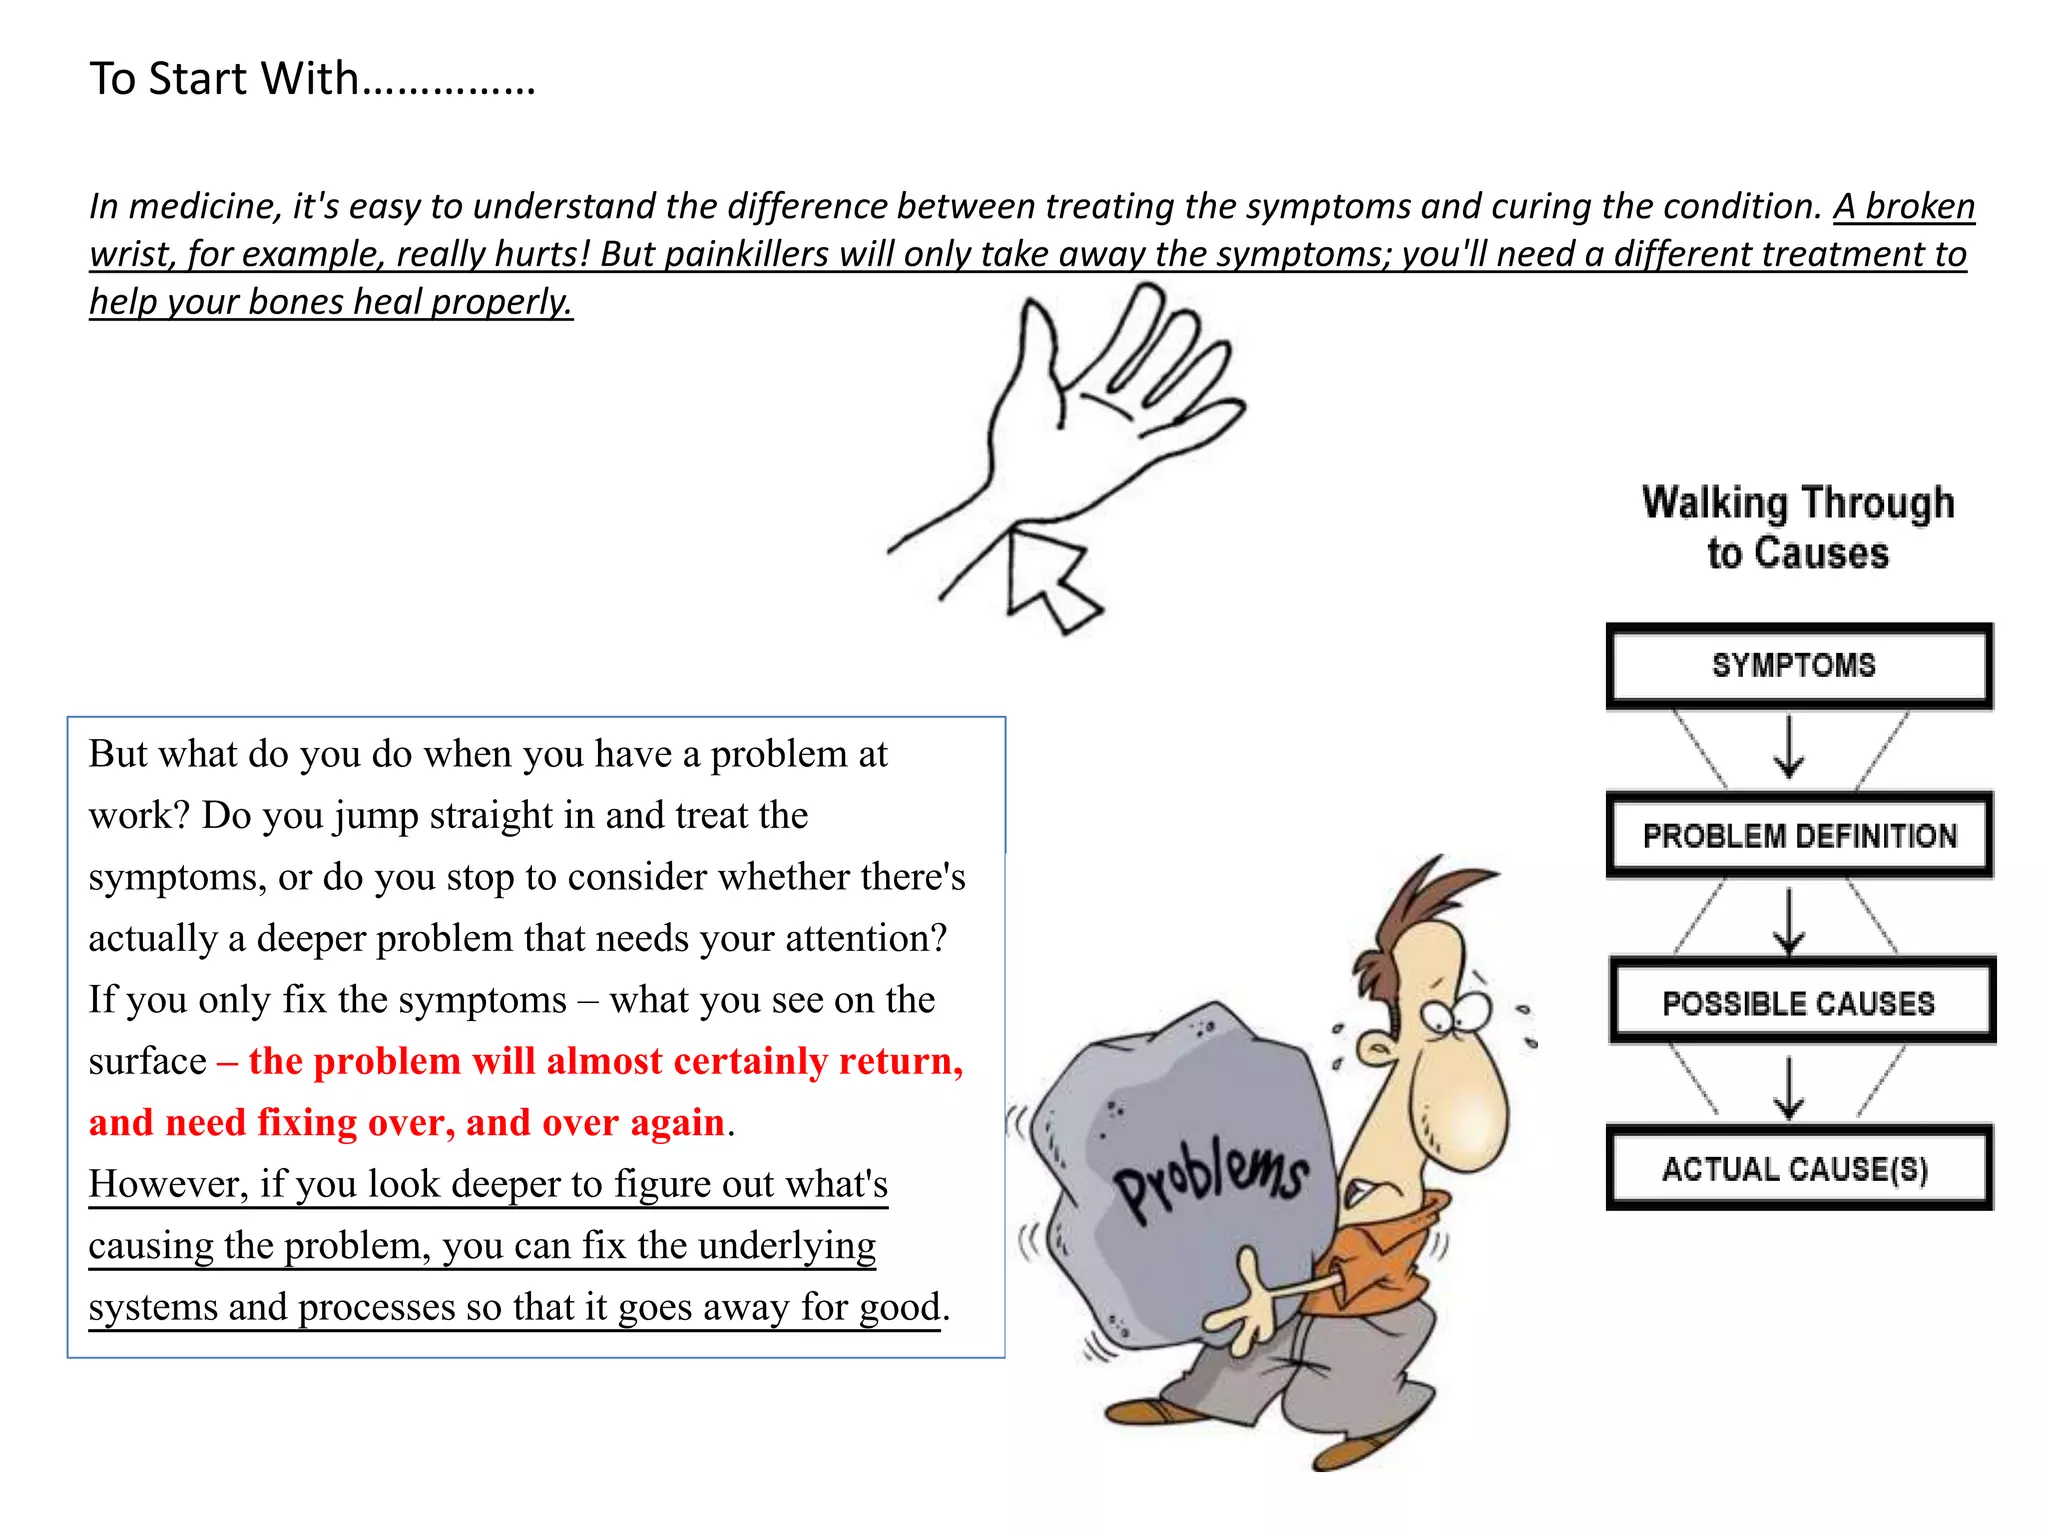
- Proper RCA requires focusing on systems and processes, not just symptoms, to fully address the root causes and prevent problems from recurring.