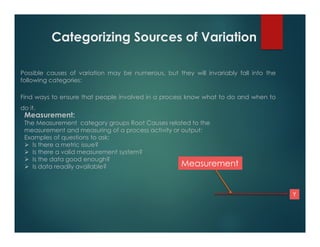
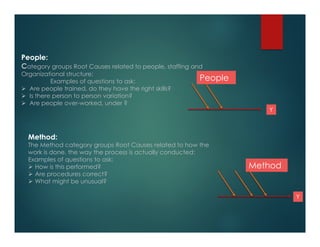
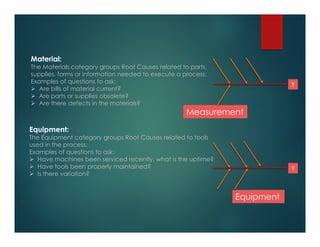
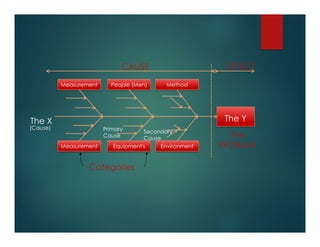
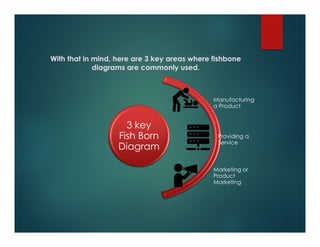
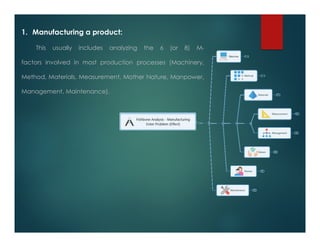
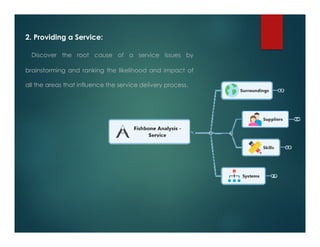
The document discusses cause and effect diagrams, also known as fishbone diagrams. It begins by defining cause and effect diagrams as visual problem-solving tools used to identify the causes of problems in relation to their effects or observed results. It then discusses that Kaoru Ishikawa, a Japanese quality expert, invented the fishbone diagram in 1943 to help engineers understand complex factor relationships. The major purpose of cause and effect diagrams is to generate a comprehensive list of possible causes as an initial step in problem-solving. Finally, it discusses that possible causes can be categorized into sources like measurement, method, people, materials, equipment, and environment when using a fishbone diagram.
This is about HAZOP (Hazard and Operability Study), a risk assessment technique used in various industries.For a detailed training course and certification in HAZOP please visit http://www.abhisam.com/hazop-training-course.html
COEPD - Center of Excellence for Professional Development is a primarily a Business Analyst Training Institute in the IT industry of India head quartered at Hyderabad. COEPD is expert in Business Analyst Training in Hyderabad, Chennai, Pune , Mumbai & Vizag. We offer Business Analyst Training with affordable prices that fit your needs.
COEPD conducts 4-day workshops throughout the year for all participants in various locations i.e. Hyderabad, Pune. The workshops are also conducted on Saturdays and Sundays for the convenience of working professionals.
For More Details Please Contact us:
Visit at http://www.coepd.com or http://www.facebook.com/BusinessAnalystTraining
Center of Excellence for Professional Development
3rd Floor, Sahithi Arcade, S R Nagar,
Hyderabad 500 038, India.
Ph# +91 9000155700,
helpdesk@coepd.com
Ultimate guide about fishbone diagram: definition, benefits, history of fishbone diagram, useful tips to create fishbone diagram and simple methods for cause and effect analysis.
Application of FMEA to a Sterility Testing Isolator: A Case StudyTim Sandle, Ph.D.
Presentation on Failure Modes and Effects Analysis, in the pharmaceutical context. Covering:
Introduction to risk assessment
What are risks?
Advantages and disadvantages of FMEA
Applying FMEA to review a sterility testing isolator – case study
Dear All, This is very comprehensive training on application of 7QC tools in industry. There is now a common demand in every industry to improve and control the process by achieving product quality with integrity. These 7-QC tools are very useful to fulfil industry demand by controlling the process. I am expecting your kind suggestions and comments to improve my presentation further. Thanks a lot everyone for your time to read this presentation. I hope it will definitely give some value addition in your routine life. Thanking you!
A Cause-and-Effect Diagram is a tool that helps identify, sort, and display possible causes of a specific problem or quality characteristic. It graphically illustrates the relationship between a given outcome and all the factors that influence the outcome. This type of diagram is sometimes called an "Ishikawa diagram" because it was invented by Kaoru Ishikawa, or a "fishbone diagram" because of the way it looks.
Cause and Effect Analysis is a technique for identifying all the possible causes (inputs) associated with a particular problem / effect (output) before narrowing down to the small number of main, root causes which need to be addressed.
All decisions are made after drawing a sample from a population. The process of sampling involves risk: risk of deciding that sample is different from population when in fact it is not and risk of concluding that sample is representing population when in fact it is not.
8D Problem Solving WorksheetGroup NumberGroup Member Nam.docxransayo
8D: Problem Solving Worksheet
Group Number:
Group Member Names:
Date:
8-D is a quality management tool and is a vehicle for a team to articulate thoughts and provides scientific determination to details of problems and provide solutions. Organizations can benefit from the 8-D approach by applying it to all areas in the company. The 8-D provides excellent guidelines allowing us to get to the root of a problem and ways to check that the solution actually works. Rather than healing the symptom, the illness is cured, thus, the same problem is unlikely to recur.
Step
0
1
2
3
4
5
6
7
8
Action
The Planning Stage
Establishing the Team
Problem Definition / Statement & Description
Developing Interim Containment Action
Identifying & Verifying Root Cause
Identifying Permanent Corrective Actions (PCA)
Implementing & Validating PCA
Preventing Recurrence
Recognizing Team Efforts
0
The Planning Stage:
The 8-D method of problem solving is appropriate in "cause unknown" situations and is not the right tool if concerns center solely on decision-making or problem prevention. 8-D is especially useful as it results in not just a problem-solving process, but also a standard and a reporting format. Does this problem warrant/require an 8D? If so comment why and proceed.
Is an Emergency Response Action Needed?
(If needed document actions in Action Item Table)
1
Establishing the Team: (Your group is the team)
Establish a small group of people with the process/ product
knowledge, allocated time, authority and skill in the required technical disciplines to solve the problem and implement corrective actions.
Team Goals:
Team Objectives:
First and Last Name (put an asterisk * after the name of the team leader)
Current Job Position
Skills (related to the problem)Years of Hospitality Work Experience
2A
Problem Definition
Provides the starting point for solving the problem. Need to have “correct” problem description to identify causes. Need to use terms that are understood by all.
Sketch / Photo of Problem
Product(s):
Customer(s):
List all of the data and documents that might help you to define the problem more exactly?
Action Plan to collect additional information:
Prepare Process Flow Diagram for problem
use a separate sheet if needed
2B
IS
IS NOT
Who
Who is affected by the problem?
Who first observed the problem?
To whom was the problem reported?
Who is not affected by the problem?
Who did not find the problem?
What
What type of problem is it?
What has the problem (food, service, etc)?
What is happening with the process & with containment?
Do we have physical evidence of the problem?
What does not have the problem?
What could be happening but is not?
What could be the problem but is not?
Why
Why is this a problem (degraded performance)?
Is the process stable?
Why is it not a problem?
Where
Where was the problem observed?
Where does the problem occur?
Where could the problem be located but is not?
Where else could .
THE 5 DIMENSIONS OF PROBLEM SOLVING USING DINNA: CASE STUDY IN THE ELECTRONIC...IJDKP
Based on the principle that perfection is a divine criterion, process management exists on the one hand to
achieve excellence (near perfection) and on the other hand to avoid imperfection. In other words,
Operational Excellence (EO) is one of the approaches, when used rigorously, aims to maximize
performance. Therefore, the mastery of problem solving remains necessary to achieve such performance
level.
There are many tools that we can use whether in continuous improvement for the resolution of chronic
problems (KAIZEN, DMAIC, Lean six sigma…) or in resolution of sporadic defects (8D, PDCA, QRQC
...). However, these methodologies often use the same basic tools (Ishikawa diagram, 5 why, tree of
causes…) to identify potential causes and root causes. This result in three levels of causes: occurrence, no
detection and system.
The research presents the development of DINNA diagram [1] as an effective and efficient process that
links the Ishikawa diagram and the 5 why method to identify the root causes and avoid recurrence. The
ultimate objective is to achieve the same result if two working groups with similar skills analyse the same
problem separately, to achieve this, the consistent application of a robust methodology is required.
Therefore, we are talking about 5 dimensions; occurrence, non-detection, system, effectiveness and
efficiency.
As such, the paper offers a solution that is both effective and efficient to help practitioners of industrial
problem solving avoid missing the real root cause and save costs following a wrong decision.
Root Cause Analysis – A Practice to Understanding and Control the Failure Man...inventionjournals
International Journal of Business and Management Invention (IJBMI) is an international journal intended for professionals and researchers in all fields of Business and Management. IJBMI publishes research articles and reviews within the whole field Business and Management, new teaching methods, assessment, validation and the impact of new technologies and it will continue to provide information on the latest trends and developments in this ever-expanding subject. The publications of papers are selected through double peer reviewed to ensure originality, relevance, and readability. The articles published in our journal can be accessed online.
Explanation of the seven basic tools used to solve a variety of quality-related issues. They are suitable for people with little formal training in statistics.
Corrective and Preventative Action (CAPA) is a system of quality procedures required to eliminate the causes of an existing nonconformity and to prevent recurrence of nonconforming product, processes, and other quality problems.
Invented in the 1930’s by Toyota Founder Kiichiro Toyoda’s father Sakichi and made popular in the 1970s by the Toyota Production System, the 5 Whys strategy involves looking at any problem and asking: “Why?” and “What caused this problem?”
Analyze phase of a six sigma dmaic projectKumar Satyam
The DMAIC is one of Six Sigma's most effective problem-solving methodologies. It is divided into five stages: Define, Measure, Analyze, Improve, and Control. This article will discuss the Analyze phase, which is the third phase of DMAIC. Specifically, we'll discuss what this phase entails and the tools that teams can use to identify potential causes and conduct root cause analysis (RCA).
Systems Design and Workflow
Consider a clinical process or task that you perform on a frequent basis. Do you do it the same every time? Why do you proceed the way you do? Habit? Protocol? Each day nurses complete certain tasks that are considered routine, but have you ever stopped to reflect on why things are done the way they are? Perhaps you have noticed areas where there is a duplication of efforts or an inefficient use of time. Other tasks might pass seamlessly from person to person. In order to design the most efficient flow of work through an organization, it is useful to understand workflow and the ways it can be structured for the most optimal use of time and resources.
Creating a Flowchart
Workflow analysis aims to determine workflow patterns that maximize the effective use of resources and minimize activities that do not add value. There are a variety of tools that can be used to analyze the workflow of processes and clarify potential avenues for eliminating waste. Flowcharts are a basic and commonly used workflow analysis method that can help highlight areas in need of streamlining.
In this Assignment, you select a common event that occurs regularly in your organization and create a flowchart representing the workflow. You analyze the process you have diagrammed and propose changes for improvement.
To prepare:
· Identify a common, simple event that frequently occurs in your organization that you would like to evaluate.
· Consider how you would design a flowchart to represent the current workflow.
· Consider what metrics you would use to determine the effectiveness of the current workflow and identify areas of waste.
To complete:
Write a 3- to 5-page paper which includes the following:
· Create a simple flowchart of the activity you selected. (Review the Sample Workflow of Answering a Telephone in an Office document found in this week’s Learning Resources for an example.)
· Next, in your paper:
o Explain the process you have diagrammed.
o For each step or decision point in the process, identify the following:
§ Who does this step? (It can be several people.)
§ What technology is used?
§ What policies and rules are involved in determining how, when, why, or where the step is executed?
§ What information is needed for the execution of this step?
o Describe the metric that is currently used to measure the soundness of the workflow. Is it effective?
o Describe any areas where improvements could occur and propose changes that could bring about these improvements in the workflow.
o Summarize why it is important to be aware of the flow of an activity.
Learning Resources
Required Readings
McGonigle, D., & Mastrian, K. G. (2015).
Nursing informatics and the foundation of knowledge
(3rd ed.). Burlington, MA: Jones and Bartlett Learning.
Chapter 14, “Nursing Informatics: Improving Workflow .
Artificial intelligence (AI) offers new opportunities to radically reinvent the way we do business. This study explores how CEOs and top decision makers around the world are responding to the transformative potential of AI.
Modern Database Management 12th Global Edition by Hoffer solution manual.docxssuserf63bd7
https://qidiantiku.com/solution-manual-for-modern-database-management-12th-global-edition-by-hoffer.shtml
name:Solution manual for Modern Database Management 12th Global Edition by Hoffer
Edition:12th Global Edition
author:by Hoffer
ISBN:ISBN 10: 0133544613 / ISBN 13: 9780133544619
type:solution manual
format:word/zip
All chapter include
Focusing on what leading database practitioners say are the most important aspects to database development, Modern Database Management presents sound pedagogy, and topics that are critical for the practical success of database professionals. The 12th Edition further facilitates learning with illustrations that clarify important concepts and new media resources that make some of the more challenging material more engaging. Also included are general updates and expanded material in the areas undergoing rapid change due to improved managerial practices, database design tools and methodologies, and database technology.
The Team Member and Guest Experience - Lead and Take Care of your restaurant team. They are the people closest to and delivering Hospitality to your paying Guests!
Make the call, and we can assist you.
408-784-7371
Foodservice Consulting + Design
Oprah Winfrey: A Leader in Media, Philanthropy, and Empowerment | CIO Women M...CIOWomenMagazine
This person is none other than Oprah Winfrey, a highly influential figure whose impact extends beyond television. This article will delve into the remarkable life and lasting legacy of Oprah. Her story serves as a reminder of the importance of perseverance, compassion, and firm determination.
2. Definition
A cause and effect diagram is a visual map that functions as a problem-solving tool. As
the name suggests, its main purpose is to help you identify the cause of a troubling
situation in relation to the effect (or results) you’ve observed.
A fishbone diagram is a visualization tool for categorizing the potential causes of a
problem. This tool is used in order to identify a problem’s root causes. Typically used for
root cause analysis, a fishbone diagram combines the practice of brainstorming with a
type of mind map template. It should be efficient as a test case technique to
determine cause and effect.
3. Inventor
The Cause and Effect Diagram was invented by Professor Kaoru Ishikawa of Tokyo
University, a highly regarded Japanese expert in quality management.
He first used it in 1943 to help explain to a group of engineers at Kawasaki Steel
Works how a complex set of factors could be related to help understand a
problem.
Dr. Kaoru Ishikawa, a Japanese quality control expert, is credited with inventing the
fishbone diagram to help employees avoid solutions that merely address the
symptoms of a much larger problem.
4. The major purpose of the Cause and Effect Diagram is to act as a first step in problem
solving by generating a comprehensive list of possible causes. It can lead to
immediate identification of major causes and point to the potential remedial actions
or, failing this, it may indicate the best potential areas for further exploration and
analysis. At a minimum, preparing a Cause and Effect Diagram will lead to greater
understanding of the problem.
A fishbone diagram is useful in brainstorming sessions to focus conversation.
Purpose
5. Possible causes of variation may be numerous, but they will invariably fall into the
following categories:
Find ways to ensure that people involved in a process know what to do and when to
do it.
Categorizing Sources of Variation
Measurement:
The Measurement category groups Root Causes related to the
measurement and measuring of a process activity or output:
Examples of questions to ask:
Is there a metric issue?
Is there a valid measurement system?
Is the data good enough?
Is data readily available?
Y
Measurement
6. Method:
The Method category groups Root Causes related to how the
work is done, the way the process is actually conducted:
Examples of questions to ask:
How is this performed?
Are procedures correct?
What might be unusual?
Y
Method
People:
Category groups Root Causes related to people, staffing and
Organizational structure:
Examples of questions to ask:
Are people trained, do they have the right skills?
Is there person to person variation?
Are people over-worked, under ?
Y
People
7. Material:
The Materials category groups Root Causes related to parts,
supplies, forms or information needed to execute a process:
Examples of questions to ask:
Are bills of material current?
Are parts or supplies obsolete?
Are there defects in the materials?
Y
Measurement
Equipment:
The Equipment category groups Root Causes related to tools
used in the process:
Examples of questions to ask:
Have machines been serviced recently, what is the uptime?
Have tools been properly maintained?
Is there variation?
Y
Equipment
8. Environment (Mother Nature):
The Environment(Mother Nature) category groups Root Causes related to
our work environment, market conditions and regulatory issues.
Examples of questions to ask:
Is the workplace safe and comfortable?
Are outside regulations impacting the business?
Does the company culture aid the process?
Y
Environment
10. With that in mind, here are 3 key areas where fishbone
diagrams are commonly used.
3 key
Fish Born
Diagram
Manufacturing
a Product
Providing a
Service
Marketing or
Product
Marketing
11. 1. Manufacturing a product:
This usually includes analyzing the 6 (or 8) M-
factors involved in most production processes (Machinery,
Method, Materials, Measurement, Mother Nature, Manpower,
Management, Maintenance).
12. 2. Providing a Service:
Discover the root cause of a service issues by
brainstorming and ranking the likelihood and impact of
all the areas that influence the service delivery process.
13. 3. Marketing or Product Marketing:
Explore the potential causes that might be hindering
your product’s success in the marketplace by exploring
all the areas that influence the adoption of your
products.