Downloaded 108 times

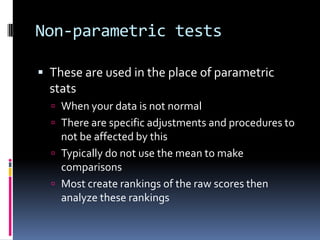
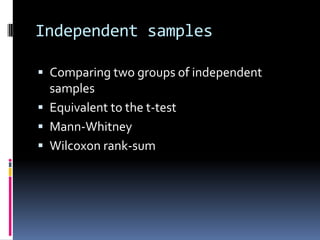
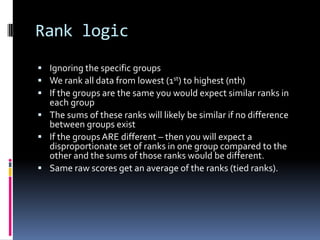
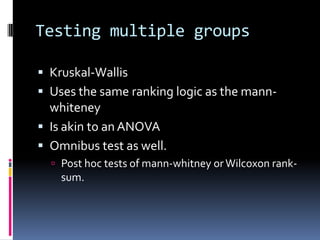
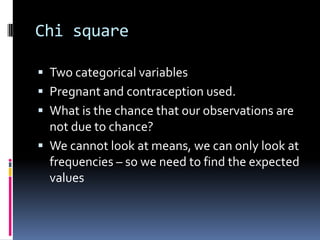
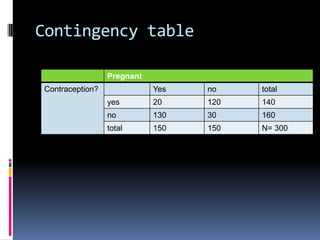
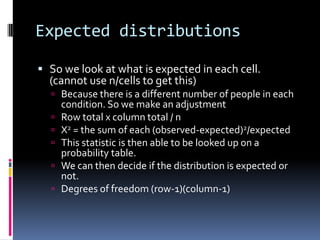
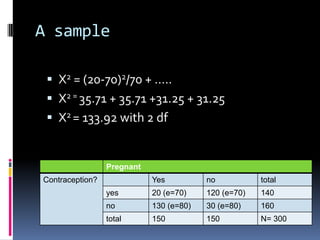

Non-parametric tests are used when data is not normally distributed. They analyze rankings of raw scores rather than means. The Mann-Whitney and Wilcoxon rank-sum tests compare two independent groups and are equivalent to a t-test. They ignore groupings and rank all data points, expecting similar ranks between groups if they are the same. The Kruskal-Wallis test compares multiple groups and is akin to an ANOVA. Chi square examines relationships between categorical variables by comparing observed and expected frequencies in a contingency table to determine if differences are due to chance.