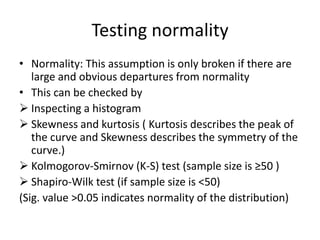
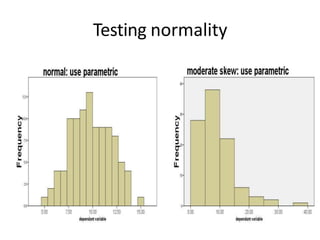
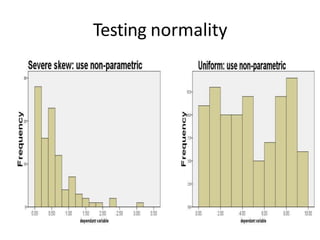
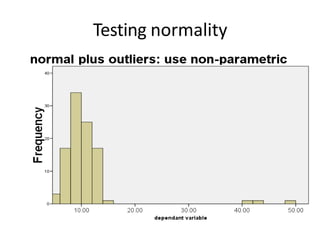
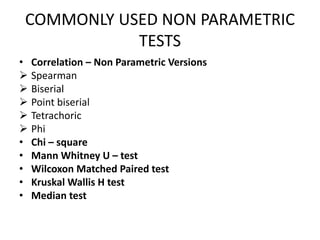
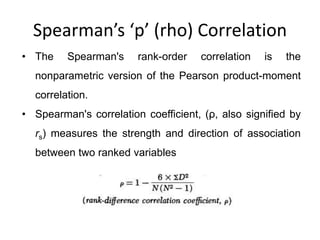
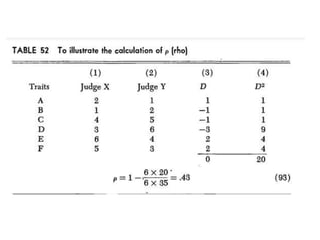
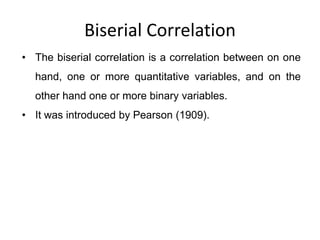
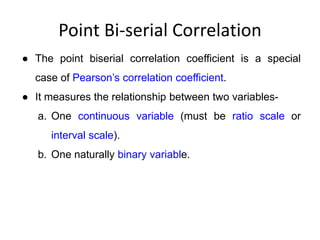
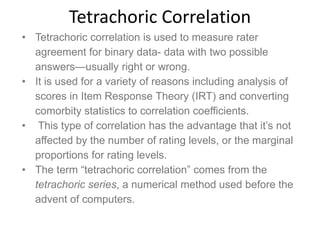
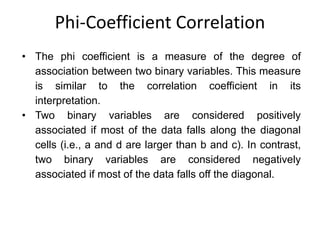
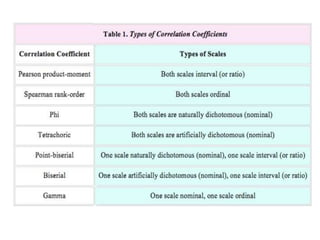
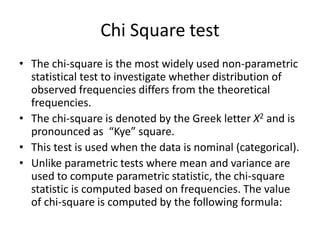
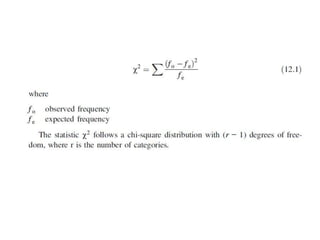
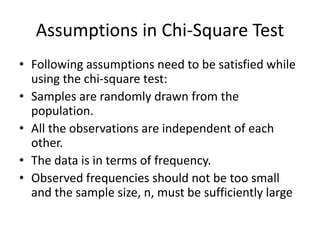
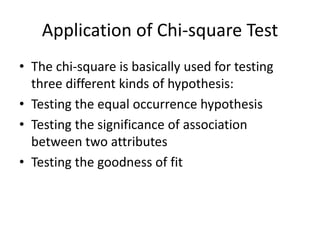
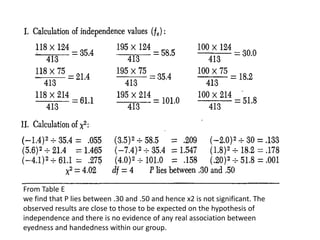
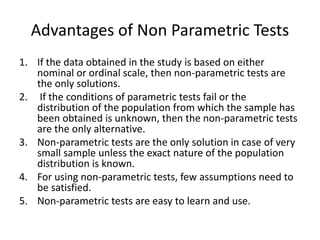
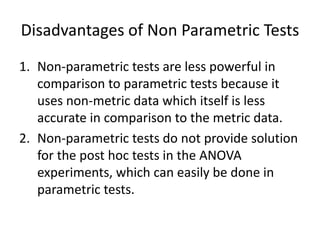
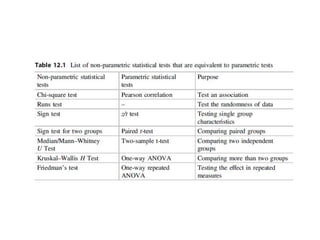
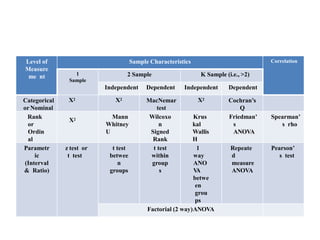
SlideShare a Scribd company logo
UNIT 5
NON PARAMETRIC TESTS
• The general assumptions of parametric tests are
− The populations are normally distributed (follow normal
distribution curve).
− The selected population is representative of
general population
− The data is in interval or ratio scale
• Non-parametric tests can be applied when:
– Data don’t follow any specific distribution and no
assumptions about the population are made
– Data measured on any scale
Testing normality
• Normality: This assumption is only broken if there are
large and obvious departures from normality
• This can be checked by
 Inspecting a histogram
 Skewness and kurtosis ( Kurtosis describes the peak of
the curve and Skewness describes the symmetry of the
curve.)
 Kolmogorov-Smirnov (K-S) test (sample size is ≥50 )
 Shapiro-Wilk test (if sample size is <50)
(Sig. value >0.05 indicates normality of the distribution)
Testing normality
Testing normality
Testing normality
COMMONLY USED NON PARAMETRIC
TESTS
• Correlation – Non Parametric Versions
 Spearman
 Biserial
 Point biserial
 Tetrachoric
 Phi
• Chi – square
• Mann Whitney U – test
• Wilcoxon Matched Paired test
• Kruskal Wallis H test
• Median test
Spearman’s ‘p’ (rho) Correlation
• The Spearman's rank-order correlation is the
nonparametric version of the Pearson product-moment
correlation.
• Spearman's correlation coefficient, (ρ, also signified by
rs) measures the strength and direction of association
between two ranked variables
Biserial Correlation
• The biserial correlation is a correlation between on one
hand, one or more quantitative variables, and on the
other hand one or more binary variables.
• It was introduced by Pearson (1909).
Point Bi-serial Correlation
● The point biserial correlation coefficient is a special
case of Pearson’s correlation coefficient.
● It measures the relationship between two variables-
a. One continuous variable (must be ratio scale or
interval scale).
b. One naturally binary variable.
Tetrachoric Correlation
• Tetrachoric correlation is used to measure rater
agreement for binary data- data with two possible
answers—usually right or wrong.
• It is used for a variety of reasons including analysis of
scores in Item Response Theory (IRT) and converting
comorbity statistics to correlation coefficients.
• This type of correlation has the advantage that it’s not
affected by the number of rating levels, or the marginal
proportions for rating levels.
• The term “tetrachoric correlation” comes from the
tetrachoric series, a numerical method used before the
advent of computers.
Phi-Coefficient Correlation
• The phi coefficient is a measure of the degree of
association between two binary variables. This measure
is similar to the correlation coefficient in its
interpretation.
• Two binary variables are considered positively
associated if most of the data falls along the diagonal
cells (i.e., a and d are larger than b and c). In contrast,
two binary variables are considered negatively
associated if most of the data falls off the diagonal.
Chi Square test
• The chi-square is the most widely used non-parametric
statistical test to investigate whether distribution of
observed frequencies differs from the theoretical
frequencies.
• The chi-square is denoted by the Greek letter X2 and is
pronounced as “Kye” square.
• This test is used when the data is nominal (categorical).
• Unlike parametric tests where mean and variance are
used to compute parametric statistic, the chi-square
statistic is computed based on frequencies. The value
of chi-square is computed by the following formula:
Assumptions in Chi-Square Test
• Following assumptions need to be satisfied while
using the chi-square test:
• Samples are randomly drawn from the
population.
• All the observations are independent of each
other.
• The data is in terms of frequency.
• Observed frequencies should not be too small
and the sample size, n, must be sufficiently large
Application of Chi-square Test
• The chi-square is basically used for testing
three different kinds of hypothesis:
• Testing the equal occurrence hypothesis
• Testing the significance of association
between two attributes
• Testing the goodness of fit
Df = (r-1)(c-1)
Df = (2-1) (3-1) = 2
Thus, df = 2
Chi Square test – Yates’ correction
• Yates’correction: applies when we have two
categories (one degree of freedom)
• Used when sample size is ≥ 40, and
expected frequency of <5 in one cell
• Subtracting 0.5 from the difference between
each observed value and its expected value in
a 2 × 2 contingency table
Chi square – when expected
frequencies are to be calculated
• Here, expected frequencies are to be computed.
• Independence values are represented by the
figures in parentheses within the different cells;
they give the number of people whom we should
expect to find possessing the designated
eyedness and handedness combinations in the
absence of any real association.
• It would be ROW TOTAL * COLUMN TOTAL /
GRAND TOTAL – (of the respective cells)
From Table E
we find that P lies between .30 and .50 and hence x2 is not significant. The
observed results are close to those to be expected on the hypothesis of
independence and there is no evidence of any real association between
eyedness and handedness within our group.
Chi square for 2*2 contingency tables
MANN WHITNEY U TEST
• The Mann–Whitney U test is meant for testing
whether the two samples have been drawn from
the same population.
• This test can be used for parametric as well
asnon-parametric data and therefore it is the
most powerful non-parametric test.
• It can be used more efficiently as an alternative
to the t-test in case one wishes to avoid the
assumptions of t-test like equality of variance and
normality of the population distribution
• The procedure in using Mann–Whitney U test can be explained in the
following steps:
• Combine scores of both the groups (n1 + n2) and arrange them in
ascending order.
• Give the rank to each score in the combined data set.
• If there is a tie, assign each of the tied scores, the average rank which they
jointly occupy. For example, if third and fourth scores are same, then
assign each the rank 3.5(=(3 + 4)/2). Similarly, if second, third and fourth
scores are same, then assign each of them the average rank 3(= 2 + 3 +
4)/3).
• Find R1 and R2, where R1 is the total of all the ranks received by all the
scores in the first group (in the rank assigned jointly) and R2 is the total of
all the ranks received by all the scores in the second group.
• Compute the values of U1 and U2. These values are obtained by the
following formula:
•The smaller value out of U1 and U2 is the value of the test
statistic U.
•Interpretation is done similar to other statistical tests
WILCOXON MATCHED PAIRS TEST
• Also called as the Wilcoxon Signed Rank test.
• Nonparametric equivalent of the Paired
Samples t-test.
• Similar to sign test, but takes into
consideration the magnitude of difference
among the pairs of values.
• Sign test only considers the direction of
difference but not the magnitude of
differences.
Procedure - Wilcoxon Signed Rank Test
KRUSKAL-WALLIS ONE-WAY ANOVA
• This test is used to compare more than two
groups and is the non parametric equivalent to
one-way analysis of variance.
• It is computed exactly like the Mann-Whitney
test, except that there are more groups (>2
groups).
• Applied on independent samples with the same
shape (but not necessarily normal).
• The Krushkal–Wallis test is used when the data
obtained are in terms of ranks or scores based on
subjective judgment.
MEDIAN TEST
• The median test is a two-sample non-parametric test.
• The researcher may like to compare the effects of two
different treatments implemented on two different
samples.
• Further, sample may not always be of the same size.
• In such situations, median test is the most appropriate.
• The median test is used to give information whether
the two independent samples belong to the population
with the same median.
• The procedure involved in the median test can be
described in the following steps:
Advantages of Non Parametric Tests
1. If the data obtained in the study is based on either
nominal or ordinal scale, then non-parametric tests are
the only solutions.
2. If the conditions of parametric tests fail or the
distribution of the population from which the sample has
been obtained is unknown, then the non-parametric tests
are the only alternative.
3. Non-parametric tests are the only solution in case of very
small sample unless the exact nature of the population
distribution is known.
4. For using non-parametric tests, few assumptions need to
be satisfied.
5. Non-parametric tests are easy to learn and use.
Disadvantages of Non Parametric Tests
1. Non-parametric tests are less powerful in
comparison to parametric tests because it
uses non-metric data which itself is less
accurate in comparison to the metric data.
2. Non-parametric tests do not provide solution
for the post hoc tests in the ANOVA
experiments, which can easily be done in
parametric tests.
Level of
Measure
me nt
Sample Characteristics Correlation
1
Sample
2 Sample K Sample (i.e., >2)
Independent Dependent Independent Dependent
Categorical
orNominal
Χ2 Χ2 MacNemar
test
Χ2 Cochran’s
Q
Rank
or
Ordin
al
Χ2 Mann
Whitney
U
Wilcoxo
n
Signed
Rank
Krus
kal
Wallis
H
Friedman’
s
ANOVA
Spearman’
s rho
Parametr
ic
(Interval
& Ratio)
z test or
t test
t test
betwee
n
groups
t test
within
group
s
1
way
ANO
V
A
betwe
en
grou
ps
Repeate
d
measure
ANOVA
Pearson’
s test
Factorial (2 way)ANOVA

More Related Content

Similar to UNIT 5.pptx

Hypothesis Testing.pptx
Hypothesis Testing.pptxHypothesis Testing.pptx
Hypothesis Testing.pptx
RishabhJain661896
 
Statistics
StatisticsStatistics
Summary of statistical tools used in spss
Summary of statistical tools used in spssSummary of statistical tools used in spss
Summary of statistical tools used in spss
Subodh Khanal
 
7- Quantitative Research- Part 3.pdf
7- Quantitative Research- Part 3.pdf7- Quantitative Research- Part 3.pdf
7- Quantitative Research- Part 3.pdf
ezaldeen2013
 
chi_square test.pptx
chi_square test.pptxchi_square test.pptx
chi_square test.pptx
SheetalSardhna
 
F unit 5.pptx
F unit 5.pptxF unit 5.pptx
F unit 5.pptx
agreshgupta
 
Non parametric test
Non parametric testNon parametric test
Non parametric test
gopinathannsriramachandraeduin
 
Parametric Test
Parametric TestParametric Test
Parametric Test
AmritaKumari83
 
Workshop on Data Analysis and Result Interpretation in Social Science Researc...
Workshop on Data Analysis and Result Interpretation in Social Science Researc...Workshop on Data Analysis and Result Interpretation in Social Science Researc...
Workshop on Data Analysis and Result Interpretation in Social Science Researc...
Academy for Higher Education and Social Science Research
 
Biomedical statistics
Biomedical statisticsBiomedical statistics
Biomedical statistics
AbdullaAhmad6
 
Inferential statistics quantitative data - single sample and 2 groups
Inferential statistics   quantitative data - single sample and 2 groupsInferential statistics   quantitative data - single sample and 2 groups
Inferential statistics quantitative data - single sample and 2 groups
Dhritiman Chakrabarti
 
3.1 non parametric test
3.1 non parametric test3.1 non parametric test
3.1 non parametric test
Shital Patil
 
Parametric vs non parametric test
Parametric vs non parametric testParametric vs non parametric test
Parametric vs non parametric test
ar9530
 
Amrita kumari
Amrita kumariAmrita kumari
Amrita kumari
AmritaKumari83
 
CHAPTER 2 - NORM, CORRELATION AND REGRESSION.ppt
CHAPTER 2  - NORM, CORRELATION AND REGRESSION.pptCHAPTER 2  - NORM, CORRELATION AND REGRESSION.ppt
CHAPTER 2 - NORM, CORRELATION AND REGRESSION.ppt
kriti137049
 
Parametric tests seminar
Parametric tests seminarParametric tests seminar
Parametric tests seminardrdeepika87
 
non parametric statistics
non parametric statisticsnon parametric statistics
non parametric statistics
Anchal Garg
 
Nonparametric tests assignment
Nonparametric tests assignmentNonparametric tests assignment
Nonparametric tests assignment
ROOHASHAHID1
 

Similar to UNIT 5.pptx (20)

Hypothesis Testing.pptx
Hypothesis Testing.pptxHypothesis Testing.pptx
Hypothesis Testing.pptx
 
Statistics
StatisticsStatistics
Statistics
 
Summary of statistical tools used in spss
Summary of statistical tools used in spssSummary of statistical tools used in spss
Summary of statistical tools used in spss
 
7- Quantitative Research- Part 3.pdf
7- Quantitative Research- Part 3.pdf7- Quantitative Research- Part 3.pdf
7- Quantitative Research- Part 3.pdf
 
chi_square test.pptx
chi_square test.pptxchi_square test.pptx
chi_square test.pptx
 
F unit 5.pptx
F unit 5.pptxF unit 5.pptx
F unit 5.pptx
 
Statistic and orthodontic by almuzian
Statistic and orthodontic by almuzianStatistic and orthodontic by almuzian
Statistic and orthodontic by almuzian
 
Non parametric test
Non parametric testNon parametric test
Non parametric test
 
Parametric Test
Parametric TestParametric Test
Parametric Test
 
Workshop on Data Analysis and Result Interpretation in Social Science Researc...
Workshop on Data Analysis and Result Interpretation in Social Science Researc...Workshop on Data Analysis and Result Interpretation in Social Science Researc...
Workshop on Data Analysis and Result Interpretation in Social Science Researc...
 
Biomedical statistics
Biomedical statisticsBiomedical statistics
Biomedical statistics
 
Inferential statistics quantitative data - single sample and 2 groups
Inferential statistics   quantitative data - single sample and 2 groupsInferential statistics   quantitative data - single sample and 2 groups
Inferential statistics quantitative data - single sample and 2 groups
 
3.1 non parametric test
3.1 non parametric test3.1 non parametric test
3.1 non parametric test
 
Parametric vs non parametric test
Parametric vs non parametric testParametric vs non parametric test
Parametric vs non parametric test
 
Amrita kumari
Amrita kumariAmrita kumari
Amrita kumari
 
CHAPTER 2 - NORM, CORRELATION AND REGRESSION.ppt
CHAPTER 2  - NORM, CORRELATION AND REGRESSION.pptCHAPTER 2  - NORM, CORRELATION AND REGRESSION.ppt
CHAPTER 2 - NORM, CORRELATION AND REGRESSION.ppt
 
Parametric tests seminar
Parametric tests seminarParametric tests seminar
Parametric tests seminar
 
non parametric statistics
non parametric statisticsnon parametric statistics
non parametric statistics
 
Stats - Intro to Quantitative
Stats -  Intro to Quantitative Stats -  Intro to Quantitative
Stats - Intro to Quantitative
 
Nonparametric tests assignment
Nonparametric tests assignmentNonparametric tests assignment
Nonparametric tests assignment
 

Recently uploaded

Earliest Galaxies in the JADES Origins Field: Luminosity Function and Cosmic ...
Earliest Galaxies in the JADES Origins Field: Luminosity Function and Cosmic ...Earliest Galaxies in the JADES Origins Field: Luminosity Function and Cosmic ...
Earliest Galaxies in the JADES Origins Field: Luminosity Function and Cosmic ...
Sérgio Sacani
 
Richard's entangled aventures in wonderland
Richard's entangled aventures in wonderlandRichard's entangled aventures in wonderland
Richard's entangled aventures in wonderland
Richard Gill
 
Lateral Ventricles.pdf very easy good diagrams comprehensive
Lateral Ventricles.pdf very easy good diagrams comprehensiveLateral Ventricles.pdf very easy good diagrams comprehensive
Lateral Ventricles.pdf very easy good diagrams comprehensive
silvermistyshot
 
GBSN- Microbiology (Lab 3) Gram Staining
GBSN- Microbiology (Lab 3) Gram StainingGBSN- Microbiology (Lab 3) Gram Staining
GBSN- Microbiology (Lab 3) Gram Staining
Areesha Ahmad
 
extra-chromosomal-inheritance[1].pptx.pdfpdf
extra-chromosomal-inheritance[1].pptx.pdfpdfextra-chromosomal-inheritance[1].pptx.pdfpdf
extra-chromosomal-inheritance[1].pptx.pdfpdf
DiyaBiswas10
 
Body fluids_tonicity_dehydration_hypovolemia_hypervolemia.pptx
Body fluids_tonicity_dehydration_hypovolemia_hypervolemia.pptxBody fluids_tonicity_dehydration_hypovolemia_hypervolemia.pptx
Body fluids_tonicity_dehydration_hypovolemia_hypervolemia.pptx
muralinath2
 
Leaf Initiation, Growth and Differentiation.pdf
Leaf Initiation, Growth and Differentiation.pdfLeaf Initiation, Growth and Differentiation.pdf
Leaf Initiation, Growth and Differentiation.pdf
RenuJangid3
 
general properties of oerganologametal.ppt
general properties of oerganologametal.pptgeneral properties of oerganologametal.ppt
general properties of oerganologametal.ppt
IqrimaNabilatulhusni
 
Comparing Evolved Extractive Text Summary Scores of Bidirectional Encoder Rep...
Comparing Evolved Extractive Text Summary Scores of Bidirectional Encoder Rep...Comparing Evolved Extractive Text Summary Scores of Bidirectional Encoder Rep...
Comparing Evolved Extractive Text Summary Scores of Bidirectional Encoder Rep...
University of Maribor
 
SCHIZOPHRENIA Disorder/ Brain Disorder.pdf
SCHIZOPHRENIA Disorder/ Brain Disorder.pdfSCHIZOPHRENIA Disorder/ Brain Disorder.pdf
SCHIZOPHRENIA Disorder/ Brain Disorder.pdf
SELF-EXPLANATORY
 
Circulatory system_ Laplace law. Ohms law.reynaults law,baro-chemo-receptors-...
Circulatory system_ Laplace law. Ohms law.reynaults law,baro-chemo-receptors-...Circulatory system_ Laplace law. Ohms law.reynaults law,baro-chemo-receptors-...
Circulatory system_ Laplace law. Ohms law.reynaults law,baro-chemo-receptors-...
muralinath2
 
platelets- lifespan -Clot retraction-disorders.pptx
platelets- lifespan -Clot retraction-disorders.pptxplatelets- lifespan -Clot retraction-disorders.pptx
platelets- lifespan -Clot retraction-disorders.pptx
muralinath2
 
Comparative structure of adrenal gland in vertebrates
Comparative structure of adrenal gland in vertebratesComparative structure of adrenal gland in vertebrates
Comparative structure of adrenal gland in vertebrates
sachin783648
 
Lab report on liquid viscosity of glycerin
Lab report on liquid viscosity of glycerinLab report on liquid viscosity of glycerin
Lab report on liquid viscosity of glycerin
ossaicprecious19
 
platelets_clotting_biogenesis.clot retractionpptx
platelets_clotting_biogenesis.clot retractionpptxplatelets_clotting_biogenesis.clot retractionpptx
platelets_clotting_biogenesis.clot retractionpptx
muralinath2
 
Richard's aventures in two entangled wonderlands
Richard's aventures in two entangled wonderlandsRichard's aventures in two entangled wonderlands
Richard's aventures in two entangled wonderlands
Richard Gill
 
EY - Supply Chain Services 2018_template.pptx
EY - Supply Chain Services 2018_template.pptxEY - Supply Chain Services 2018_template.pptx
EY - Supply Chain Services 2018_template.pptx
AlguinaldoKong
 
NuGOweek 2024 Ghent - programme - final version
NuGOweek 2024 Ghent - programme - final versionNuGOweek 2024 Ghent - programme - final version
NuGOweek 2024 Ghent - programme - final version
pablovgd
 
4. An Overview of Sugarcane White Leaf Disease in Vietnam.pdf
4. An Overview of Sugarcane White Leaf Disease in Vietnam.pdf4. An Overview of Sugarcane White Leaf Disease in Vietnam.pdf
4. An Overview of Sugarcane White Leaf Disease in Vietnam.pdf
ssuserbfdca9
 
In silico drugs analogue design: novobiocin analogues.pptx
In silico drugs analogue design: novobiocin analogues.pptxIn silico drugs analogue design: novobiocin analogues.pptx
In silico drugs analogue design: novobiocin analogues.pptx
AlaminAfendy1
 

Recently uploaded (20)

Earliest Galaxies in the JADES Origins Field: Luminosity Function and Cosmic ...
Earliest Galaxies in the JADES Origins Field: Luminosity Function and Cosmic ...Earliest Galaxies in the JADES Origins Field: Luminosity Function and Cosmic ...
Earliest Galaxies in the JADES Origins Field: Luminosity Function and Cosmic ...
 
Richard's entangled aventures in wonderland
Richard's entangled aventures in wonderlandRichard's entangled aventures in wonderland
Richard's entangled aventures in wonderland
 
Lateral Ventricles.pdf very easy good diagrams comprehensive
Lateral Ventricles.pdf very easy good diagrams comprehensiveLateral Ventricles.pdf very easy good diagrams comprehensive
Lateral Ventricles.pdf very easy good diagrams comprehensive
 
GBSN- Microbiology (Lab 3) Gram Staining
GBSN- Microbiology (Lab 3) Gram StainingGBSN- Microbiology (Lab 3) Gram Staining
GBSN- Microbiology (Lab 3) Gram Staining
 
extra-chromosomal-inheritance[1].pptx.pdfpdf
extra-chromosomal-inheritance[1].pptx.pdfpdfextra-chromosomal-inheritance[1].pptx.pdfpdf
extra-chromosomal-inheritance[1].pptx.pdfpdf
 
Body fluids_tonicity_dehydration_hypovolemia_hypervolemia.pptx
Body fluids_tonicity_dehydration_hypovolemia_hypervolemia.pptxBody fluids_tonicity_dehydration_hypovolemia_hypervolemia.pptx
Body fluids_tonicity_dehydration_hypovolemia_hypervolemia.pptx
 
Leaf Initiation, Growth and Differentiation.pdf
Leaf Initiation, Growth and Differentiation.pdfLeaf Initiation, Growth and Differentiation.pdf
Leaf Initiation, Growth and Differentiation.pdf
 
general properties of oerganologametal.ppt
general properties of oerganologametal.pptgeneral properties of oerganologametal.ppt
general properties of oerganologametal.ppt
 
Comparing Evolved Extractive Text Summary Scores of Bidirectional Encoder Rep...
Comparing Evolved Extractive Text Summary Scores of Bidirectional Encoder Rep...Comparing Evolved Extractive Text Summary Scores of Bidirectional Encoder Rep...
Comparing Evolved Extractive Text Summary Scores of Bidirectional Encoder Rep...
 
SCHIZOPHRENIA Disorder/ Brain Disorder.pdf
SCHIZOPHRENIA Disorder/ Brain Disorder.pdfSCHIZOPHRENIA Disorder/ Brain Disorder.pdf
SCHIZOPHRENIA Disorder/ Brain Disorder.pdf
 
Circulatory system_ Laplace law. Ohms law.reynaults law,baro-chemo-receptors-...
Circulatory system_ Laplace law. Ohms law.reynaults law,baro-chemo-receptors-...Circulatory system_ Laplace law. Ohms law.reynaults law,baro-chemo-receptors-...
Circulatory system_ Laplace law. Ohms law.reynaults law,baro-chemo-receptors-...
 
platelets- lifespan -Clot retraction-disorders.pptx
platelets- lifespan -Clot retraction-disorders.pptxplatelets- lifespan -Clot retraction-disorders.pptx
platelets- lifespan -Clot retraction-disorders.pptx
 
Comparative structure of adrenal gland in vertebrates
Comparative structure of adrenal gland in vertebratesComparative structure of adrenal gland in vertebrates
Comparative structure of adrenal gland in vertebrates
 
Lab report on liquid viscosity of glycerin
Lab report on liquid viscosity of glycerinLab report on liquid viscosity of glycerin
Lab report on liquid viscosity of glycerin
 
platelets_clotting_biogenesis.clot retractionpptx
platelets_clotting_biogenesis.clot retractionpptxplatelets_clotting_biogenesis.clot retractionpptx
platelets_clotting_biogenesis.clot retractionpptx
 
Richard's aventures in two entangled wonderlands
Richard's aventures in two entangled wonderlandsRichard's aventures in two entangled wonderlands
Richard's aventures in two entangled wonderlands
 
EY - Supply Chain Services 2018_template.pptx
EY - Supply Chain Services 2018_template.pptxEY - Supply Chain Services 2018_template.pptx
EY - Supply Chain Services 2018_template.pptx
 
NuGOweek 2024 Ghent - programme - final version
NuGOweek 2024 Ghent - programme - final versionNuGOweek 2024 Ghent - programme - final version
NuGOweek 2024 Ghent - programme - final version
 
4. An Overview of Sugarcane White Leaf Disease in Vietnam.pdf
4. An Overview of Sugarcane White Leaf Disease in Vietnam.pdf4. An Overview of Sugarcane White Leaf Disease in Vietnam.pdf
4. An Overview of Sugarcane White Leaf Disease in Vietnam.pdf
 
In silico drugs analogue design: novobiocin analogues.pptx
In silico drugs analogue design: novobiocin analogues.pptxIn silico drugs analogue design: novobiocin analogues.pptx
In silico drugs analogue design: novobiocin analogues.pptx
 

UNIT 5.pptx

  • 2. • The general assumptions of parametric tests are − The populations are normally distributed (follow normal distribution curve). − The selected population is representative of general population − The data is in interval or ratio scale
  • 3. • Non-parametric tests can be applied when: – Data don’t follow any specific distribution and no assumptions about the population are made – Data measured on any scale
  • 4. Testing normality • Normality: This assumption is only broken if there are large and obvious departures from normality • This can be checked by  Inspecting a histogram  Skewness and kurtosis ( Kurtosis describes the peak of the curve and Skewness describes the symmetry of the curve.)  Kolmogorov-Smirnov (K-S) test (sample size is ≥50 )  Shapiro-Wilk test (if sample size is <50) (Sig. value >0.05 indicates normality of the distribution)
  • 8. COMMONLY USED NON PARAMETRIC TESTS • Correlation – Non Parametric Versions  Spearman  Biserial  Point biserial  Tetrachoric  Phi • Chi – square • Mann Whitney U – test • Wilcoxon Matched Paired test • Kruskal Wallis H test • Median test
  • 9. Spearman’s ‘p’ (rho) Correlation • The Spearman's rank-order correlation is the nonparametric version of the Pearson product-moment correlation. • Spearman's correlation coefficient, (ρ, also signified by rs) measures the strength and direction of association between two ranked variables
  • 10.
  • 11. Biserial Correlation • The biserial correlation is a correlation between on one hand, one or more quantitative variables, and on the other hand one or more binary variables. • It was introduced by Pearson (1909).
  • 12. Point Bi-serial Correlation ● The point biserial correlation coefficient is a special case of Pearson’s correlation coefficient. ● It measures the relationship between two variables- a. One continuous variable (must be ratio scale or interval scale). b. One naturally binary variable.
  • 13. Tetrachoric Correlation • Tetrachoric correlation is used to measure rater agreement for binary data- data with two possible answers—usually right or wrong. • It is used for a variety of reasons including analysis of scores in Item Response Theory (IRT) and converting comorbity statistics to correlation coefficients. • This type of correlation has the advantage that it’s not affected by the number of rating levels, or the marginal proportions for rating levels. • The term “tetrachoric correlation” comes from the tetrachoric series, a numerical method used before the advent of computers.
  • 14. Phi-Coefficient Correlation • The phi coefficient is a measure of the degree of association between two binary variables. This measure is similar to the correlation coefficient in its interpretation. • Two binary variables are considered positively associated if most of the data falls along the diagonal cells (i.e., a and d are larger than b and c). In contrast, two binary variables are considered negatively associated if most of the data falls off the diagonal.
  • 15.
  • 16. Chi Square test • The chi-square is the most widely used non-parametric statistical test to investigate whether distribution of observed frequencies differs from the theoretical frequencies. • The chi-square is denoted by the Greek letter X2 and is pronounced as “Kye” square. • This test is used when the data is nominal (categorical). • Unlike parametric tests where mean and variance are used to compute parametric statistic, the chi-square statistic is computed based on frequencies. The value of chi-square is computed by the following formula:
  • 17.
  • 18. Assumptions in Chi-Square Test • Following assumptions need to be satisfied while using the chi-square test: • Samples are randomly drawn from the population. • All the observations are independent of each other. • The data is in terms of frequency. • Observed frequencies should not be too small and the sample size, n, must be sufficiently large
  • 19. Application of Chi-square Test • The chi-square is basically used for testing three different kinds of hypothesis: • Testing the equal occurrence hypothesis • Testing the significance of association between two attributes • Testing the goodness of fit
  • 20.
  • 21. Df = (r-1)(c-1) Df = (2-1) (3-1) = 2 Thus, df = 2
  • 22.
  • 23. Chi Square test – Yates’ correction • Yates’correction: applies when we have two categories (one degree of freedom) • Used when sample size is ≥ 40, and expected frequency of <5 in one cell • Subtracting 0.5 from the difference between each observed value and its expected value in a 2 × 2 contingency table
  • 24. Chi square – when expected frequencies are to be calculated
  • 25.
  • 26.
  • 27. • Here, expected frequencies are to be computed. • Independence values are represented by the figures in parentheses within the different cells; they give the number of people whom we should expect to find possessing the designated eyedness and handedness combinations in the absence of any real association. • It would be ROW TOTAL * COLUMN TOTAL / GRAND TOTAL – (of the respective cells)
  • 28. From Table E we find that P lies between .30 and .50 and hence x2 is not significant. The observed results are close to those to be expected on the hypothesis of independence and there is no evidence of any real association between eyedness and handedness within our group.
  • 29. Chi square for 2*2 contingency tables
  • 30.
  • 31. MANN WHITNEY U TEST • The Mann–Whitney U test is meant for testing whether the two samples have been drawn from the same population. • This test can be used for parametric as well asnon-parametric data and therefore it is the most powerful non-parametric test. • It can be used more efficiently as an alternative to the t-test in case one wishes to avoid the assumptions of t-test like equality of variance and normality of the population distribution
  • 32. • The procedure in using Mann–Whitney U test can be explained in the following steps: • Combine scores of both the groups (n1 + n2) and arrange them in ascending order. • Give the rank to each score in the combined data set. • If there is a tie, assign each of the tied scores, the average rank which they jointly occupy. For example, if third and fourth scores are same, then assign each the rank 3.5(=(3 + 4)/2). Similarly, if second, third and fourth scores are same, then assign each of them the average rank 3(= 2 + 3 + 4)/3). • Find R1 and R2, where R1 is the total of all the ranks received by all the scores in the first group (in the rank assigned jointly) and R2 is the total of all the ranks received by all the scores in the second group. • Compute the values of U1 and U2. These values are obtained by the following formula:
  • 33. •The smaller value out of U1 and U2 is the value of the test statistic U. •Interpretation is done similar to other statistical tests
  • 34. WILCOXON MATCHED PAIRS TEST • Also called as the Wilcoxon Signed Rank test. • Nonparametric equivalent of the Paired Samples t-test. • Similar to sign test, but takes into consideration the magnitude of difference among the pairs of values. • Sign test only considers the direction of difference but not the magnitude of differences.
  • 35. Procedure - Wilcoxon Signed Rank Test
  • 36. KRUSKAL-WALLIS ONE-WAY ANOVA • This test is used to compare more than two groups and is the non parametric equivalent to one-way analysis of variance. • It is computed exactly like the Mann-Whitney test, except that there are more groups (>2 groups). • Applied on independent samples with the same shape (but not necessarily normal). • The Krushkal–Wallis test is used when the data obtained are in terms of ranks or scores based on subjective judgment.
  • 37.
  • 38. MEDIAN TEST • The median test is a two-sample non-parametric test. • The researcher may like to compare the effects of two different treatments implemented on two different samples. • Further, sample may not always be of the same size. • In such situations, median test is the most appropriate. • The median test is used to give information whether the two independent samples belong to the population with the same median. • The procedure involved in the median test can be described in the following steps:
  • 39.
  • 40. Advantages of Non Parametric Tests 1. If the data obtained in the study is based on either nominal or ordinal scale, then non-parametric tests are the only solutions. 2. If the conditions of parametric tests fail or the distribution of the population from which the sample has been obtained is unknown, then the non-parametric tests are the only alternative. 3. Non-parametric tests are the only solution in case of very small sample unless the exact nature of the population distribution is known. 4. For using non-parametric tests, few assumptions need to be satisfied. 5. Non-parametric tests are easy to learn and use.
  • 41. Disadvantages of Non Parametric Tests 1. Non-parametric tests are less powerful in comparison to parametric tests because it uses non-metric data which itself is less accurate in comparison to the metric data. 2. Non-parametric tests do not provide solution for the post hoc tests in the ANOVA experiments, which can easily be done in parametric tests.
  • 42.
  • 43. Level of Measure me nt Sample Characteristics Correlation 1 Sample 2 Sample K Sample (i.e., >2) Independent Dependent Independent Dependent Categorical orNominal Χ2 Χ2 MacNemar test Χ2 Cochran’s Q Rank or Ordin al Χ2 Mann Whitney U Wilcoxo n Signed Rank Krus kal Wallis H Friedman’ s ANOVA Spearman’ s rho Parametr ic (Interval & Ratio) z test or t test t test betwee n groups t test within group s 1 way ANO V A betwe en grou ps Repeate d measure ANOVA Pearson’ s test Factorial (2 way)ANOVA