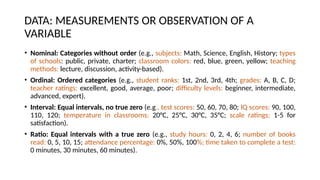
Nominal: Categories without order (e.g., subjects: Math, Science, English, History; types of schools: public, private, charter; classroom colors: red, blue, green, yellow; teaching methods: lecture, discussion, activity-based).
Ordinal: Ordered categories (e.g., student ranks: 1st, 2nd, 3rd, 4th; grades: A, B, C, D; teacher ratings: excellent, good, average, poor; difficulty levels: beginner, intermediate, advanced, expert).
Interval: Equal intervals, no true zero (e.g., test scores: 50, 60, 70, 80; IQ scores: 90, 100, 110, 120; temperature in classrooms: 20°C, 25°C, 30°C, 35°C; scale ratings: 1-5 for satisfaction).
Ratio: Equal intervals with a true zero (e.g., study hours: 0, 2, 4, 6; number of books read: 0, 5, 10, 15; attendance percentage: 0%, 50%, 100%; time taken to complete a test: 0 minutes, 30 minutes, 60 minutes).