Downloaded 788 times
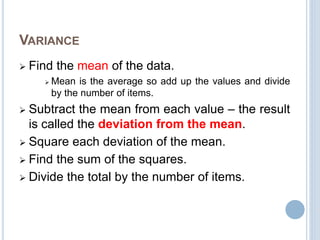
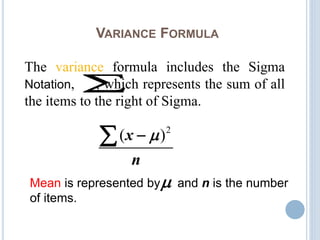
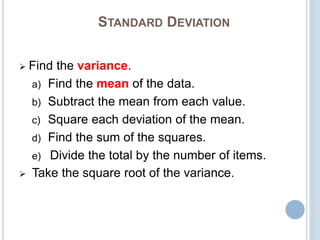
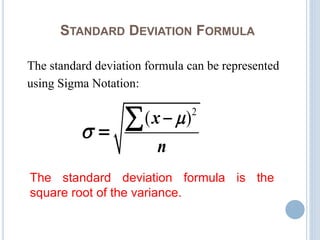
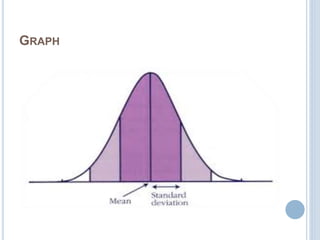
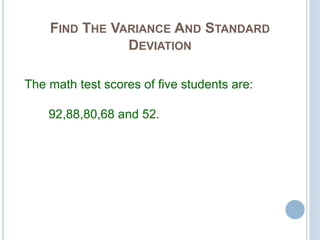
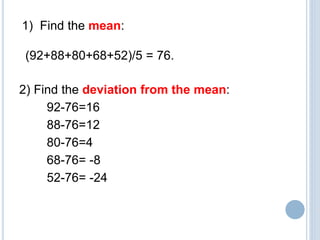
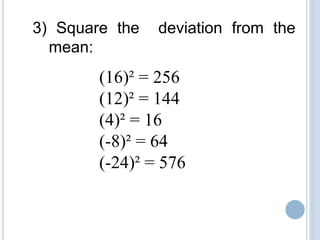
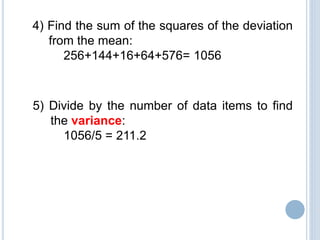
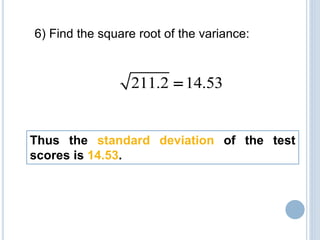


This document discusses variance and standard deviation. It defines variance as the average squared deviation from the mean of a data set. Standard deviation measures how spread out numbers are from the mean and is calculated by taking the square root of the variance. The document provides step-by-step instructions for calculating both variance and standard deviation, including examples using test score data.