Downloaded 1,258 times

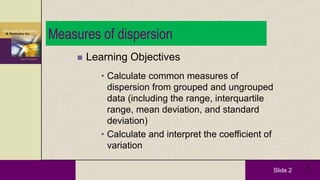


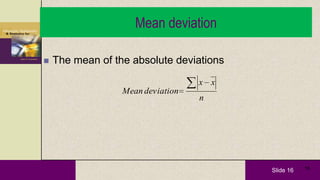
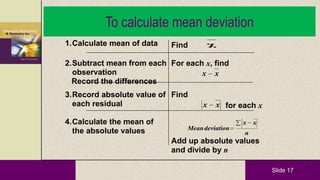
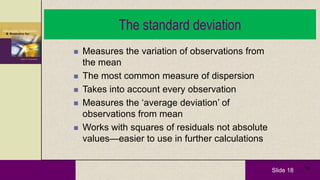
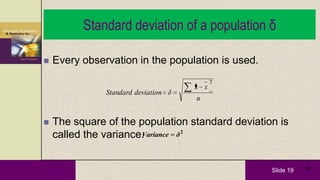
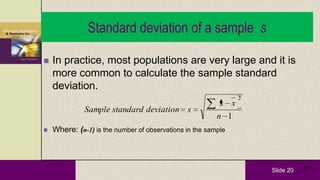
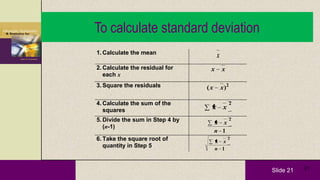
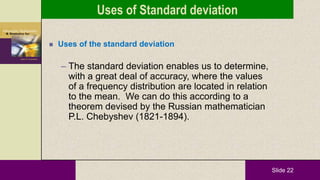
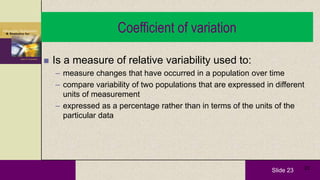


This document discusses various measures of dispersion used in statistics. It begins by stating the learning objectives are to calculate common measures of dispersion from grouped and ungrouped data, including range, interquartile range, mean deviation, and standard deviation. It then defines dispersion as the scatteredness of data around the average and explains why measures of dispersion are needed, such as to determine the reliability of an average. The document proceeds to explain different measures of dispersion like range, interquartile range, mean deviation, and standard deviation. It concludes by stating that while no single measure is ideal, the standard deviation is the most important as it is most frequently used and considers the value of every observation.


![CASE_PRESENTATION_ON_subdural_hematoma(SDH)[1 FINAL PPT]-1.pptx](https://cdn.slidesharecdn.com/ss_thumbnails/casepresentationonsubduralhematomasdh1finalppt-1-260129172522-d405d375-thumbnail.jpg?width=640&height=640&fit=bounds)


