Downloaded 526 times

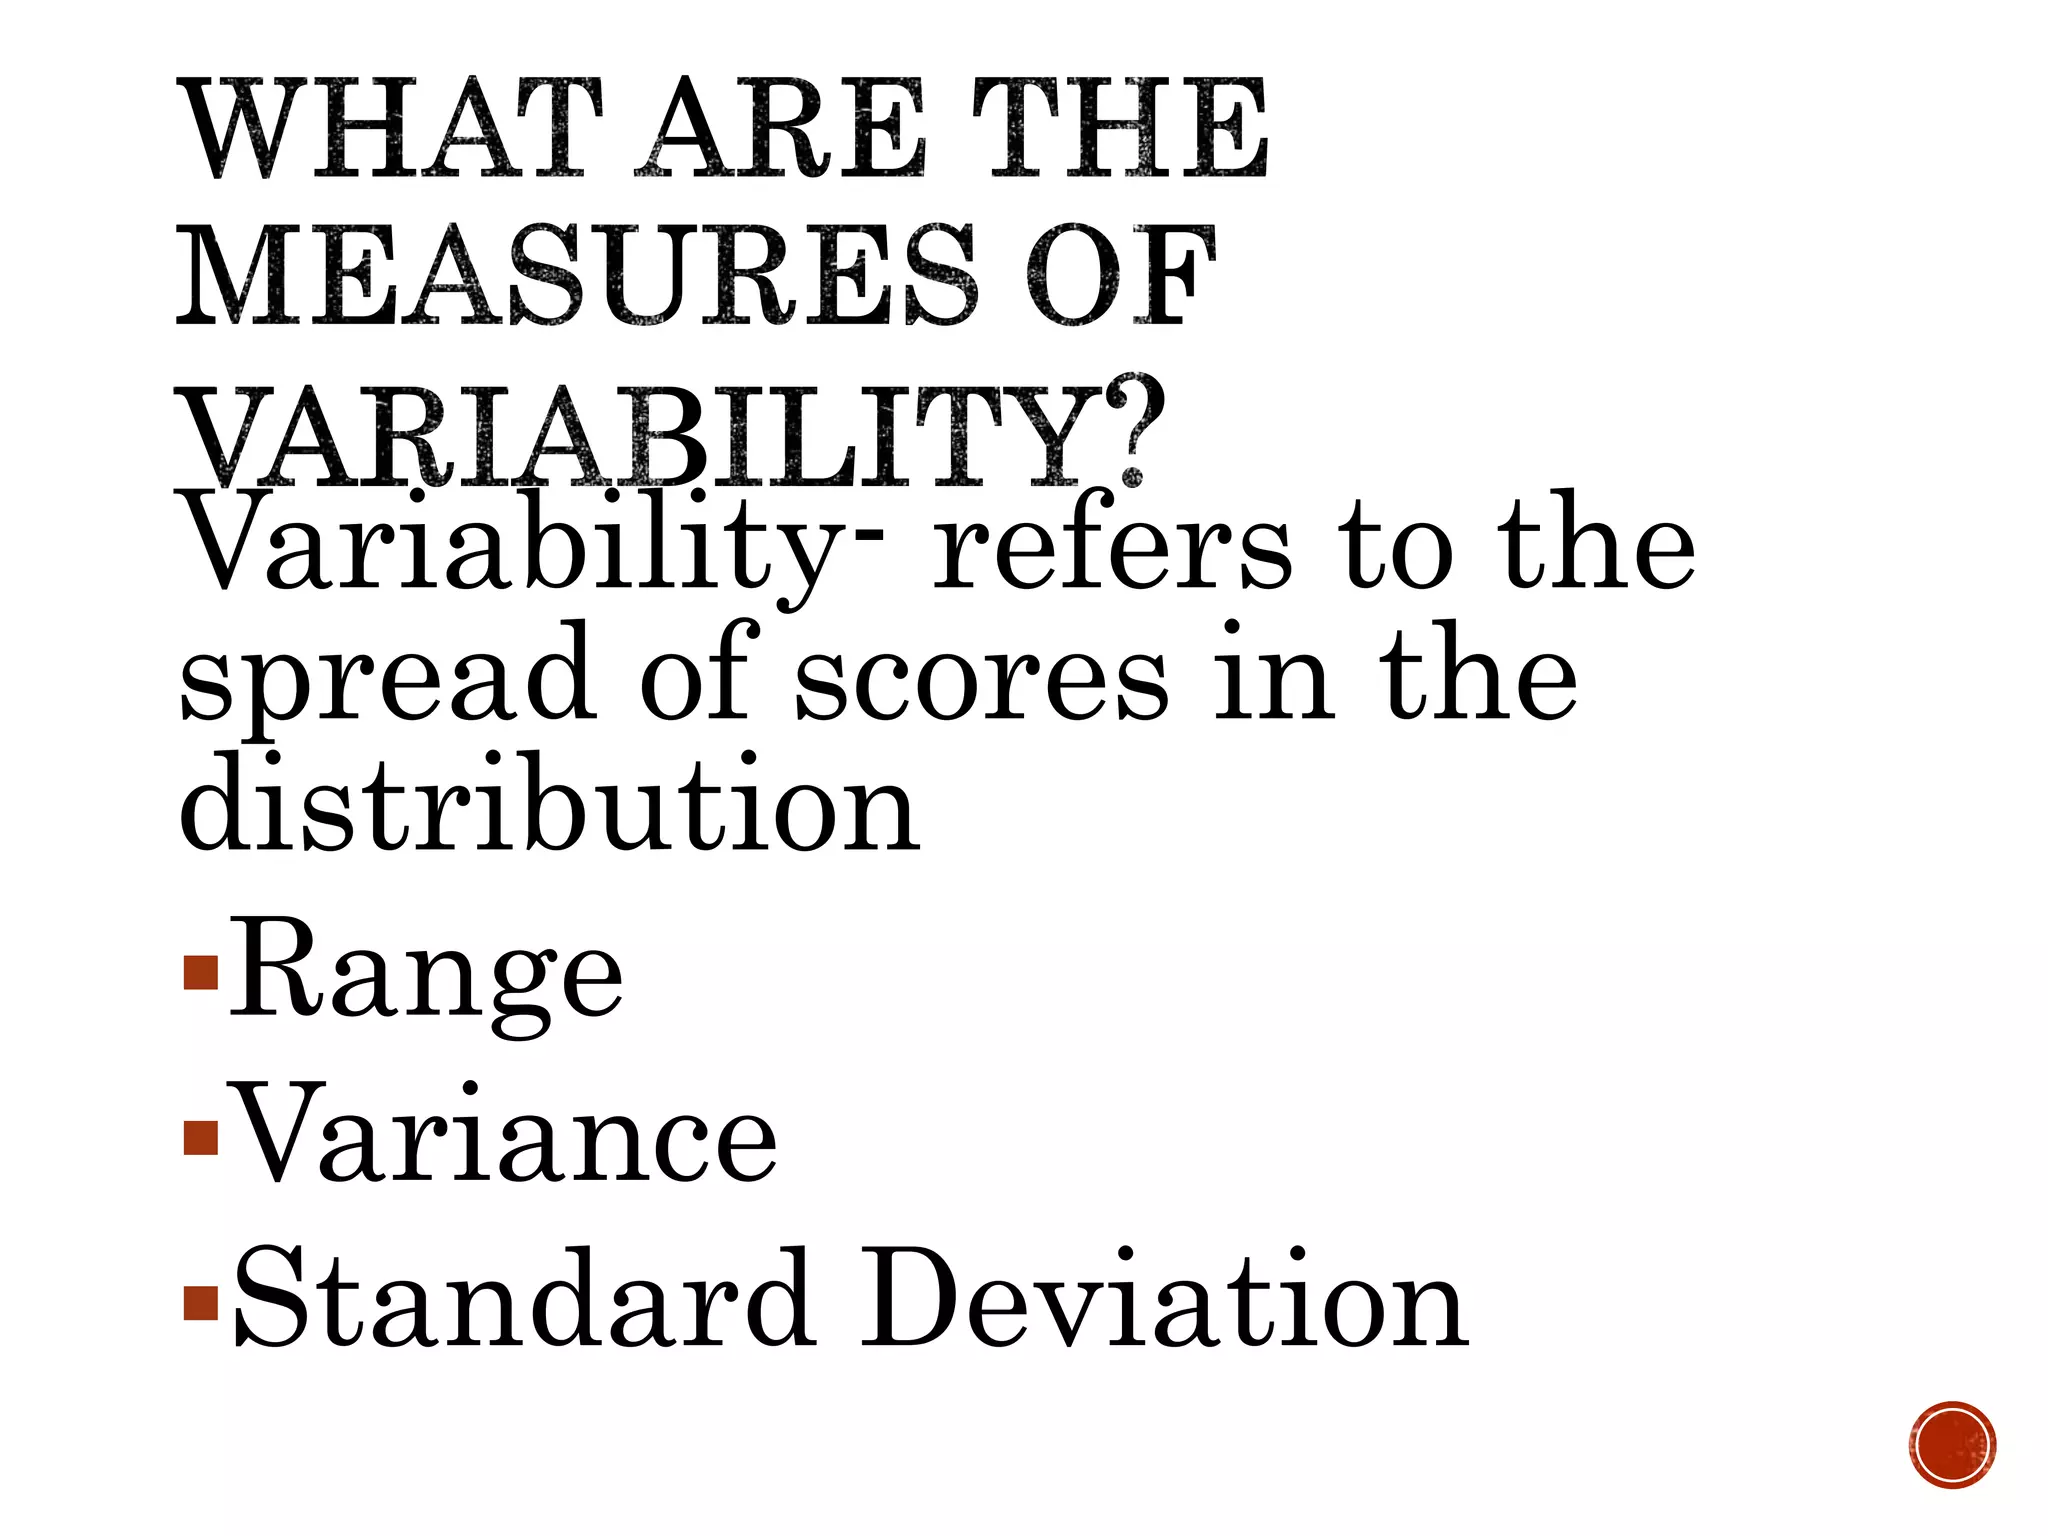
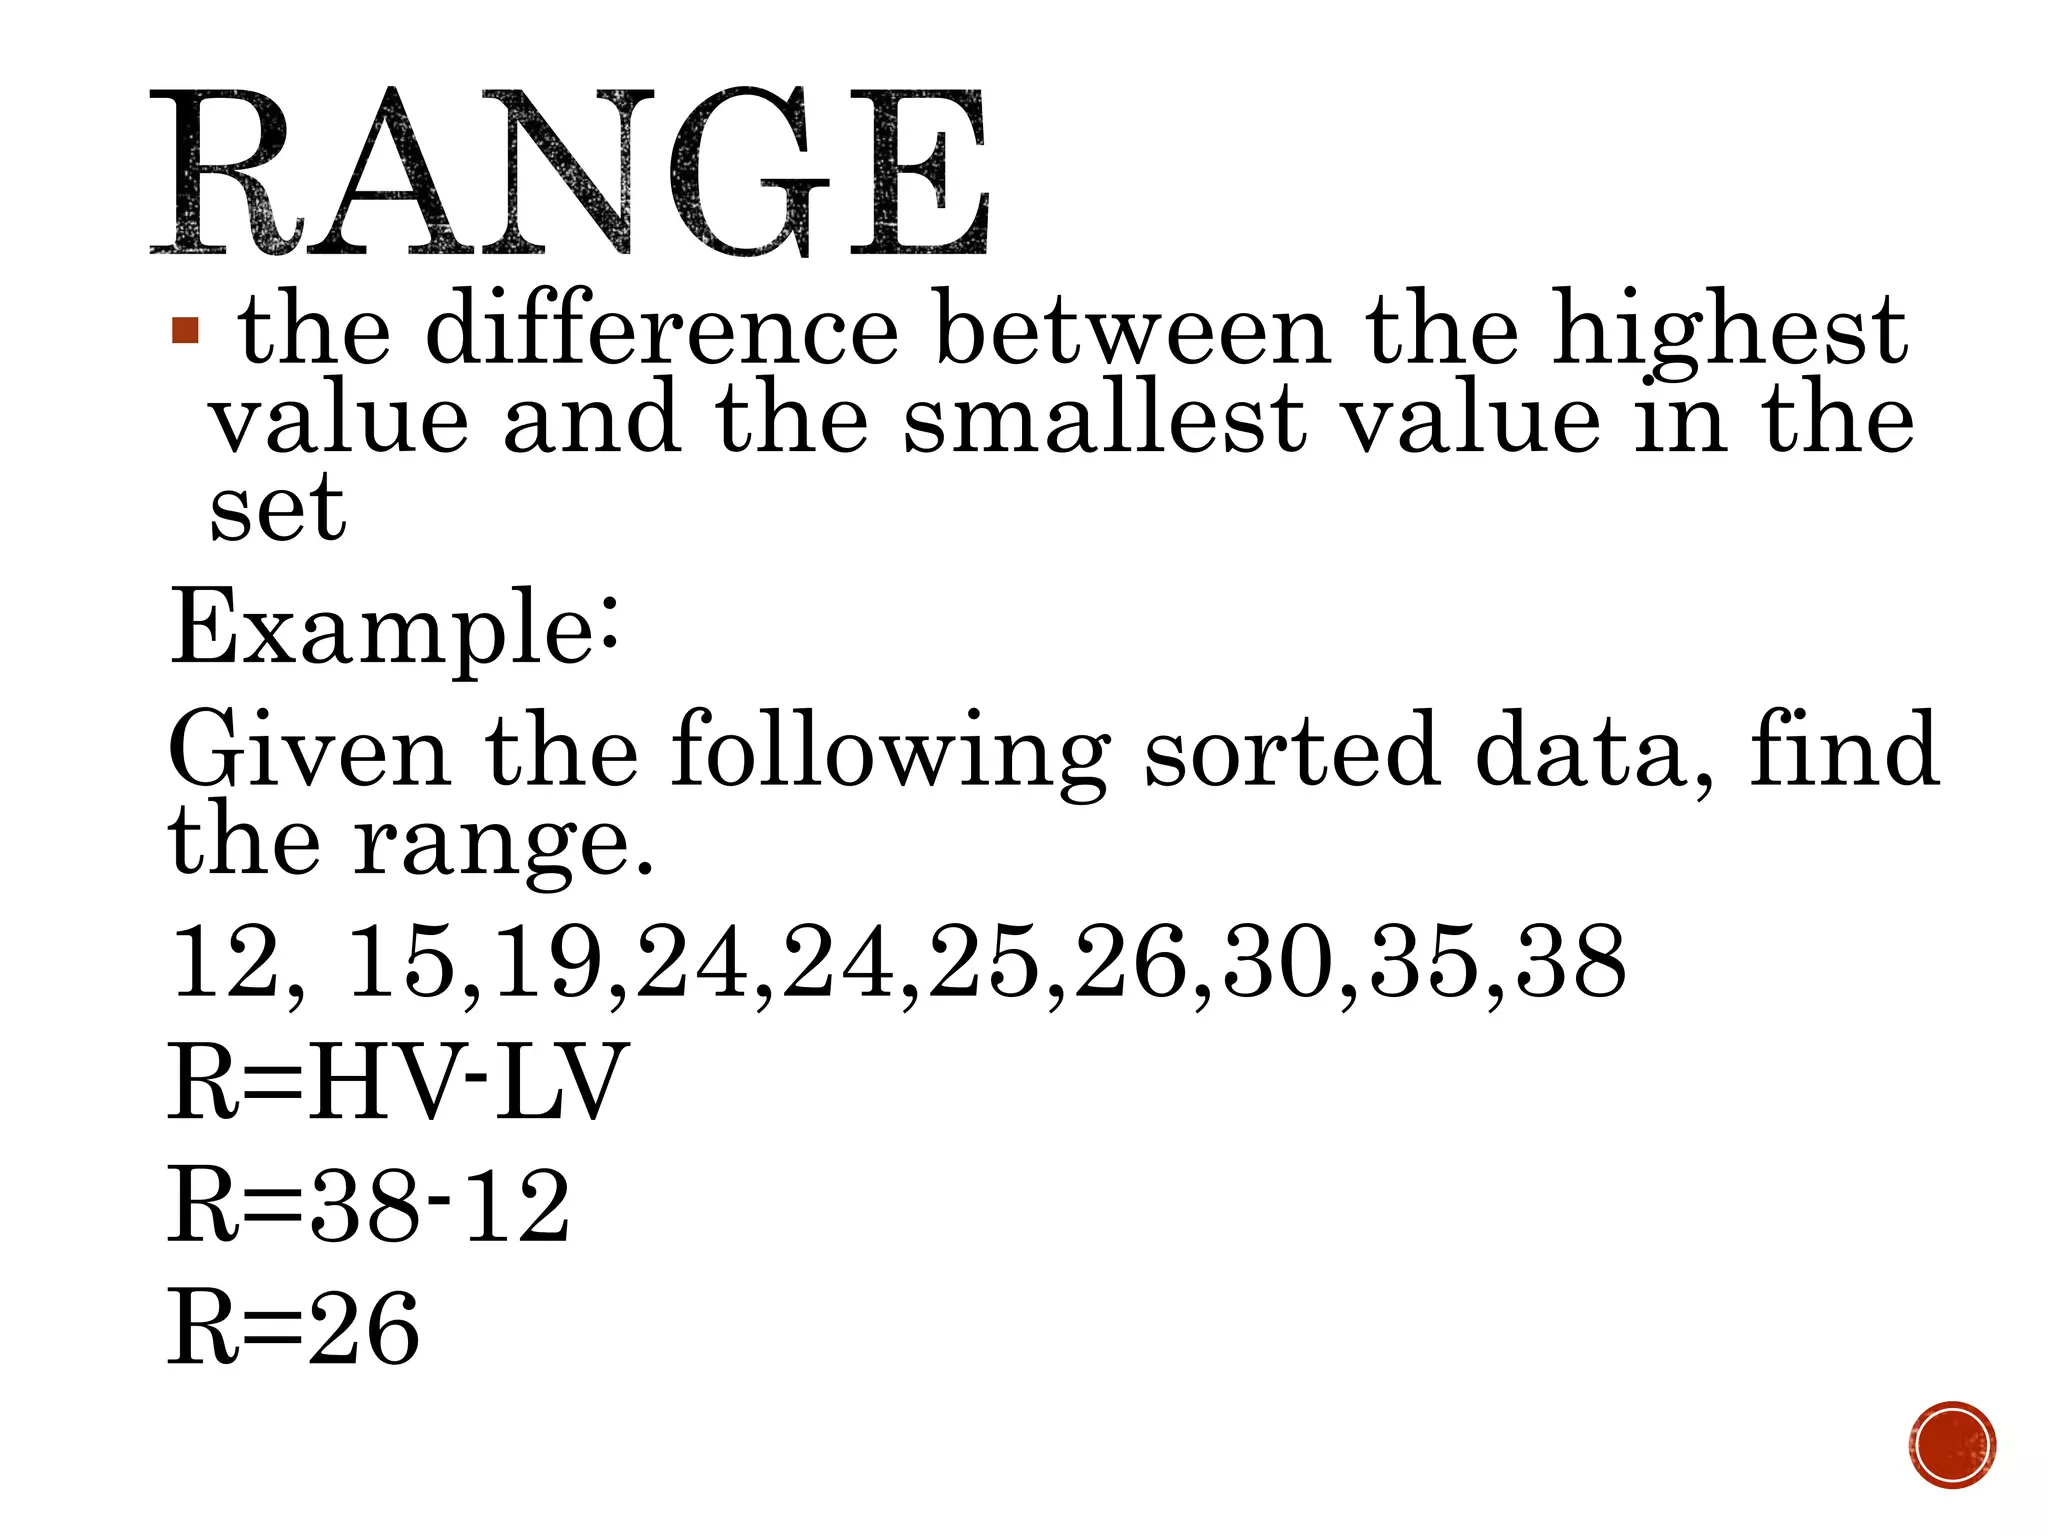


This document defines and provides examples of key statistical concepts used to describe and analyze variability in data sets, including range, variance, standard deviation, coefficient of variation, quartiles, and percentiles. It explains that range is the difference between the highest and lowest values, variance is the average squared deviation from the mean, and standard deviation describes how distant scores are from the mean on average. Examples are provided to demonstrate calculating these measures from data sets and interpreting what they indicate about the spread of scores.


