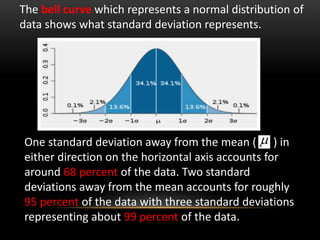
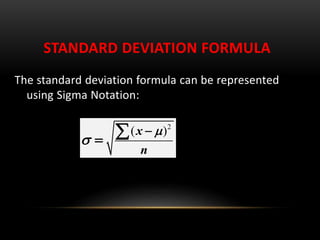
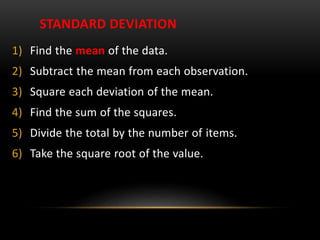
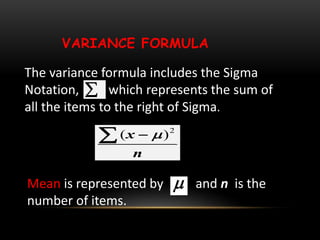
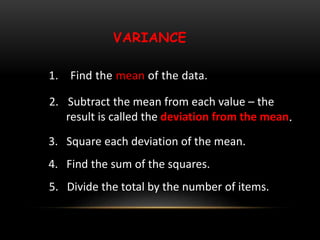
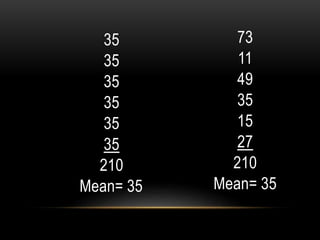
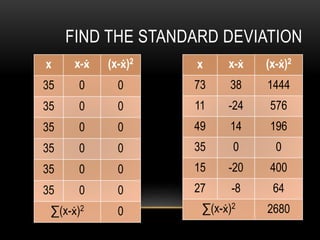
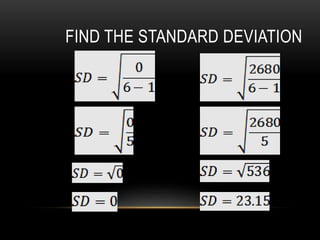
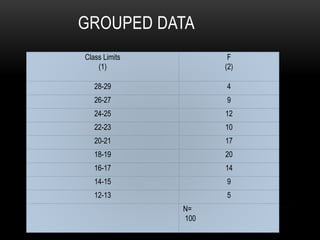
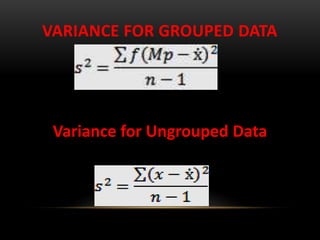
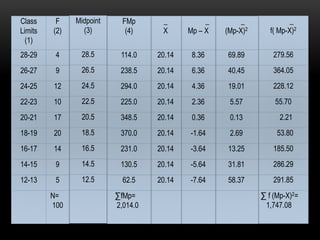
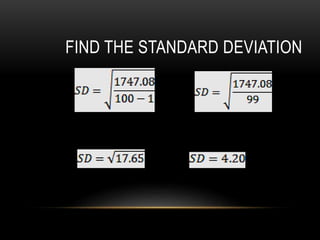
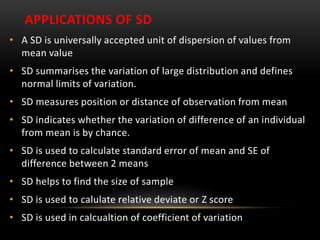
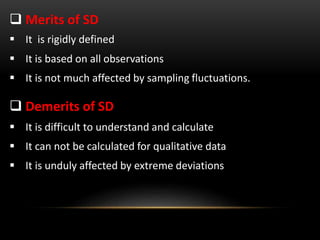
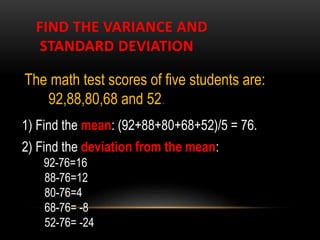
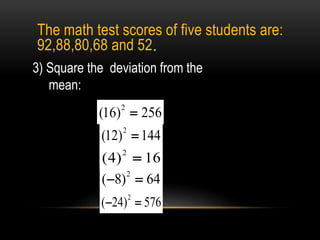
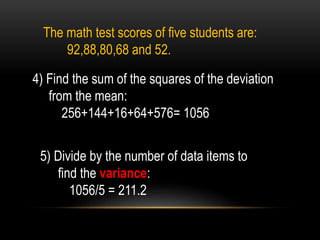
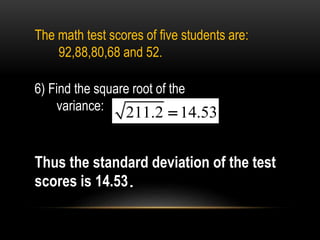
PG Student :- Dr. Vinay Dange
Dr. Amol Askar
PG Teacher :- Dr. S. V. Akarte
Dr. D. Nandanwar
STANDARD DEVIATION &
VARIANCE
THINK OF THESE…
5/9/2016
• Crime rate
• Unemployment
figures
• 2010 BAR Passing
rate
• Mortality rates
• Net Reproduction
Rate
• Proportion of voters
favoring a candidate
• Enrolment trend
• Drop-out rate
• Number of Accident per
year
• Annual growth rate
• Monthly income
• Doctor population ratio
• Prevalence of disease
• Average life span
• Registered vehicles
annually
• Ratio of male teachers
to the female
5/9/2016
Statistics
• Statistics is a branch of mathematics that deals with
the methods of collection, compilation, analysis,
presentation, and interpretation of data.
Biostatistics
• Is defined as application of statistical methods to
medical, biological and public health related
problems.
APPLICATIONS OF BIOSTATISTICS
• Assess community needs
• Understand socio-economic determinants of health
• Plan experiment in health research
• Analyse their results
• Study diagnosis and prognosis of the disease for taking
effective action
• Scientifically test the efficacy of new medicines and methods
of treatment.
5/9/2016
 Descriptive Statistics
 Inferential Statistics
GENERAL CATEGORIES OF
STATISTICS
5/9/2016
 It is concerned with the gathering,
classification, and presentation of data and
summarizing the values to describe the group
characteristic.
DESCRIPTIVE STATISTICS
5/9/2016
 It pertains to the methods dealing with
making of inference, estimate or prediction
about a large set of data (population) using the
information gathered from a sample.
INFERENTIAL STATISTICS
Spot the
5/9/2016
Choose a sample…
Study the sample…
Describe the sample.
Descriptive Statistics
Choose a sample…
Study the sample…
Describe the sample…
Use such estimates( CONCLUSIONS) to
describe the population from where the
sample was drawn.
Inferential Statistics
5/9/2016
•Population
 refers to entire group of people or study elements ---
animals, subjects, measurements, things of any form for
which we have an interest at a particular time.
•Samples
 are elements of the population selected through a
process.
 They have of the same characteristics with the
population.
POPULATION AND SAMPLE
• PARAMETER
This is the value that describes population or universe
• STATISTIC
 It is a measure that derived from sample, such as sample
mean, sample standard deviation
 This summary describes sample
POPULATION
SAMPLE
ILLUSTRATIO5/9/2016
5/9/2016
DATA
• Qualitative Vs Quantitative data
• Grouped Data Vs Ungrouped data
• Primary data Vs Secondary Data
• Discrete Vs Continuous data
• Nominal Vs Ordinal
Data are any bits or collection of information,
ideas, figures or concepts.
RAW DATA – THOSE DATA IN THEIR
ORIGINAL FORM AND STRUCTURE
5/9/2016
When you ask 1st year residents about their age,
date of birth, ethnic group, religion, birth order,
occupation of his father, occupation of her
mother, educational background of his parents,
place of birth, ambition, favorite subject, most
liked Grade school teacher and hobbies – any
such information given by them will be
RAW DATA.
Grouped Data – those data placed in tabular
form characterized by categoryor class
intervals with the corresponding frequency
Religion Groups Frequency
Hindu 101
Muslim 27
Christian 20
Sikh 15
Total 163
5/9/2016
Primary Data – data are measured and
gathered by the researcher
You submit a
statistical data to
your Professor
regarding the
educational profile of
the teachers in your
college which you
yourself had
gathered through
interview.
education Percentage
MBBS 10%
MBBS & Diploma 25%
MBBS & MD 45%
MBBS, MD, FRCP, etc 20%
Total 100%
Table . Educational Profile of Teachers in medical
college
5/9/2016
Comparison of continuous and discrete data
•Continuous data is more precise than discrete
•Continuous data is more informative than discrete
•Continuous data can remove estimation and
rounding of measurements
•Continuous data is often more time consuming to
obtain
•Discrete should also be converted to continuous data
when possible as to obtain a higher level of
information and detail
• For each orange tree, the number of
oranges is measured.
TEST 1
–Quantitative
• For a particular day, the number of cars
entering a college campus is measured.
• Time until a light bulb burns out (4 months)
–Quantitative
–Quantitative
• blue/green color, gold frame
• smells old and musty
• texture shows brush strokes of oil
paint
• peaceful scene of the country
• masterful brush strokes
• picture is 10" by 14"
• with frame 14" by 18"
• weighs 8.5 pounds
• surface area of painting is
140 sq. in.
• cost $300
Quantitative data
Qualitative data
TEST 2 – Oil Painting
• Students
• Girls
• Smart/Intelligent
• Hard working
• 32 students
• 10 A grades
• 92% students Muslim by
religion
• 15 students good in
mathematics
Qualitative data
Quantitative data
TEST 3 -- Class
TEST 4 – conversion of quantitative
data to qualitative data
Haemoglobin level in Gm%
Hypo, Normo or hypertensiveBlood pressure in mm of Hg
Tall or ShortHeight in cm
Anaemic or Non anaemic
IQ scores Idiot, Genius, Normal
Qualitative dataQuantitative data
Classify each set of data as discrete or continuous.
• 1) The number of suitcases lost by an airline.
• 2) The height of corn plants.
• 3) The distance of your house to gym.
• 4) The time it takes for a car battery to die.
• 5) The production of tomatoes by weight.
TEST 5
TEST 6 -- conversion of discrete to
continuous data
• Religion Qualitative , Nominal data
• Disability Ordinal data
• Main food corps
• military rank (General,
colonel, major, etc.),
• Anxiety level
TEST 7
Ordinal data
Ordinal data
Nominal data
• IQ Interval data
• Stethoscope units sold Ratio data
Example: Two ways of asking about Smoking
behavior. Which is better, A or B? & why?
a) Do you smoke? Yes No
b) How many cigarettes did you smoke in the last 3
days (72 hours)?
(a) Is nominal, so the best we can get from this data
are frequencies.
(b) is ratio, so we can compute: mean, median,
mode, frequencies.
TEST 8
Method of determining class intervals
Size of Class Interval
Mean
Median
Mode
Measures of Central Tendency
Measures of dispersion / variability
 Range
 Interquartile range
 Mean deviation
 Standard deviation
 Coefficient of variation
STANDARD DEVIATION
 is a special form of average deviation from the mean.
 is the positive square root of the arithmetic mean of
the squared deviations from the mean of the
distribution.
 is considered as the most reliable measure of
variability.
 is affected by the individual values or items in the
distribution.
STANDARD DEVIATION
Standard Deviation shows the variation in data.
If the data is close together, the standard
deviation will be small. If the data is spread out,
the standard deviation will be large.
Standard Deviation is often denoted by the lowercase
Greek letter sigma, . 
The bell curve which represents a normal distribution of
data shows what standard deviation represents.
One standard deviation away from the mean ( ) in
either direction on the horizontal axis accounts for
around 68 percent of the data. Two standard
deviations away from the mean accounts for roughly
95 percent of the data with three standard deviations
representing about 99 percent of the data.

STANDARD DEVIATION FORMULA
The standard deviation formula can be represented
using Sigma Notation:
2
( )x
n



 
STANDARD DEVIATION
1) Find the mean of the data.
2) Subtract the mean from each observation.
3) Square each deviation of the mean.
4) Find the sum of the squares.
5) Divide the total by the number of items.
6) Take the square root of the value.
VARIANCE
Variance is the average squared
deviation from the mean of a set of
data. It is used to find the standard
deviation.
VARIANCE FORMULA
2
( )x
n

The variance formula includes the Sigma
Notation, , which represents the sum of
all the items to the right of Sigma.

Mean is represented by and n is the
number of items.

VARIANCE
1. Find the mean of the data.
5. Divide the total by the number of items.
4. Find the sum of the squares.
3. Square each deviation of the mean.
2. Subtract the mean from each value – the
result is called the deviation from the mean.
35
35
35
35
35
35
210
Mean= 35
73
11
49
35
15
27
210
Mean= 35
x x-ẋ (x-ẋ)2
35 0 0
35 0 0
35 0 0
35 0 0
35 0 0
35 0 0
∑(x-ẋ)2
0
FIND THE STANDARD DEVIATION
x x-ẋ (x-ẋ)2
73 38 1444
11 -24 576
49 14 196
35 0 0
15 -20 400
27 -8 64
∑(x-ẋ)2
2680
FIND THE STANDARD DEVIATION
Class Limits
(1)
F
(2)
28-29 4
26-27 9
24-25 12
22-23 10
20-21 17
18-19 20
16-17 14
14-15 9
12-13 5
N=
100
GROUPED DATA
VARIANCE FOR GROUPED DATA
Variance for Ungrouped Data
_
f( Mp-X)2
279.56
364.05
228.12
55.70
2.21
53.80
185.50
286.29
291.85
∑ f (Mp-X)2=
1,747.08
_
(Mp-X)2
69.89
40.45
19.01
5.57
0.13
2.69
13.25
31.81
58.37
_
Mp – X
8.36
6.36
4.36
2.36
0.36
-1.64
-3.64
-5.64
-7.64
_
X
20.14
20.14
20.14
20.14
20.14
20.14
20.14
20.14
20.14
FMp
(4)
114.0
238.5
294.0
225.0
348.5
370.0
231.0
130.5
62.5
∑fMp=
2,014.0
Midpoint
(3)
28.5
26.5
24.5
22.5
20.5
18.5
16.5
14.5
12.5
Class
Limits
(1)
F
(2)
28-29 4
26-27 9
24-25 12
22-23 10
20-21 17
18-19 20
16-17 14
14-15 9
12-13 5
N=
100
FIND THE STANDARD DEVIATION
APPLICATIONS OF SD
• A SD is universally accepted unit of dispersion of values from
mean value
• SD summarises the variation of large distribution and defines
normal limits of variation.
• SD measures position or distance of observation from mean
• SD indicates whether the variation of difference of an individual
from mean is by chance.
• SD is used to calculate standard error of mean and SE of
difference between 2 means
• SD helps to find the size of sample
• SD is used to calulate relative deviate or Z score
• SD is used in calcualtion of coefficient of variation
 Merits of SD
 It is rigidly defined
 It is based on all observations
 It is not much affected by sampling fluctuations.
 Demerits of SD
 It is difficult to understand and calculate
 It can not be calculated for qualitative data
 It is unduly affected by extreme deviations
FIND THE VARIANCE AND
STANDARD DEVIATION
The math test scores of five students are:
92,88,80,68 and 52.
1) Find the mean: (92+88+80+68+52)/5 = 76.
2) Find the deviation from the mean:
92-76=16
88-76=12
80-76=4
68-76= -8
52-76= -24
3) Square the deviation from the
mean:
2
( 8) 64 
2
(16) 256
2
(12) 144
2
(4) 16
2
( 24) 576 
The math test scores of five students are:
92,88,80,68 and 52.
The math test scores of five students are:
92,88,80,68 and 52.
4) Find the sum of the squares of the deviation
from the mean:
256+144+16+64+576= 1056
5) Divide by the number of data items to
find the variance:
1056/5 = 211.2
The math test scores of five students are:
92,88,80,68 and 52.
6) Find the square root of the
variance: 211.2 14.53
Thus the standard deviation of the test
scores is 14.53.
DISCRETE AND CONTINUOUS DATA
• There are two types of Quantitative Data:
• 1. Discrete (in whole numbers)
• Exp: Number of Questions in Exam 5, 7, 14
• Number of cars,
• Number of students 3000
• 2. Continuous (in decimal points)
Exp: Temperature of Yanbu on Sunday 26.5 degrees
• Your Height 5.3”
• Your Weight 120.5 lbs
introduction to biostat, standard deviation and variance

introduction to biostat, standard deviation and variance

  • 1.
    PG Student :-Dr. Vinay Dange Dr. Amol Askar PG Teacher :- Dr. S. V. Akarte Dr. D. Nandanwar STANDARD DEVIATION & VARIANCE
  • 2.
    THINK OF THESE… 5/9/2016 •Crime rate • Unemployment figures • 2010 BAR Passing rate • Mortality rates • Net Reproduction Rate • Proportion of voters favoring a candidate • Enrolment trend • Drop-out rate • Number of Accident per year • Annual growth rate • Monthly income • Doctor population ratio • Prevalence of disease • Average life span • Registered vehicles annually • Ratio of male teachers to the female
  • 3.
    5/9/2016 Statistics • Statistics isa branch of mathematics that deals with the methods of collection, compilation, analysis, presentation, and interpretation of data. Biostatistics • Is defined as application of statistical methods to medical, biological and public health related problems.
  • 4.
    APPLICATIONS OF BIOSTATISTICS •Assess community needs • Understand socio-economic determinants of health • Plan experiment in health research • Analyse their results • Study diagnosis and prognosis of the disease for taking effective action • Scientifically test the efficacy of new medicines and methods of treatment.
  • 5.
    5/9/2016  Descriptive Statistics Inferential Statistics GENERAL CATEGORIES OF STATISTICS
  • 6.
    5/9/2016  It isconcerned with the gathering, classification, and presentation of data and summarizing the values to describe the group characteristic. DESCRIPTIVE STATISTICS
  • 7.
    5/9/2016  It pertainsto the methods dealing with making of inference, estimate or prediction about a large set of data (population) using the information gathered from a sample. INFERENTIAL STATISTICS
  • 8.
    Spot the 5/9/2016 Choose asample… Study the sample… Describe the sample. Descriptive Statistics Choose a sample… Study the sample… Describe the sample… Use such estimates( CONCLUSIONS) to describe the population from where the sample was drawn. Inferential Statistics
  • 9.
    5/9/2016 •Population  refers toentire group of people or study elements --- animals, subjects, measurements, things of any form for which we have an interest at a particular time. •Samples  are elements of the population selected through a process.  They have of the same characteristics with the population. POPULATION AND SAMPLE
  • 10.
    • PARAMETER This isthe value that describes population or universe • STATISTIC  It is a measure that derived from sample, such as sample mean, sample standard deviation  This summary describes sample
  • 11.
  • 12.
    5/9/2016 DATA • Qualitative VsQuantitative data • Grouped Data Vs Ungrouped data • Primary data Vs Secondary Data • Discrete Vs Continuous data • Nominal Vs Ordinal Data are any bits or collection of information, ideas, figures or concepts.
  • 13.
    RAW DATA –THOSE DATA IN THEIR ORIGINAL FORM AND STRUCTURE 5/9/2016 When you ask 1st year residents about their age, date of birth, ethnic group, religion, birth order, occupation of his father, occupation of her mother, educational background of his parents, place of birth, ambition, favorite subject, most liked Grade school teacher and hobbies – any such information given by them will be RAW DATA.
  • 14.
    Grouped Data –those data placed in tabular form characterized by categoryor class intervals with the corresponding frequency Religion Groups Frequency Hindu 101 Muslim 27 Christian 20 Sikh 15 Total 163 5/9/2016
  • 15.
    Primary Data –data are measured and gathered by the researcher You submit a statistical data to your Professor regarding the educational profile of the teachers in your college which you yourself had gathered through interview. education Percentage MBBS 10% MBBS & Diploma 25% MBBS & MD 45% MBBS, MD, FRCP, etc 20% Total 100% Table . Educational Profile of Teachers in medical college 5/9/2016
  • 16.
    Comparison of continuousand discrete data •Continuous data is more precise than discrete •Continuous data is more informative than discrete •Continuous data can remove estimation and rounding of measurements •Continuous data is often more time consuming to obtain •Discrete should also be converted to continuous data when possible as to obtain a higher level of information and detail
  • 18.
    • For eachorange tree, the number of oranges is measured. TEST 1 –Quantitative • For a particular day, the number of cars entering a college campus is measured. • Time until a light bulb burns out (4 months) –Quantitative –Quantitative
  • 19.
    • blue/green color,gold frame • smells old and musty • texture shows brush strokes of oil paint • peaceful scene of the country • masterful brush strokes • picture is 10" by 14" • with frame 14" by 18" • weighs 8.5 pounds • surface area of painting is 140 sq. in. • cost $300 Quantitative data Qualitative data TEST 2 – Oil Painting
  • 20.
    • Students • Girls •Smart/Intelligent • Hard working • 32 students • 10 A grades • 92% students Muslim by religion • 15 students good in mathematics Qualitative data Quantitative data TEST 3 -- Class
  • 21.
    TEST 4 –conversion of quantitative data to qualitative data Haemoglobin level in Gm% Hypo, Normo or hypertensiveBlood pressure in mm of Hg Tall or ShortHeight in cm Anaemic or Non anaemic IQ scores Idiot, Genius, Normal Qualitative dataQuantitative data
  • 22.
    Classify each setof data as discrete or continuous. • 1) The number of suitcases lost by an airline. • 2) The height of corn plants. • 3) The distance of your house to gym. • 4) The time it takes for a car battery to die. • 5) The production of tomatoes by weight. TEST 5
  • 23.
    TEST 6 --conversion of discrete to continuous data
  • 24.
    • Religion Qualitative, Nominal data • Disability Ordinal data • Main food corps • military rank (General, colonel, major, etc.), • Anxiety level TEST 7 Ordinal data Ordinal data Nominal data • IQ Interval data • Stethoscope units sold Ratio data
  • 25.
    Example: Two waysof asking about Smoking behavior. Which is better, A or B? & why? a) Do you smoke? Yes No b) How many cigarettes did you smoke in the last 3 days (72 hours)? (a) Is nominal, so the best we can get from this data are frequencies. (b) is ratio, so we can compute: mean, median, mode, frequencies. TEST 8
  • 26.
    Method of determiningclass intervals
  • 27.
    Size of ClassInterval
  • 28.
  • 29.
    Measures of dispersion/ variability  Range  Interquartile range  Mean deviation  Standard deviation  Coefficient of variation
  • 30.
    STANDARD DEVIATION  isa special form of average deviation from the mean.  is the positive square root of the arithmetic mean of the squared deviations from the mean of the distribution.  is considered as the most reliable measure of variability.  is affected by the individual values or items in the distribution.
  • 31.
    STANDARD DEVIATION Standard Deviationshows the variation in data. If the data is close together, the standard deviation will be small. If the data is spread out, the standard deviation will be large. Standard Deviation is often denoted by the lowercase Greek letter sigma, . 
  • 32.
    The bell curvewhich represents a normal distribution of data shows what standard deviation represents. One standard deviation away from the mean ( ) in either direction on the horizontal axis accounts for around 68 percent of the data. Two standard deviations away from the mean accounts for roughly 95 percent of the data with three standard deviations representing about 99 percent of the data. 
  • 33.
    STANDARD DEVIATION FORMULA Thestandard deviation formula can be represented using Sigma Notation: 2 ( )x n     
  • 34.
    STANDARD DEVIATION 1) Findthe mean of the data. 2) Subtract the mean from each observation. 3) Square each deviation of the mean. 4) Find the sum of the squares. 5) Divide the total by the number of items. 6) Take the square root of the value.
  • 35.
    VARIANCE Variance is theaverage squared deviation from the mean of a set of data. It is used to find the standard deviation.
  • 36.
    VARIANCE FORMULA 2 ( )x n  Thevariance formula includes the Sigma Notation, , which represents the sum of all the items to the right of Sigma.  Mean is represented by and n is the number of items. 
  • 37.
    VARIANCE 1. Find themean of the data. 5. Divide the total by the number of items. 4. Find the sum of the squares. 3. Square each deviation of the mean. 2. Subtract the mean from each value – the result is called the deviation from the mean.
  • 38.
  • 39.
    x x-ẋ (x-ẋ)2 350 0 35 0 0 35 0 0 35 0 0 35 0 0 35 0 0 ∑(x-ẋ)2 0 FIND THE STANDARD DEVIATION x x-ẋ (x-ẋ)2 73 38 1444 11 -24 576 49 14 196 35 0 0 15 -20 400 27 -8 64 ∑(x-ẋ)2 2680
  • 40.
  • 41.
    Class Limits (1) F (2) 28-29 4 26-279 24-25 12 22-23 10 20-21 17 18-19 20 16-17 14 14-15 9 12-13 5 N= 100 GROUPED DATA
  • 42.
    VARIANCE FOR GROUPEDDATA Variance for Ungrouped Data
  • 43.
    _ f( Mp-X)2 279.56 364.05 228.12 55.70 2.21 53.80 185.50 286.29 291.85 ∑ f(Mp-X)2= 1,747.08 _ (Mp-X)2 69.89 40.45 19.01 5.57 0.13 2.69 13.25 31.81 58.37 _ Mp – X 8.36 6.36 4.36 2.36 0.36 -1.64 -3.64 -5.64 -7.64 _ X 20.14 20.14 20.14 20.14 20.14 20.14 20.14 20.14 20.14 FMp (4) 114.0 238.5 294.0 225.0 348.5 370.0 231.0 130.5 62.5 ∑fMp= 2,014.0 Midpoint (3) 28.5 26.5 24.5 22.5 20.5 18.5 16.5 14.5 12.5 Class Limits (1) F (2) 28-29 4 26-27 9 24-25 12 22-23 10 20-21 17 18-19 20 16-17 14 14-15 9 12-13 5 N= 100
  • 44.
  • 45.
    APPLICATIONS OF SD •A SD is universally accepted unit of dispersion of values from mean value • SD summarises the variation of large distribution and defines normal limits of variation. • SD measures position or distance of observation from mean • SD indicates whether the variation of difference of an individual from mean is by chance. • SD is used to calculate standard error of mean and SE of difference between 2 means • SD helps to find the size of sample • SD is used to calulate relative deviate or Z score • SD is used in calcualtion of coefficient of variation
  • 46.
     Merits ofSD  It is rigidly defined  It is based on all observations  It is not much affected by sampling fluctuations.  Demerits of SD  It is difficult to understand and calculate  It can not be calculated for qualitative data  It is unduly affected by extreme deviations
  • 47.
    FIND THE VARIANCEAND STANDARD DEVIATION The math test scores of five students are: 92,88,80,68 and 52. 1) Find the mean: (92+88+80+68+52)/5 = 76. 2) Find the deviation from the mean: 92-76=16 88-76=12 80-76=4 68-76= -8 52-76= -24
  • 48.
    3) Square thedeviation from the mean: 2 ( 8) 64  2 (16) 256 2 (12) 144 2 (4) 16 2 ( 24) 576  The math test scores of five students are: 92,88,80,68 and 52.
  • 49.
    The math testscores of five students are: 92,88,80,68 and 52. 4) Find the sum of the squares of the deviation from the mean: 256+144+16+64+576= 1056 5) Divide by the number of data items to find the variance: 1056/5 = 211.2
  • 50.
    The math testscores of five students are: 92,88,80,68 and 52. 6) Find the square root of the variance: 211.2 14.53 Thus the standard deviation of the test scores is 14.53.
  • 51.
    DISCRETE AND CONTINUOUSDATA • There are two types of Quantitative Data: • 1. Discrete (in whole numbers) • Exp: Number of Questions in Exam 5, 7, 14 • Number of cars, • Number of students 3000 • 2. Continuous (in decimal points) Exp: Temperature of Yanbu on Sunday 26.5 degrees • Your Height 5.3” • Your Weight 120.5 lbs