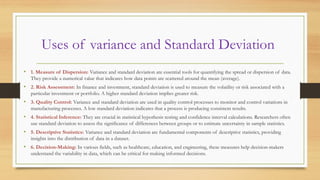
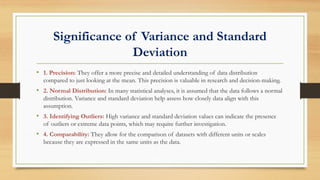
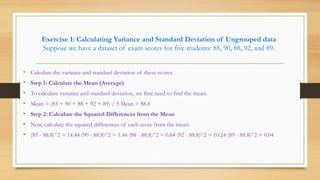
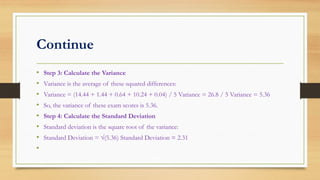
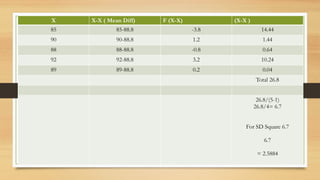
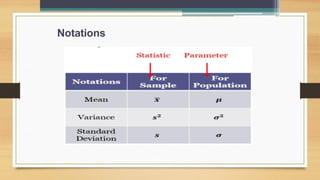
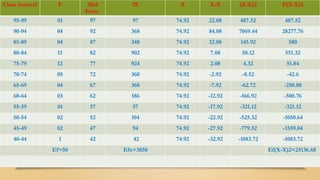
Variance And Standard
Deviation
By
Shahid Hussain
Lecturer
South City Institute of Nursing
Variance and Standard Deviation
• Variance and Standard Deviation are ways to measure how
spread out or bunched together a set of numbers is. They help us
understand how much individual values in a group differ from the
average value.
Uses of variance and Standard Deviation
• 1. Measure of Dispersion: Variance and standard deviation are essential tools for quantifying the spread or dispersion of data.
They provide a numerical value that indicates how data points are scattered around the mean (average).
• 2. Risk Assessment: In finance and investment, standard deviation is used to measure the volatility or risk associated with a
particular investment or portfolio. A higher standard deviation implies greater risk.
• 3. Quality Control: Variance and standard deviation are used in quality control processes to monitor and control variations in
manufacturing processes. A low standard deviation indicates that a process is producing consistent results.
• 4. Statistical Inference: They are crucial in statistical hypothesis testing and confidence interval calculations. Researchers often
use standard deviation to assess the significance of differences between groups or to estimate uncertainty in sample statistics.
• 5. Descriptive Statistics: Variance and standard deviation are fundamental components of descriptive statistics, providing
insights into the distribution of data in a dataset.
• 6. Decision-Making: In various fields, such as healthcare, education, and engineering, these measures help decision-makers
understand the variability in data, which can be critical for making informed decisions.
Significance of Variance and Standard
Deviation
• 1. Precision: They offer a more precise and detailed understanding of data distribution
compared to just looking at the mean. This precision is valuable in research and decision-making.
• 2. Normal Distribution: In many statistical analyses, it is assumed that the data follows a normal
distribution. Variance and standard deviation help assess how closely data align with this
assumption.
• 3. Identifying Outliers: High variance and standard deviation values can indicate the presence
of outliers or extreme data points, which may require further investigation.
• 4. Comparability: They allow for the comparison of datasets with different units or scales
because they are expressed in the same units as the data.
Drawbacks of Variance and Standard
Deviation:
• Sensitive to Outliers: Variance and standard deviation are highly affected by outliers or extreme values. A single
outlier can significantly inflate these measures, leading to a potentially inaccurate representation of data
dispersion.
• 2. Non-Negativity: Both variance and standard deviation are non-negative values, which means they don't
provide information about the direction or nature of deviations from the mean.
• 3. Units of Measurement: Variance and standard deviation are expressed in the square of the original units of
measurement. This can make them less intuitive to interpret, especially when dealing with diverse datasets.
• 4. Normal Distribution Assumption: They assume a normal distribution of data. In reality, many datasets do
not follow a perfect normal distribution, which can limit their applicability.
• 5. Complex Computation: Calculating variance and standard deviation involves multiple steps and can be
computationally intensive for large datasets. This complexity may deter some users.
Limitations of variance and SD
• In summary, variance and standard deviation are powerful tools for
understanding data dispersion, risk assessment, and statistical analysis.
However, they have limitations, particularly their sensitivity to outliers and
the assumption of normal distribution, which should be considered when
interpreting results and making decisions based on them.
Exercise 1: Calculating Variance and Standard Deviation of Ungrouped data
Suppose we have a dataset of exam scores for five students: 85, 90, 88, 92, and 89.
• Calculate the variance and standard deviation of these scores.
• Step 1: Calculate the Mean (Average)
• To calculate variance and standard deviation, we first need to find the mean:
• Mean = (85 + 90 + 88 + 92 + 89) / 5 Mean = 88.8
• Step 2: Calculate the Squared Differences from the Mean
• Now, calculate the squared differences of each score from the mean:
• (85 - 88.8)^2 = 14.44 (90 - 88.8)^2 = 1.44 (88 - 88.8)^2 = 0.64 (92 - 88.8)^2 = 10.24 (89 - 88.8)^2 = 0.04
Continue
• Step 3: Calculate the Variance
• Variance is the average of these squared differences:
• Variance = (14.44 + 1.44 + 0.64 + 10.24 + 0.04) / 5 Variance = 26.8 / 5 Variance = 5.36
• So, the variance of these exam scores is 5.36.
• Step 4: Calculate the Standard Deviation
• Standard deviation is the square root of the variance:
• Standard Deviation = √(5.36) Standard Deviation ≈ 2.31
•
X X-X ( Mean Diff) F (X-X) (X-X )
85 85-88.8 -3.8 14.44
90 90-88.8 1.2 1.44
88 88-88.8 -0.8 0.64
92 92-88.8 3.2 10.24
89 89-88.8 0.2 0.04
Total 26.8
26.8/(5-1)
26.8/4= 6.7
For SD Square 6.7
6.7
= 2.5884
Notations
Class interval F Mid
Point
fX X X-X (X-X)2 F(X-X)2
95-99 01 97 97 74.92 22.08 487.52 487.52
90-94 04 92 368 74.92 84.08 7069.44 28277.76
85-89 04 87 348 74.92 12.08 145.92 580
80-84 11 82 902 74.92 7.08 50.12 551.32
75-79 12 77 924 74.92 2.08 4.32 51.84
70-74 05 72 360 74.92 -2.92 -8.52 -42.6
65-69 04 67 368 74.92 -7.92 -62.72 -250.88
60-64 03 62 186 74.92 -12.92 -166.92 -500.76
55-59 01 57 57 74.92 -17.92 -321.12 -321.12
50-54 02 52 104 74.92 -22.92 -525.32 -1050.64
45-49 02 47 94 74.92 -27.92 -779.52 -1559.04
40-44 1 42 42 74.92 -32.92 -1083.72 -1083.72
Ef=50 Efx=3850 Ef(X-X)2=25136.68
Variance And Standard Deviation in biostatistics pptx

Variance And Standard Deviation in biostatistics pptx

  • 1.
    Variance And Standard Deviation By ShahidHussain Lecturer South City Institute of Nursing
  • 2.
    Variance and StandardDeviation • Variance and Standard Deviation are ways to measure how spread out or bunched together a set of numbers is. They help us understand how much individual values in a group differ from the average value.
  • 3.
    Uses of varianceand Standard Deviation • 1. Measure of Dispersion: Variance and standard deviation are essential tools for quantifying the spread or dispersion of data. They provide a numerical value that indicates how data points are scattered around the mean (average). • 2. Risk Assessment: In finance and investment, standard deviation is used to measure the volatility or risk associated with a particular investment or portfolio. A higher standard deviation implies greater risk. • 3. Quality Control: Variance and standard deviation are used in quality control processes to monitor and control variations in manufacturing processes. A low standard deviation indicates that a process is producing consistent results. • 4. Statistical Inference: They are crucial in statistical hypothesis testing and confidence interval calculations. Researchers often use standard deviation to assess the significance of differences between groups or to estimate uncertainty in sample statistics. • 5. Descriptive Statistics: Variance and standard deviation are fundamental components of descriptive statistics, providing insights into the distribution of data in a dataset. • 6. Decision-Making: In various fields, such as healthcare, education, and engineering, these measures help decision-makers understand the variability in data, which can be critical for making informed decisions.
  • 4.
    Significance of Varianceand Standard Deviation • 1. Precision: They offer a more precise and detailed understanding of data distribution compared to just looking at the mean. This precision is valuable in research and decision-making. • 2. Normal Distribution: In many statistical analyses, it is assumed that the data follows a normal distribution. Variance and standard deviation help assess how closely data align with this assumption. • 3. Identifying Outliers: High variance and standard deviation values can indicate the presence of outliers or extreme data points, which may require further investigation. • 4. Comparability: They allow for the comparison of datasets with different units or scales because they are expressed in the same units as the data.
  • 5.
    Drawbacks of Varianceand Standard Deviation: • Sensitive to Outliers: Variance and standard deviation are highly affected by outliers or extreme values. A single outlier can significantly inflate these measures, leading to a potentially inaccurate representation of data dispersion. • 2. Non-Negativity: Both variance and standard deviation are non-negative values, which means they don't provide information about the direction or nature of deviations from the mean. • 3. Units of Measurement: Variance and standard deviation are expressed in the square of the original units of measurement. This can make them less intuitive to interpret, especially when dealing with diverse datasets. • 4. Normal Distribution Assumption: They assume a normal distribution of data. In reality, many datasets do not follow a perfect normal distribution, which can limit their applicability. • 5. Complex Computation: Calculating variance and standard deviation involves multiple steps and can be computationally intensive for large datasets. This complexity may deter some users.
  • 6.
    Limitations of varianceand SD • In summary, variance and standard deviation are powerful tools for understanding data dispersion, risk assessment, and statistical analysis. However, they have limitations, particularly their sensitivity to outliers and the assumption of normal distribution, which should be considered when interpreting results and making decisions based on them.
  • 7.
    Exercise 1: CalculatingVariance and Standard Deviation of Ungrouped data Suppose we have a dataset of exam scores for five students: 85, 90, 88, 92, and 89. • Calculate the variance and standard deviation of these scores. • Step 1: Calculate the Mean (Average) • To calculate variance and standard deviation, we first need to find the mean: • Mean = (85 + 90 + 88 + 92 + 89) / 5 Mean = 88.8 • Step 2: Calculate the Squared Differences from the Mean • Now, calculate the squared differences of each score from the mean: • (85 - 88.8)^2 = 14.44 (90 - 88.8)^2 = 1.44 (88 - 88.8)^2 = 0.64 (92 - 88.8)^2 = 10.24 (89 - 88.8)^2 = 0.04
  • 8.
    Continue • Step 3:Calculate the Variance • Variance is the average of these squared differences: • Variance = (14.44 + 1.44 + 0.64 + 10.24 + 0.04) / 5 Variance = 26.8 / 5 Variance = 5.36 • So, the variance of these exam scores is 5.36. • Step 4: Calculate the Standard Deviation • Standard deviation is the square root of the variance: • Standard Deviation = √(5.36) Standard Deviation ≈ 2.31 •
  • 9.
    X X-X (Mean Diff) F (X-X) (X-X ) 85 85-88.8 -3.8 14.44 90 90-88.8 1.2 1.44 88 88-88.8 -0.8 0.64 92 92-88.8 3.2 10.24 89 89-88.8 0.2 0.04 Total 26.8 26.8/(5-1) 26.8/4= 6.7 For SD Square 6.7 6.7 = 2.5884
  • 10.
  • 11.
    Class interval FMid Point fX X X-X (X-X)2 F(X-X)2 95-99 01 97 97 74.92 22.08 487.52 487.52 90-94 04 92 368 74.92 84.08 7069.44 28277.76 85-89 04 87 348 74.92 12.08 145.92 580 80-84 11 82 902 74.92 7.08 50.12 551.32 75-79 12 77 924 74.92 2.08 4.32 51.84 70-74 05 72 360 74.92 -2.92 -8.52 -42.6 65-69 04 67 368 74.92 -7.92 -62.72 -250.88 60-64 03 62 186 74.92 -12.92 -166.92 -500.76 55-59 01 57 57 74.92 -17.92 -321.12 -321.12 50-54 02 52 104 74.92 -22.92 -525.32 -1050.64 45-49 02 47 94 74.92 -27.92 -779.52 -1559.04 40-44 1 42 42 74.92 -32.92 -1083.72 -1083.72 Ef=50 Efx=3850 Ef(X-X)2=25136.68