Downloaded 263 times
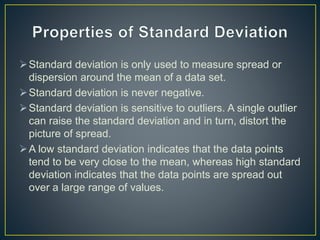
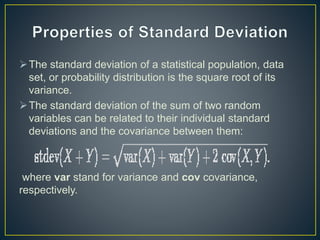
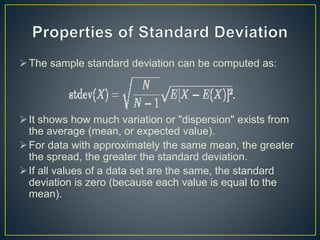
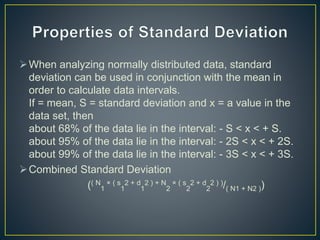


The document discusses standard deviation and its properties. Standard deviation is a measure of how spread out numbers are from the average (mean) value. It is always non-negative and can be impacted by outliers. A low standard deviation means values are close to the mean, while a high standard deviation means values are more spread out. Standard deviation can be used to calculate what percentage of data falls within certain intervals from the mean when data is normally distributed.