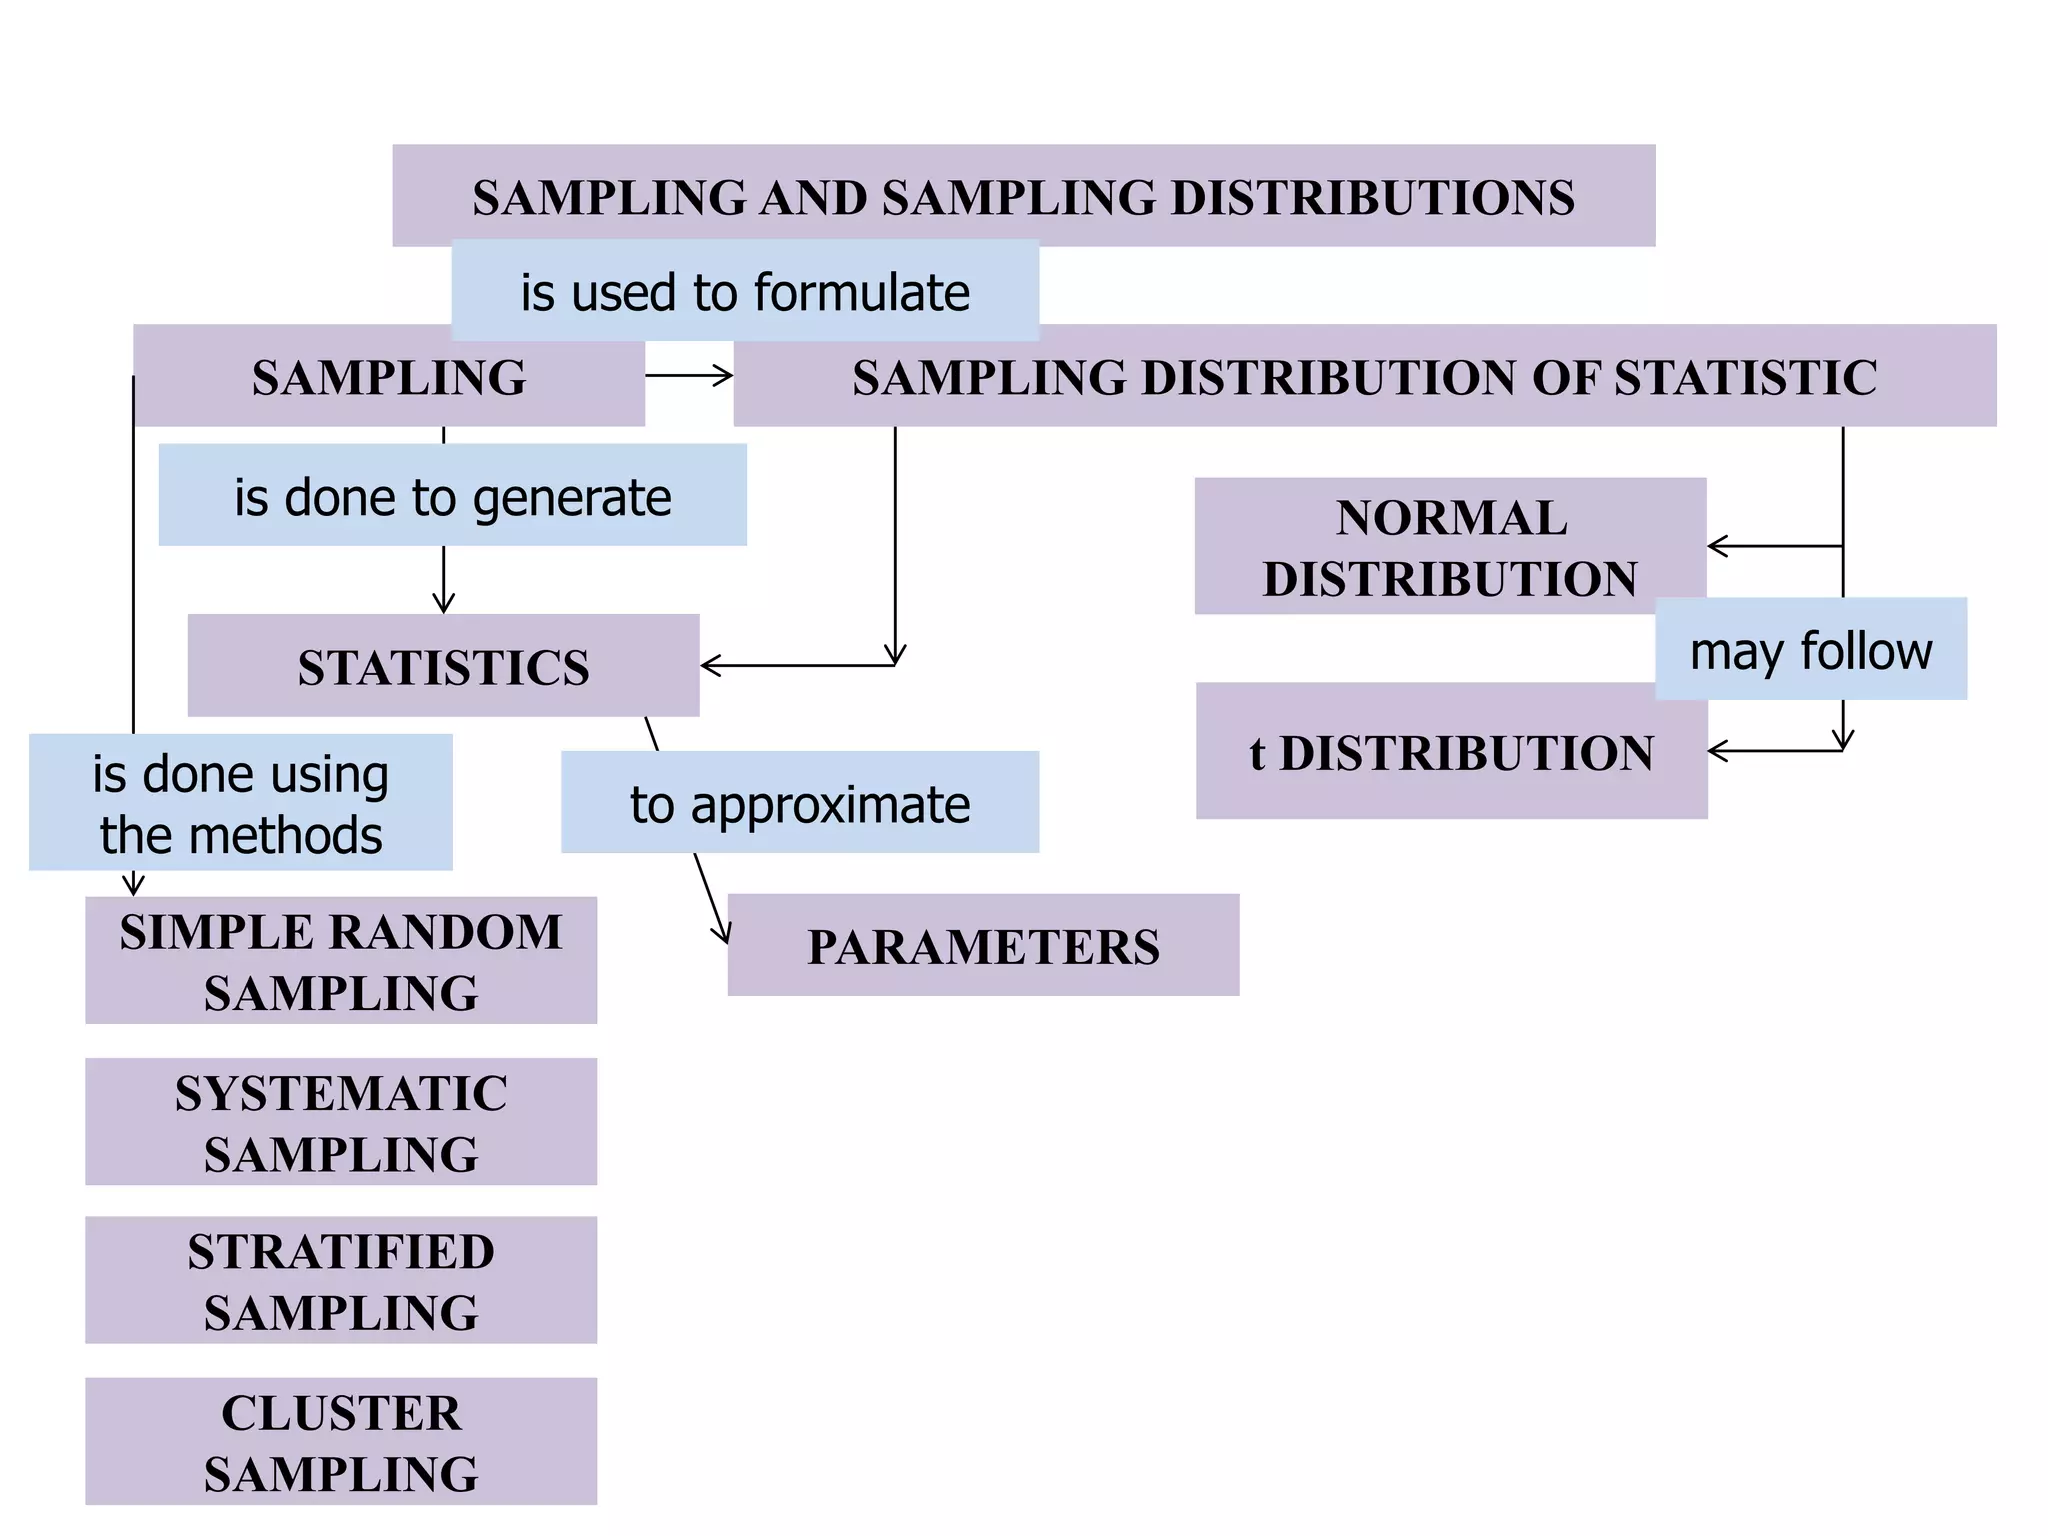
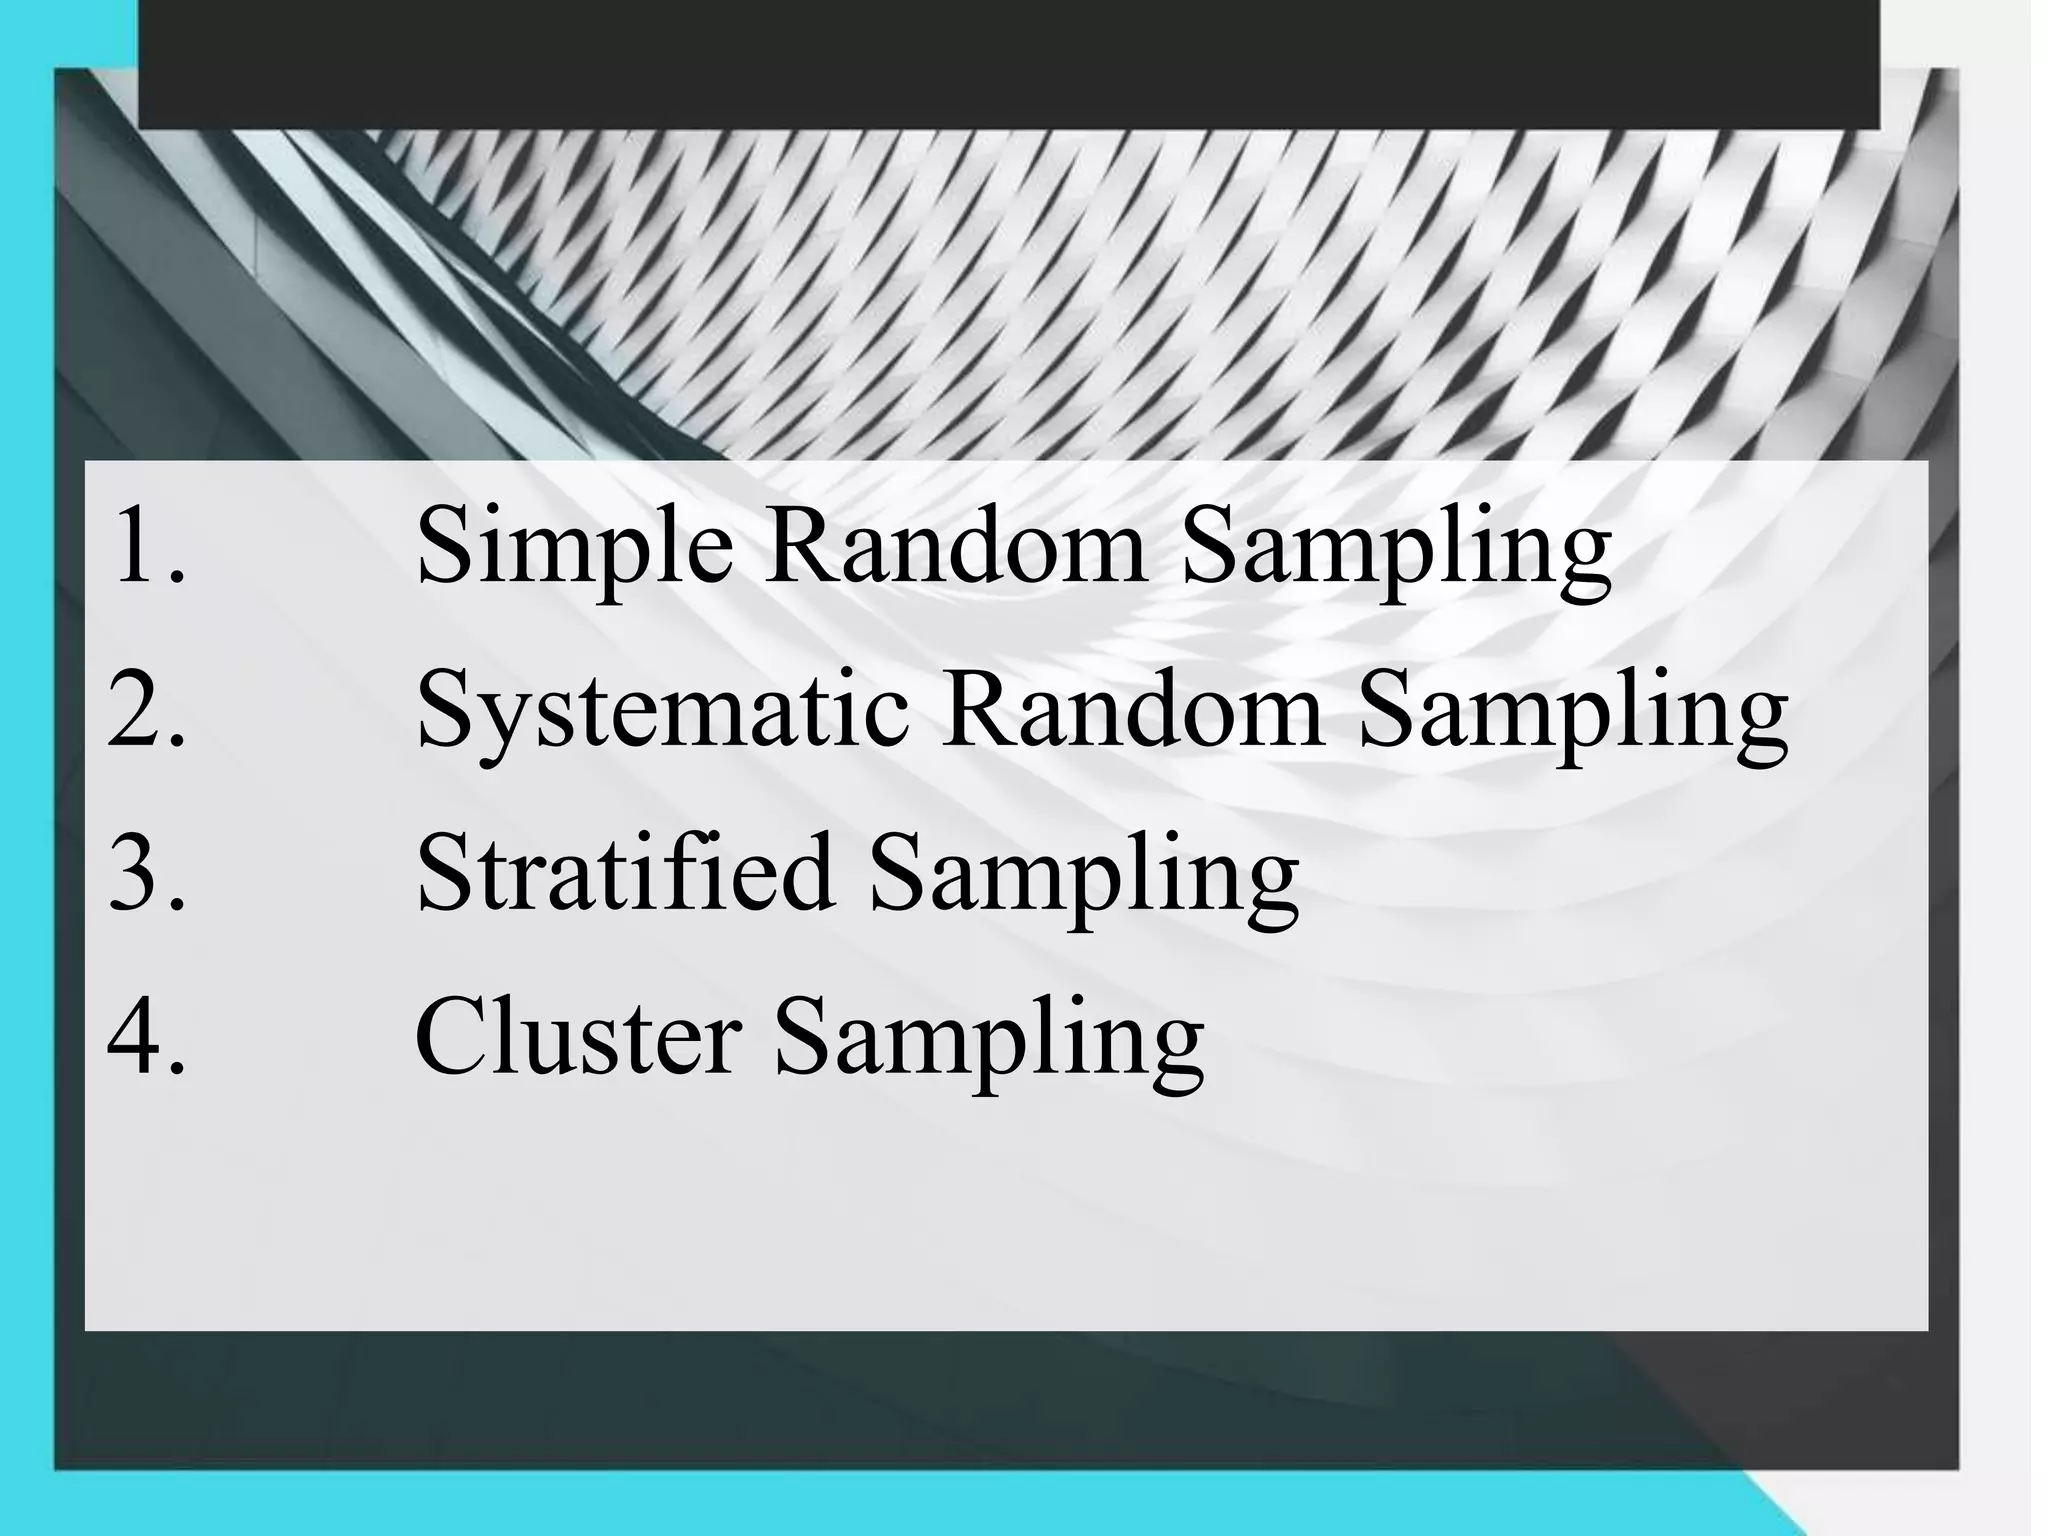
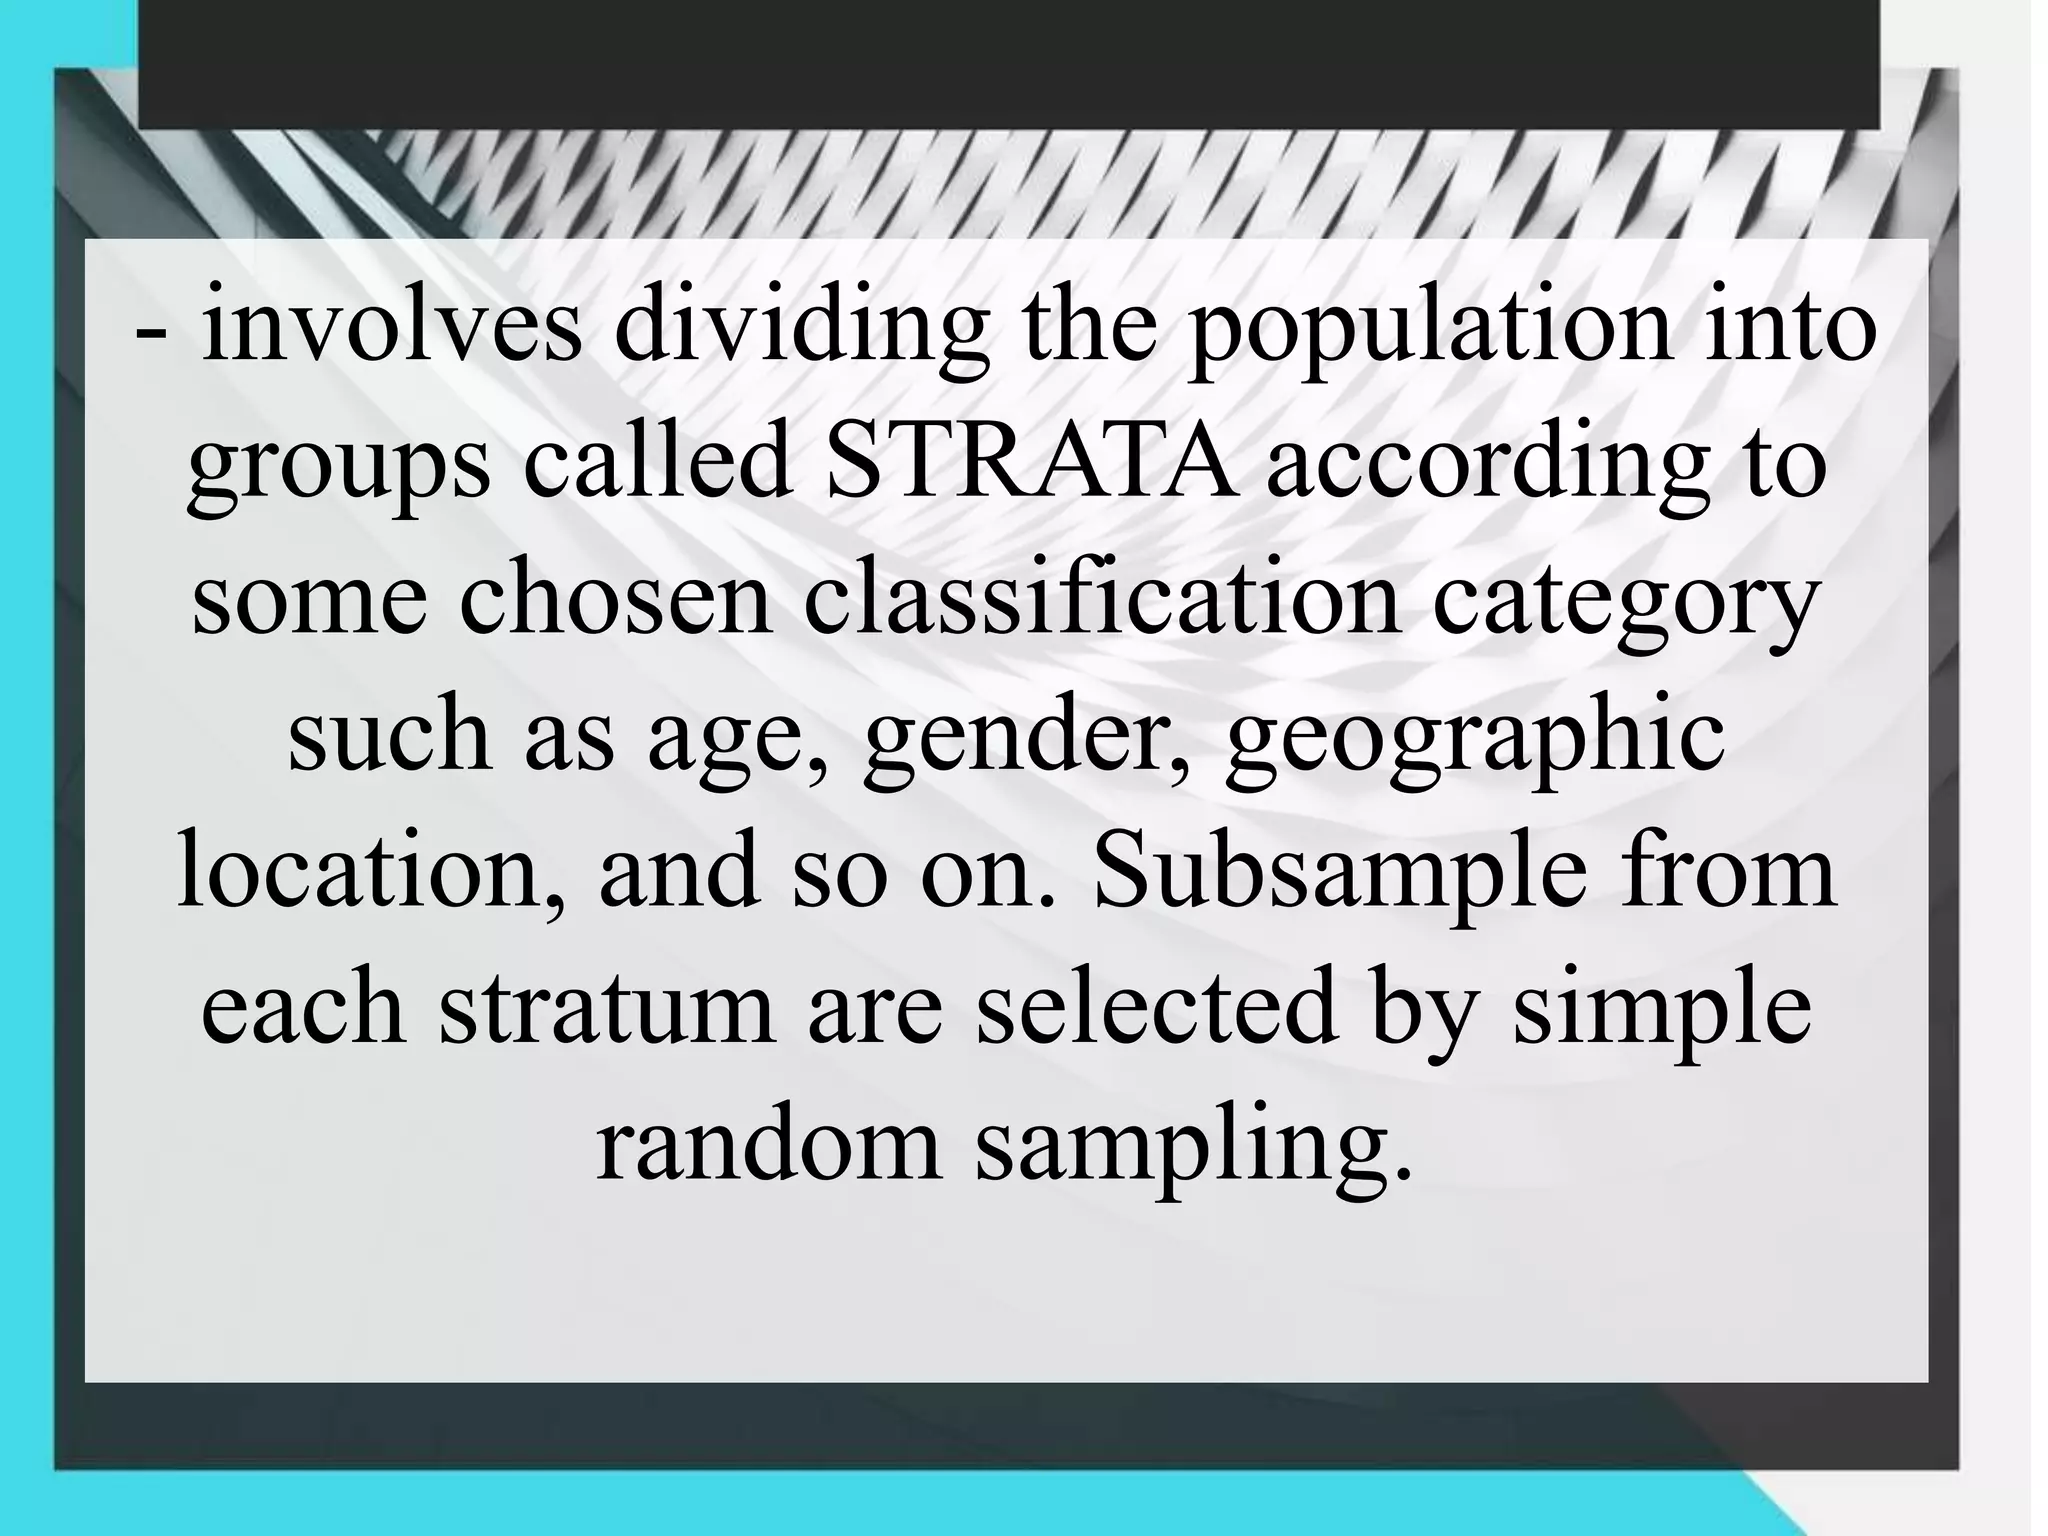
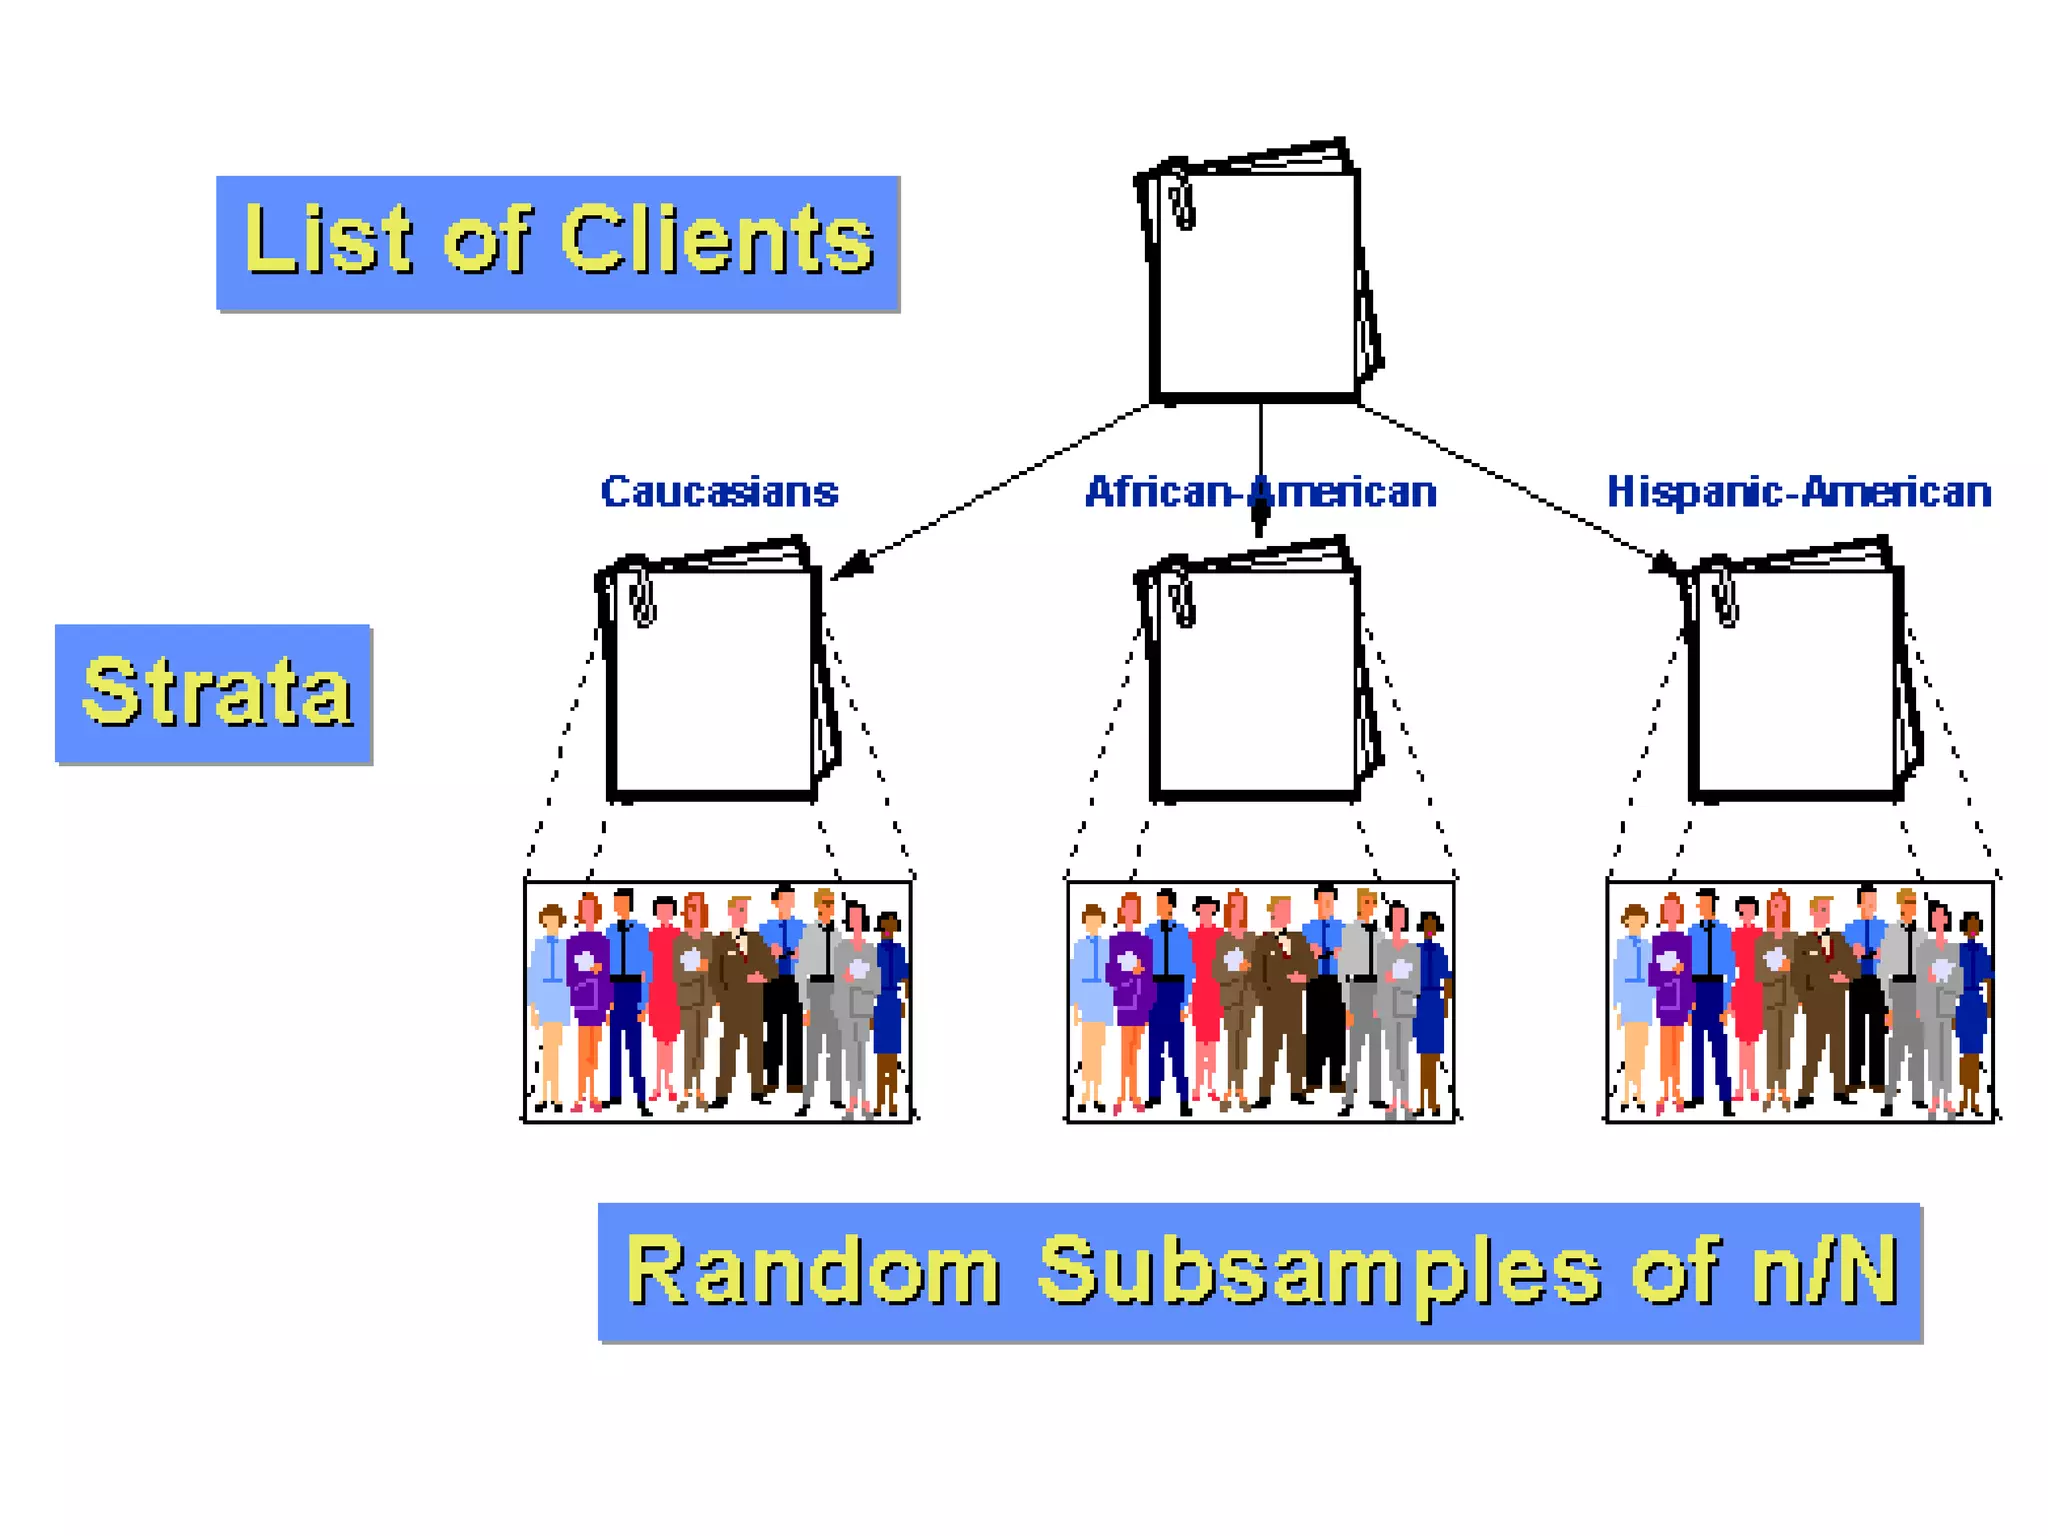
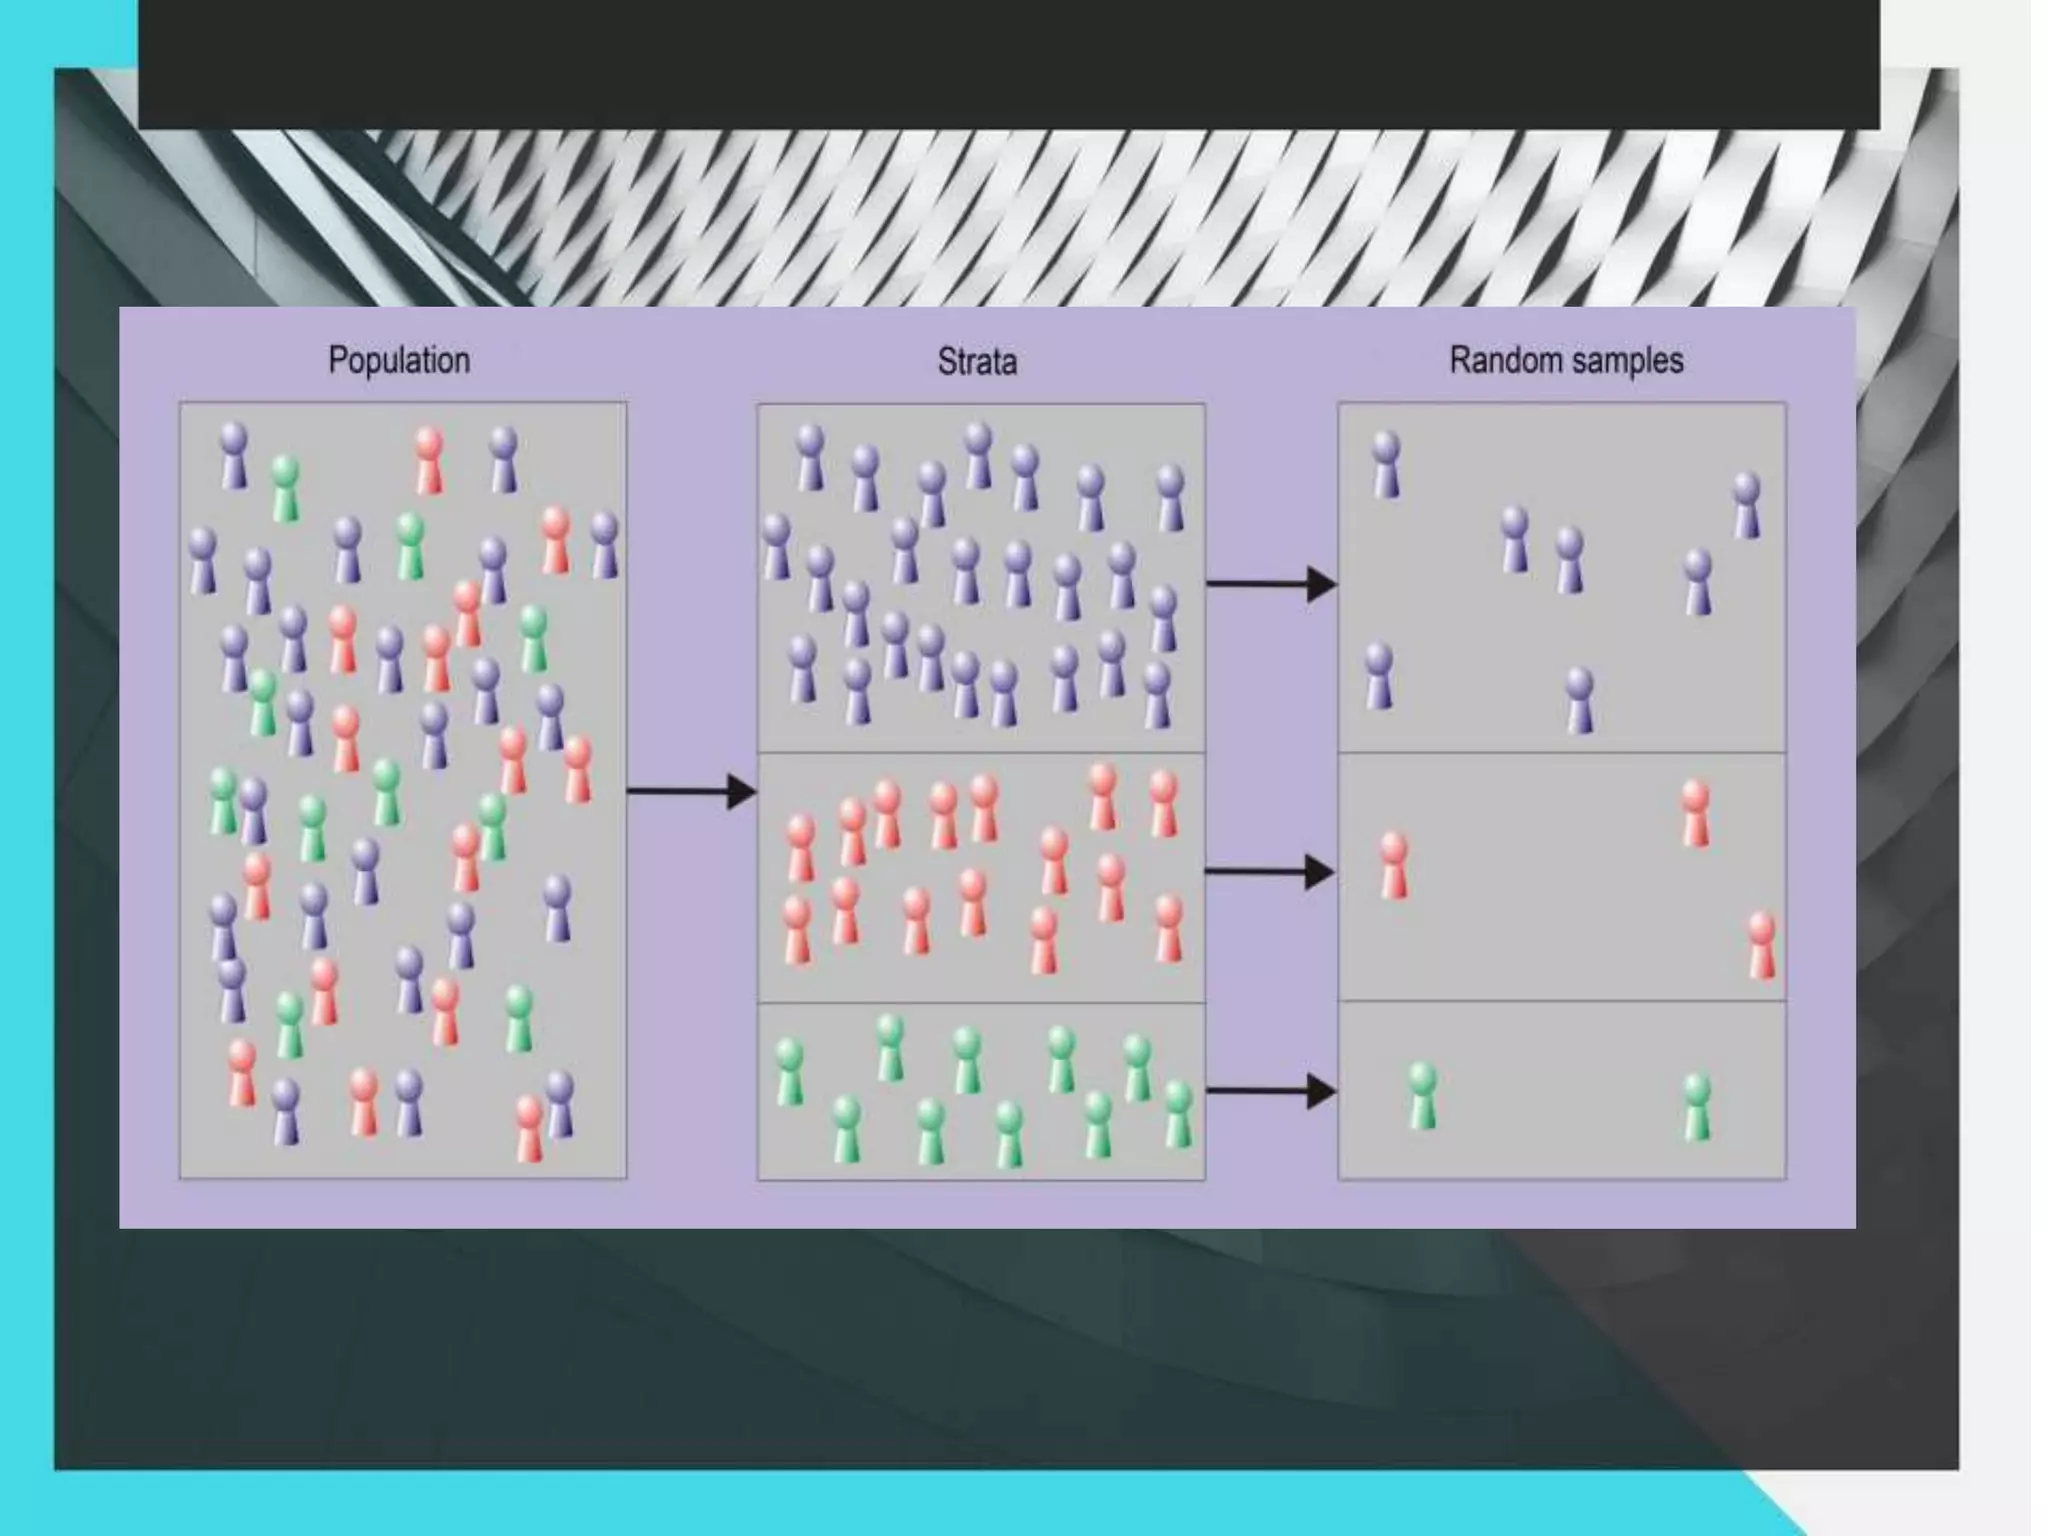
1. The document discusses different sampling methods including simple random sampling, systematic random sampling, stratified sampling, and cluster sampling.
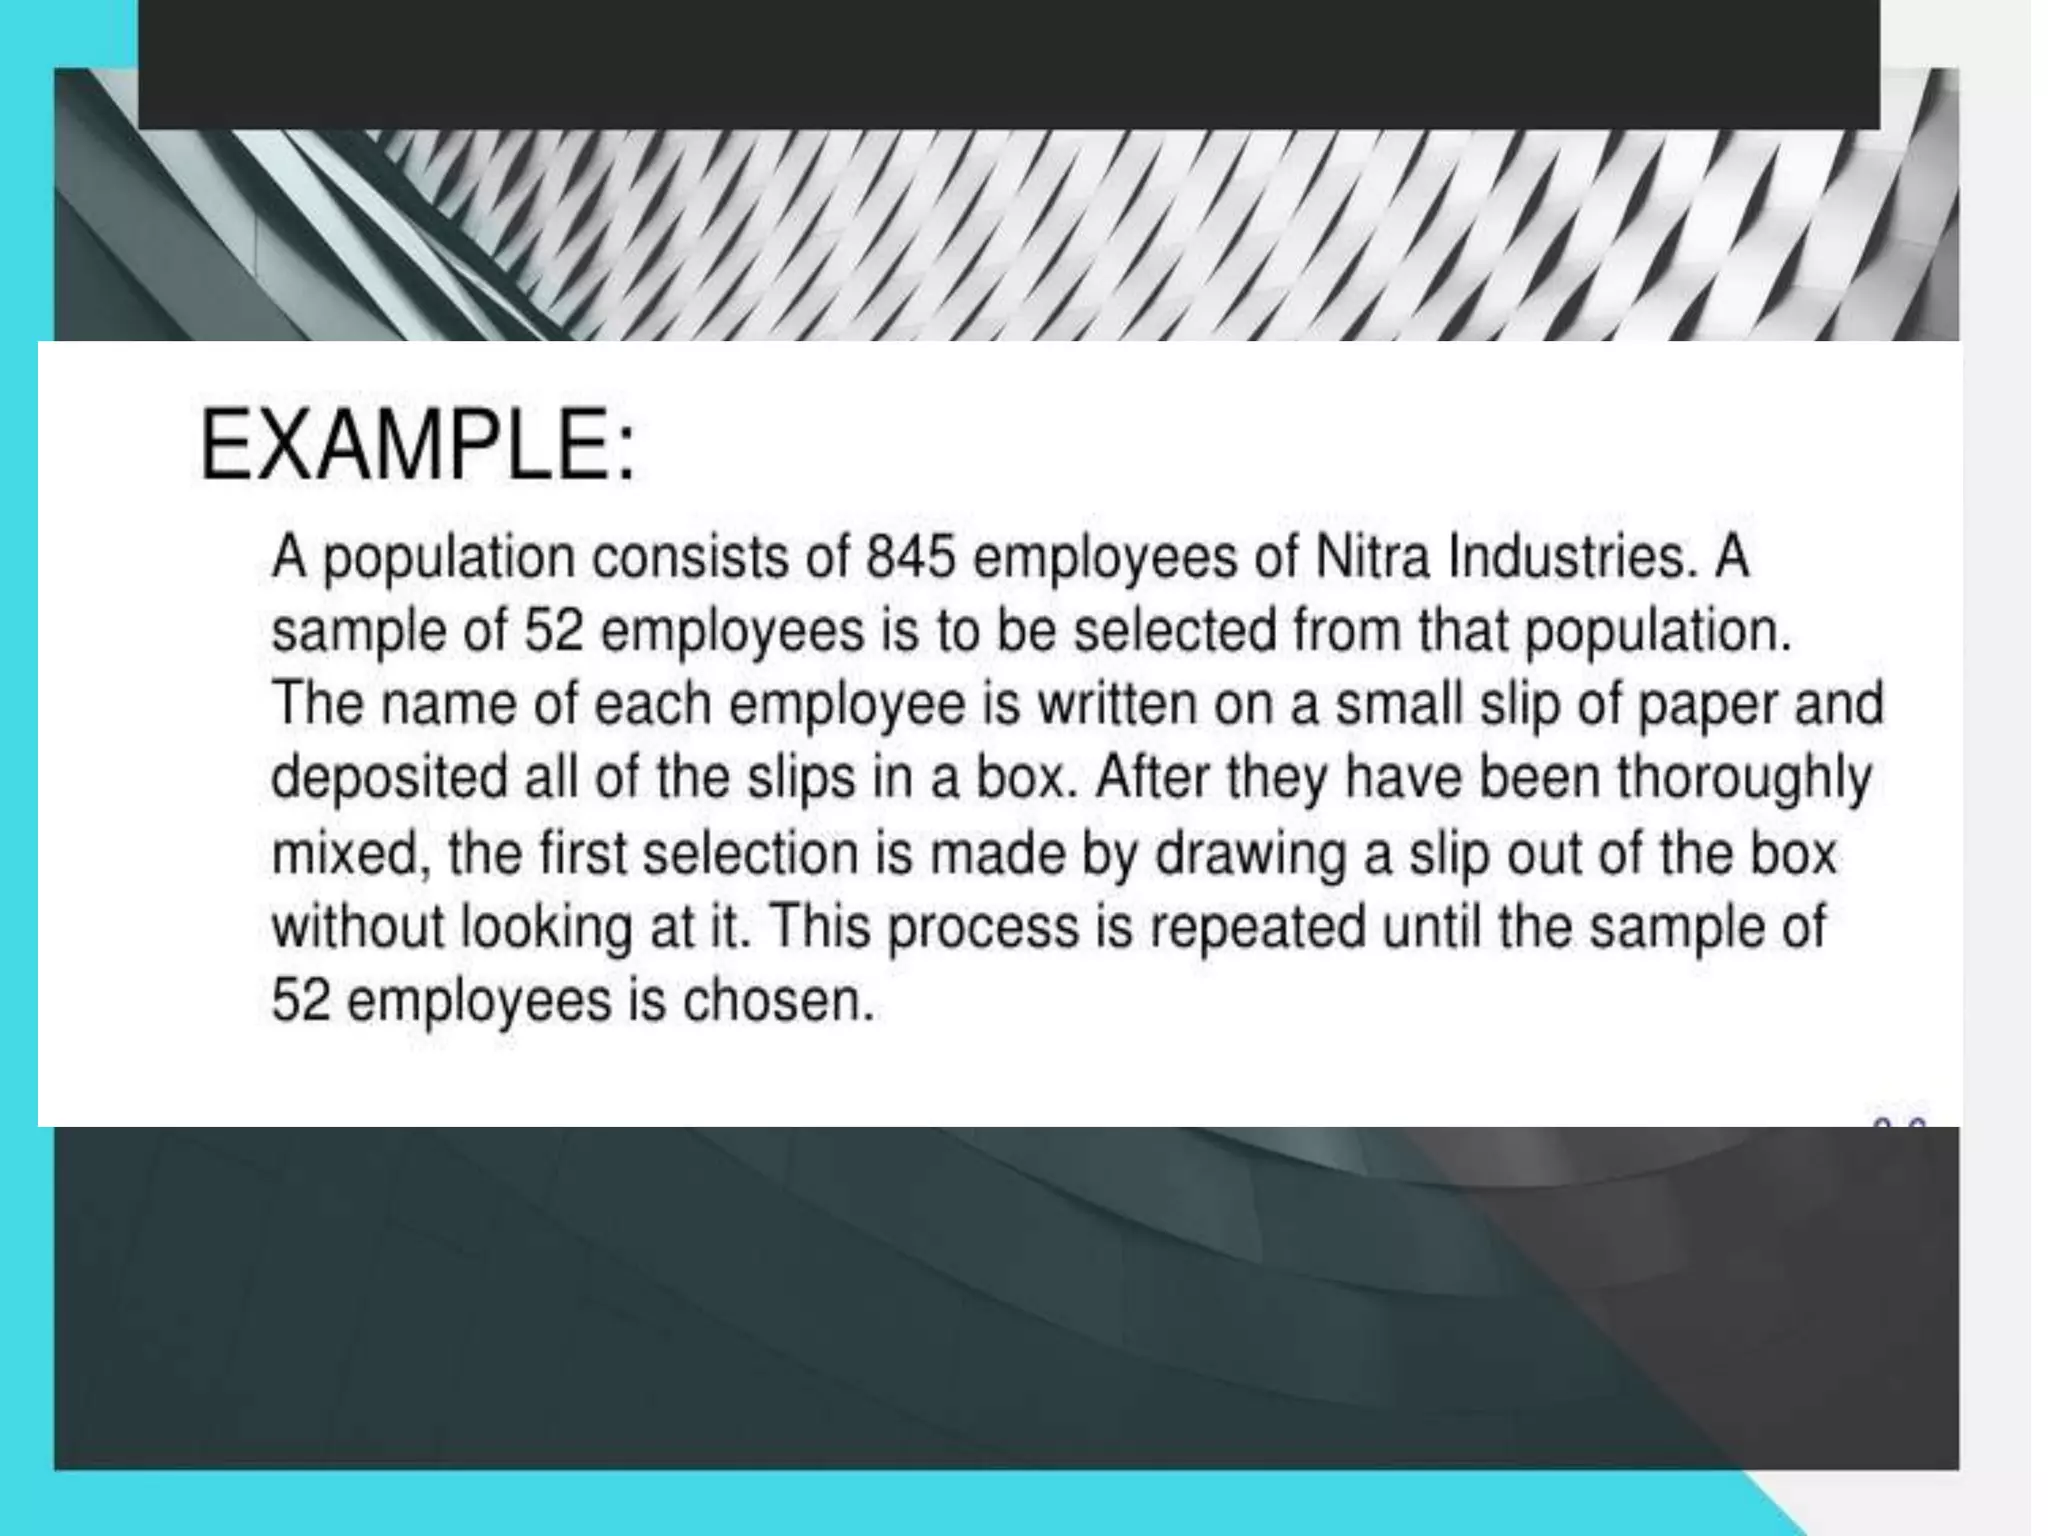
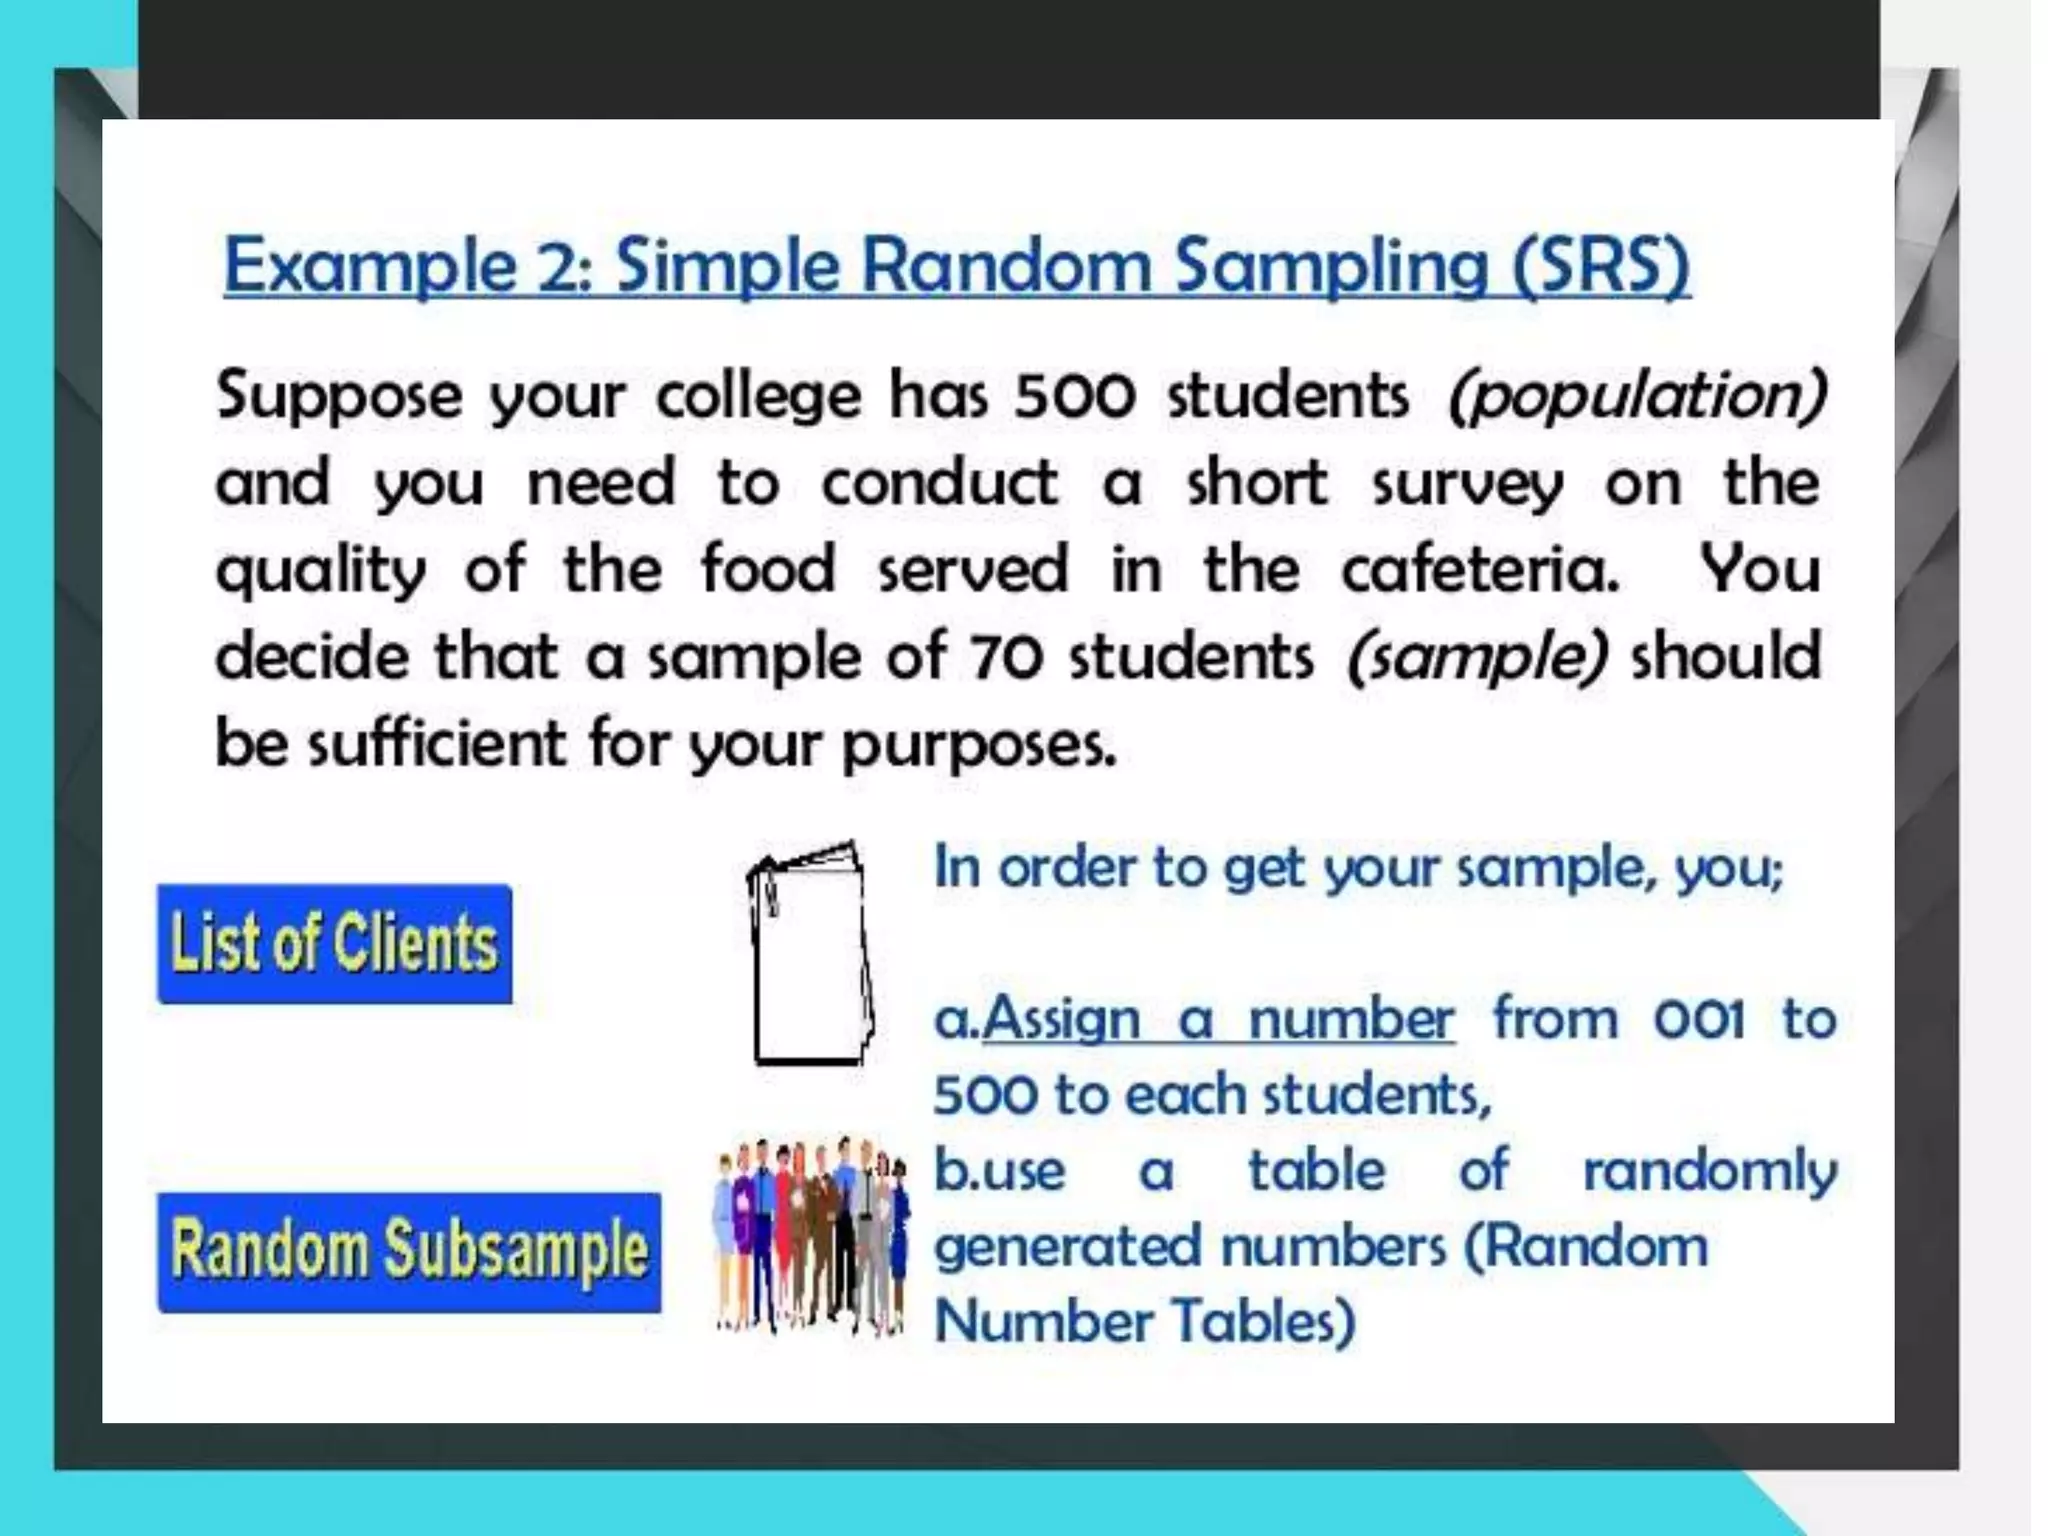
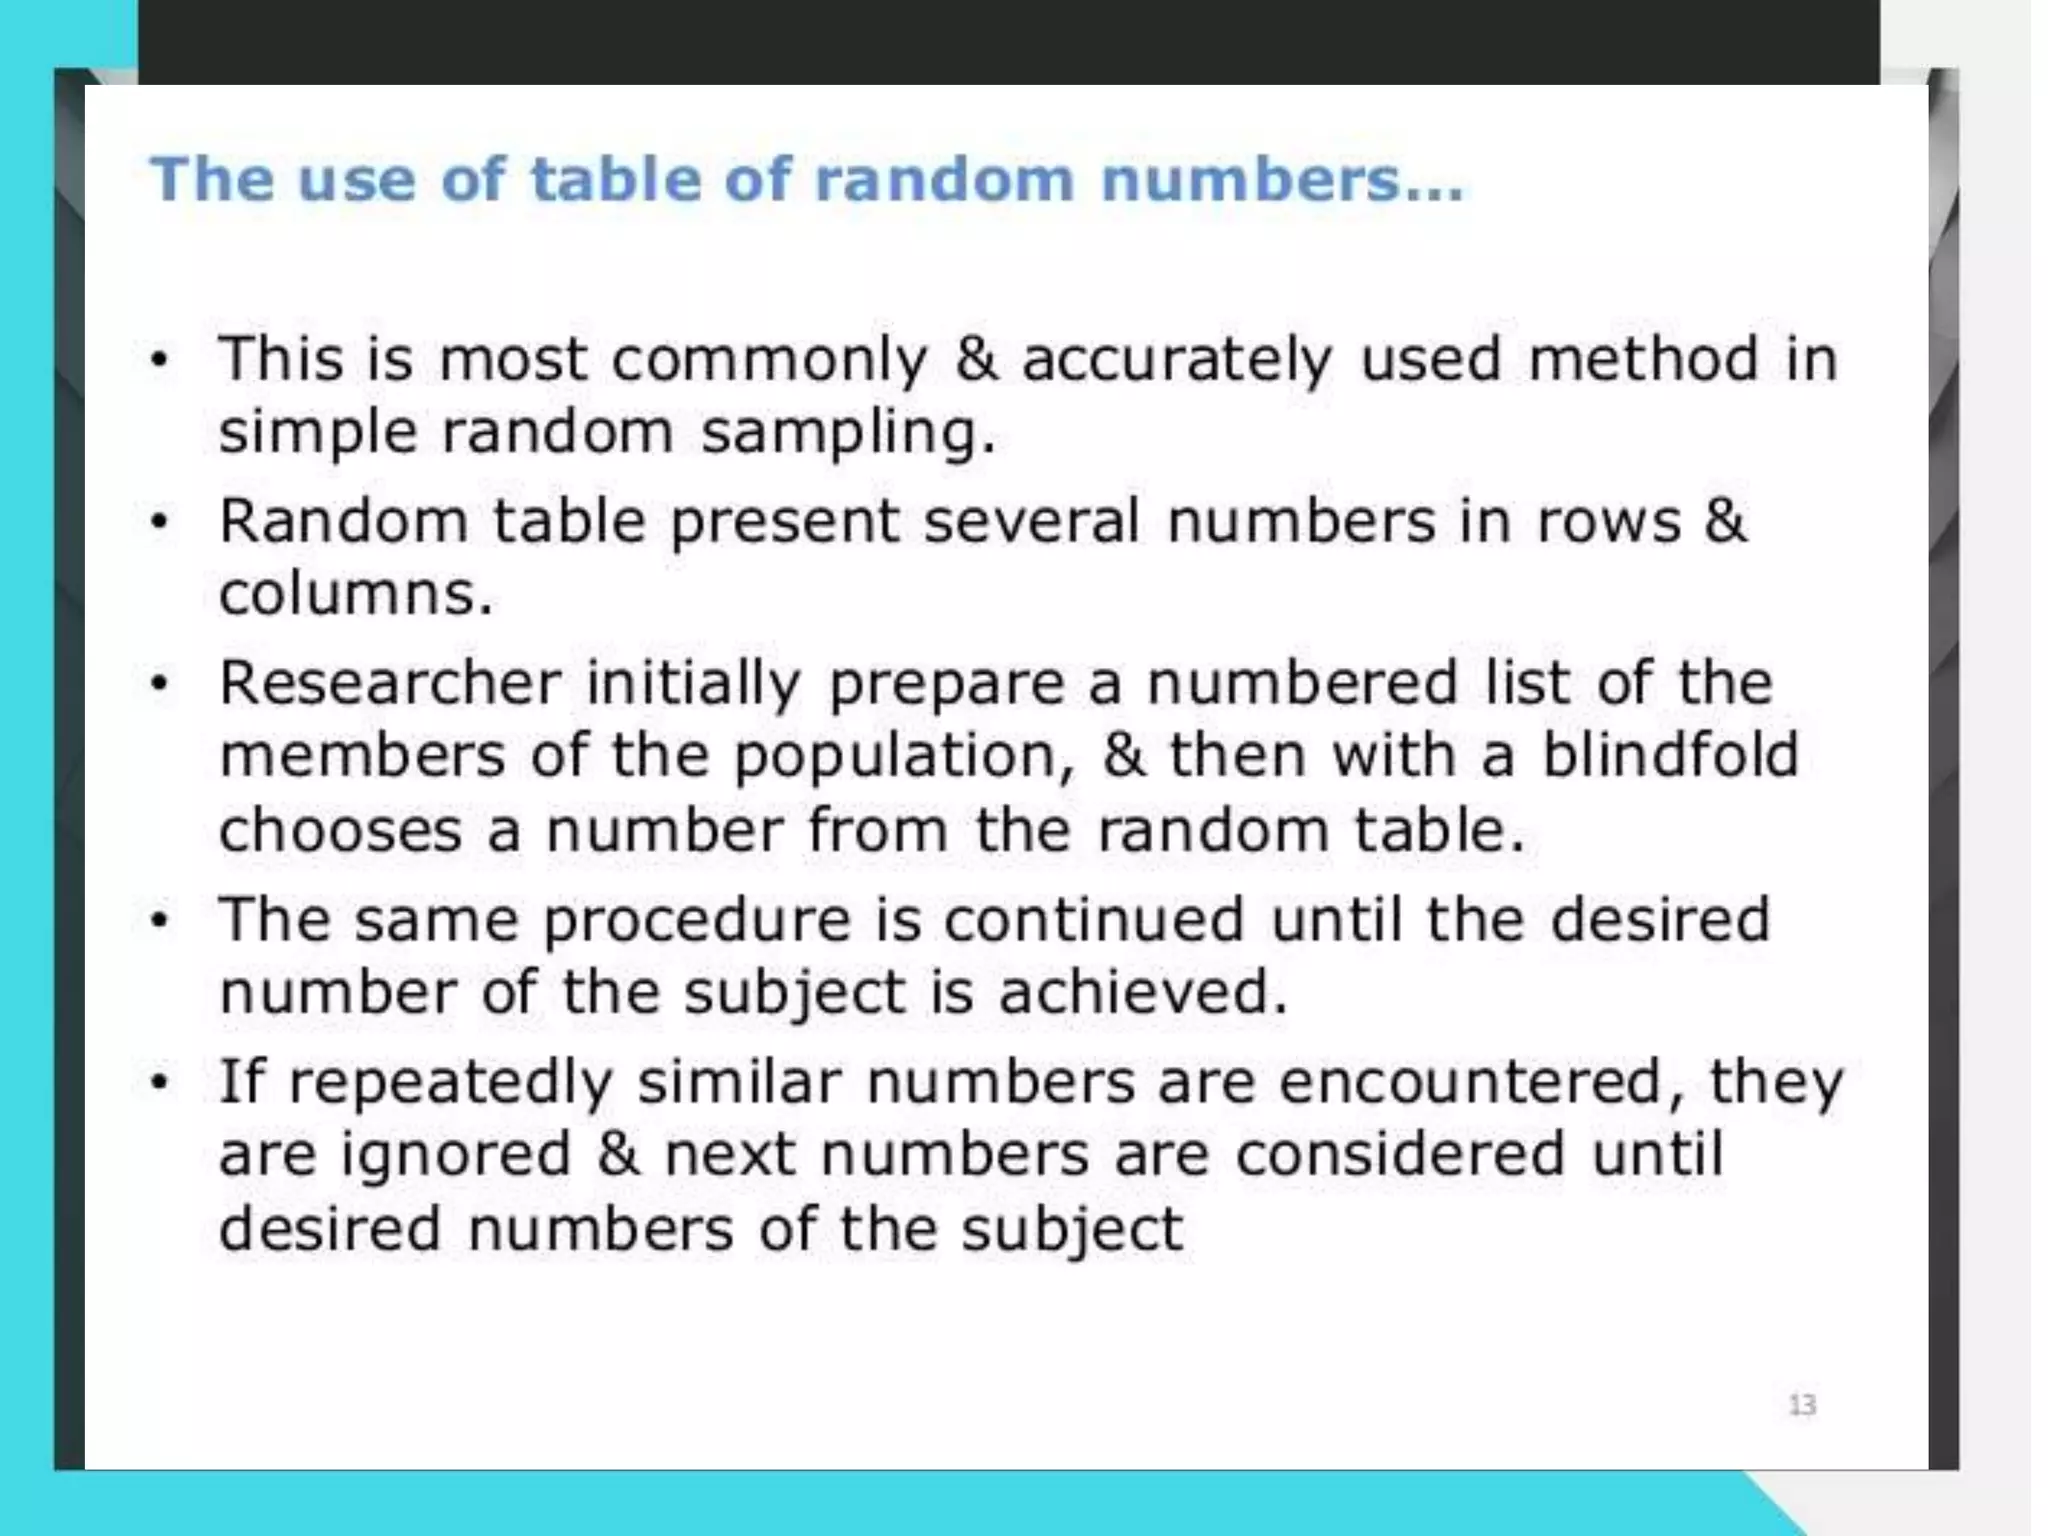
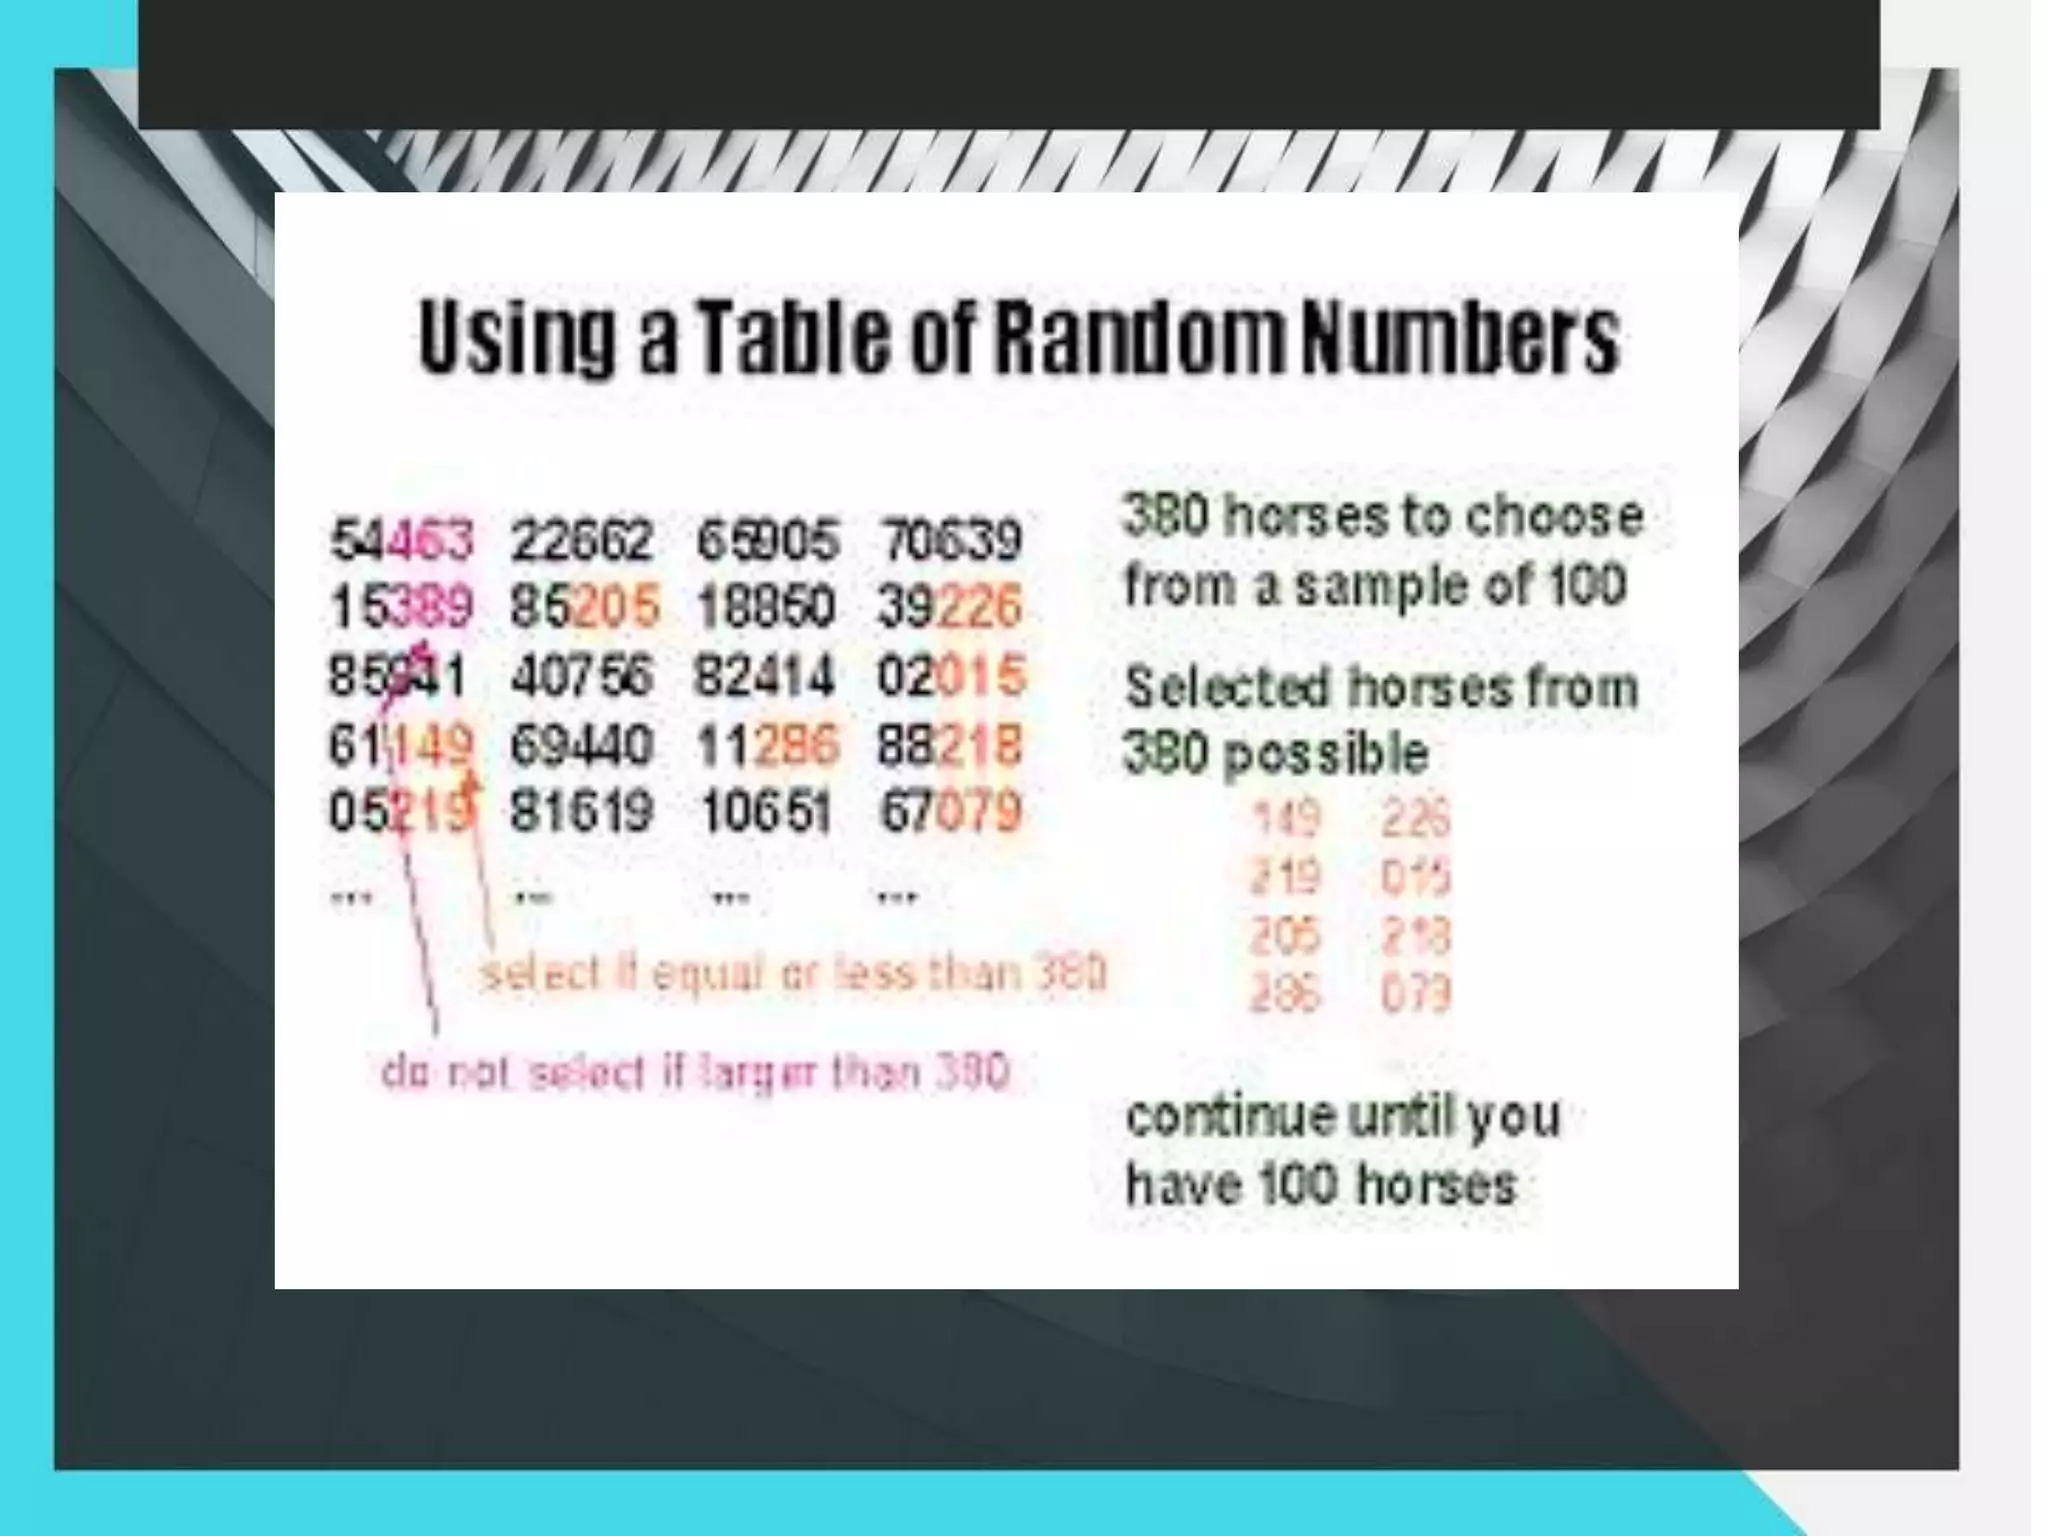
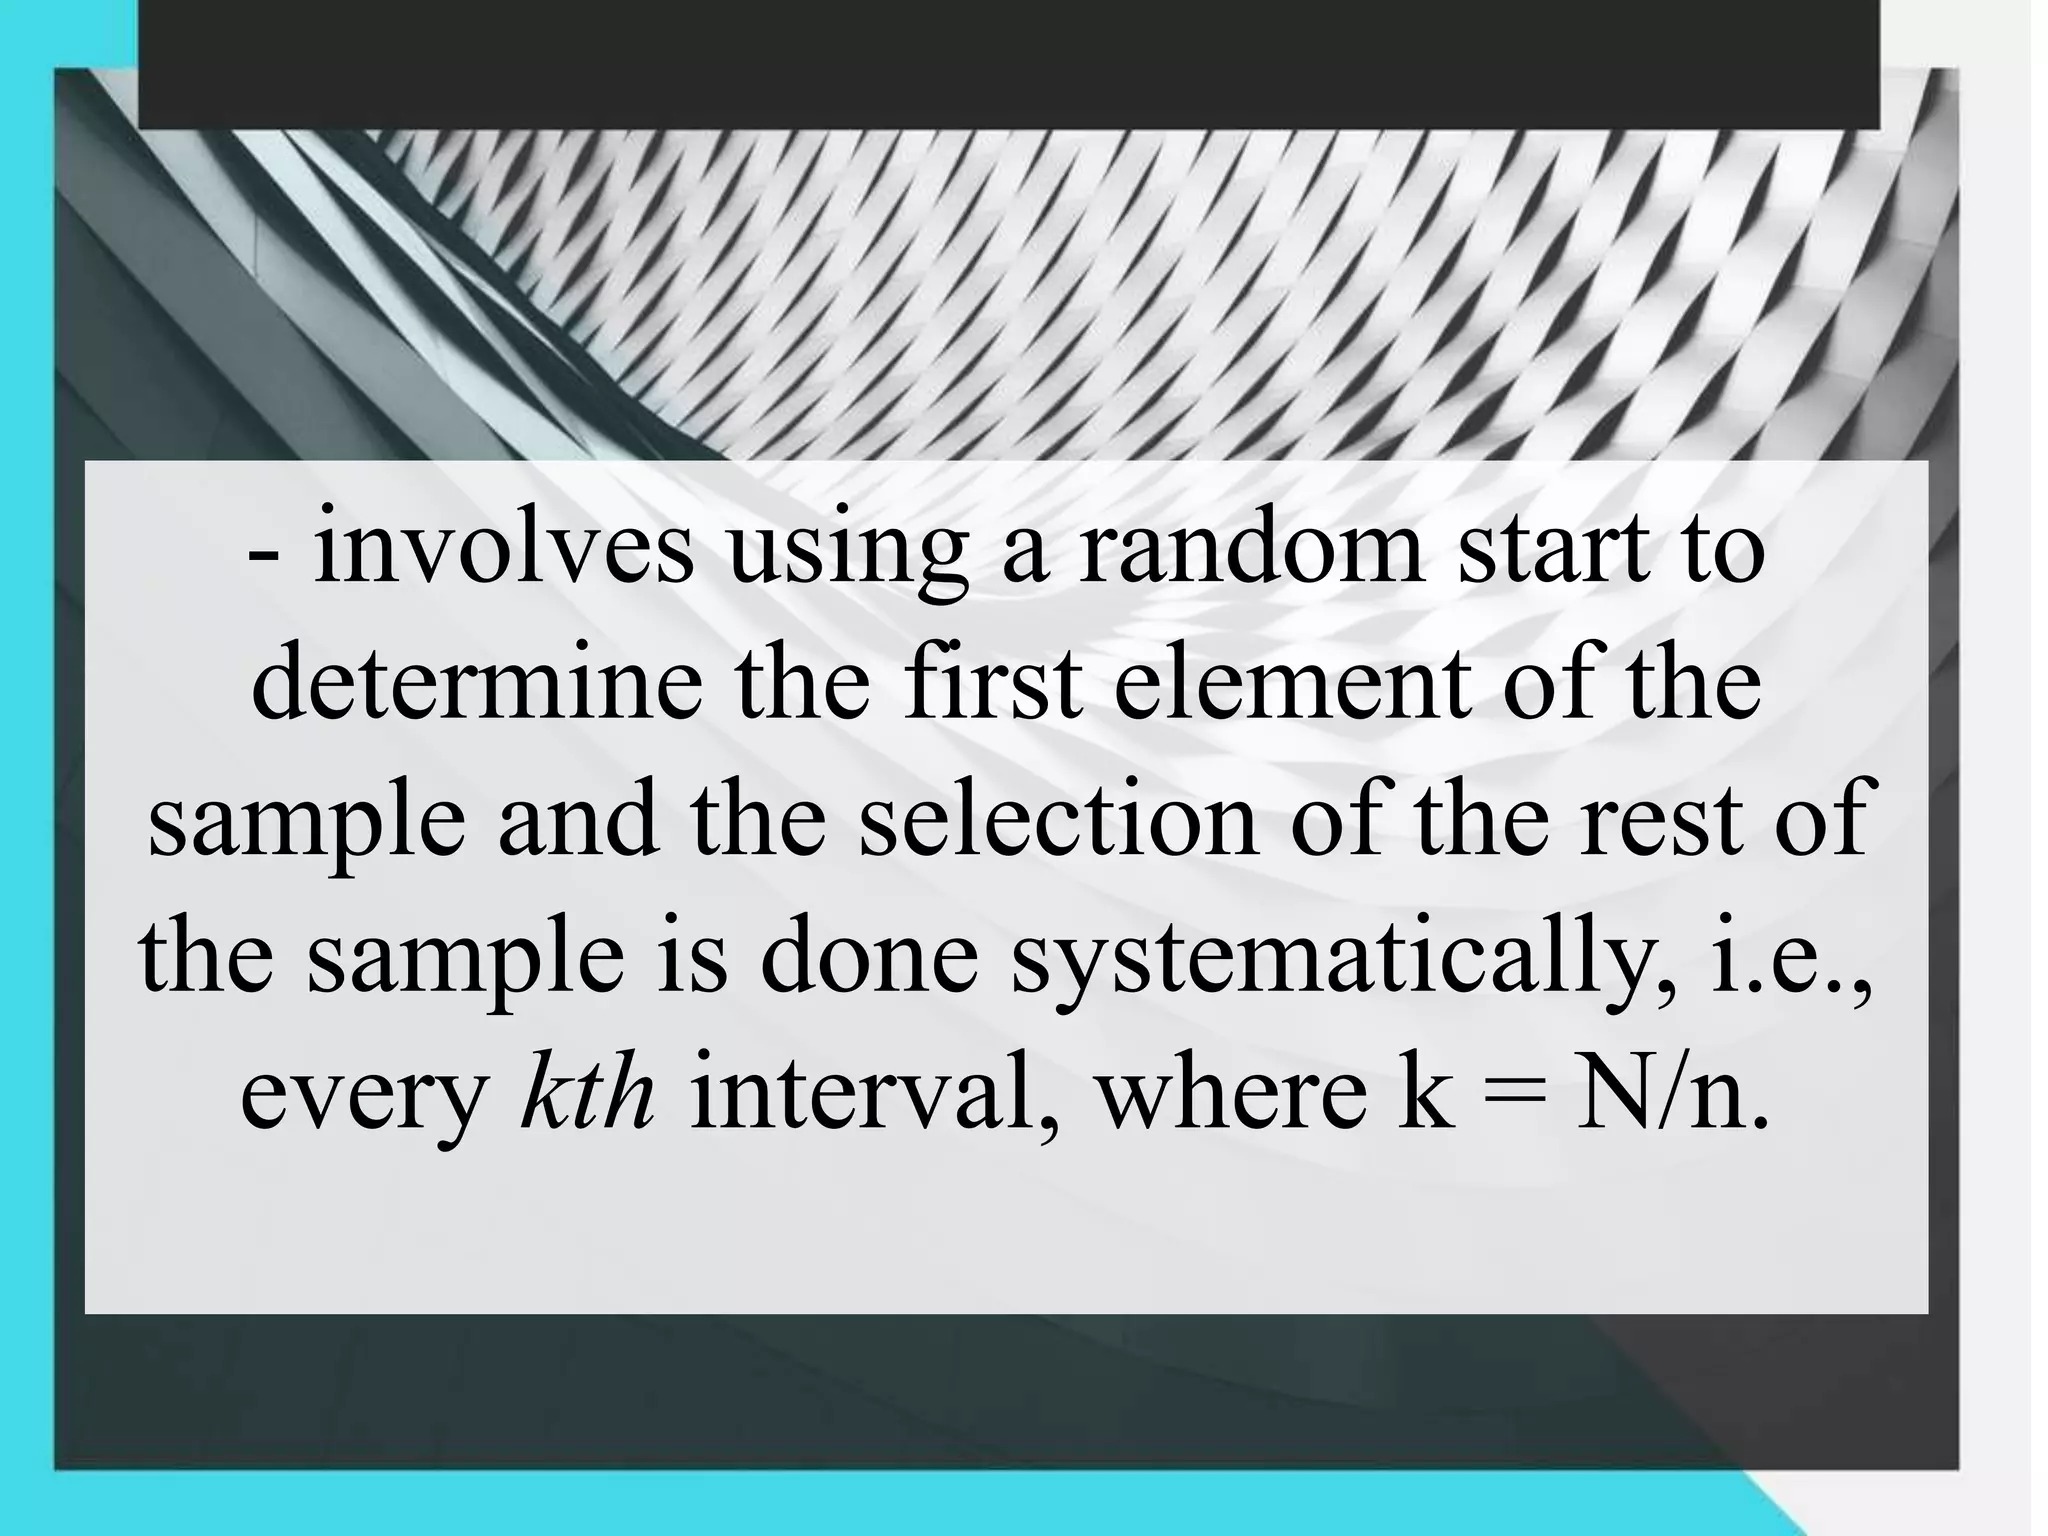
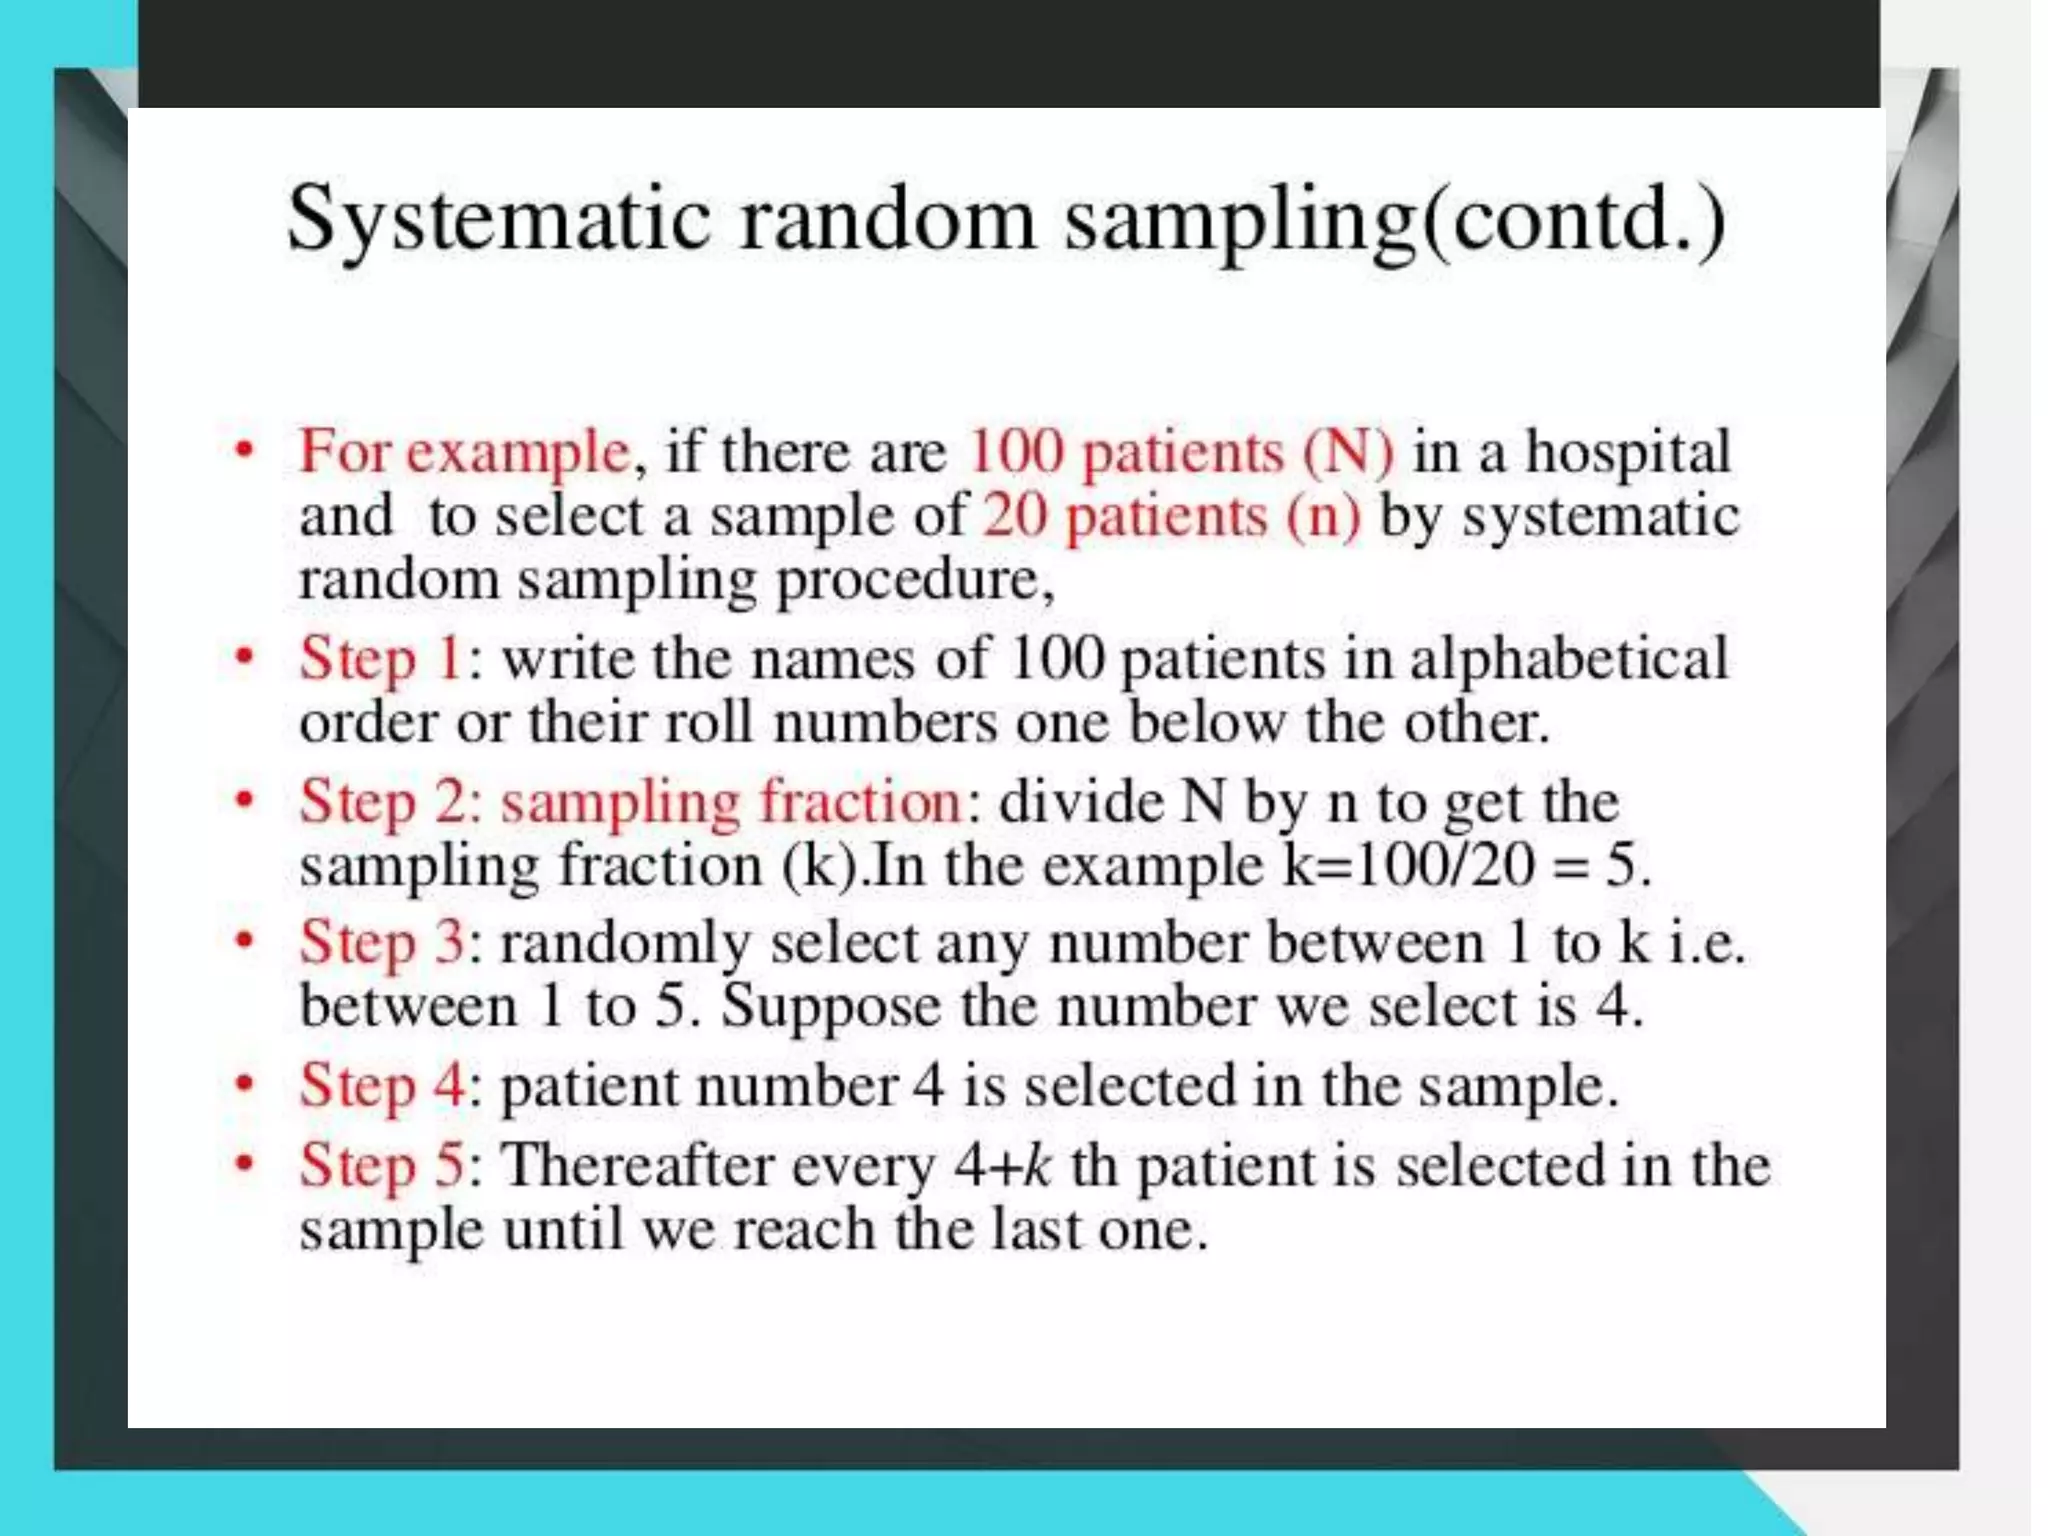
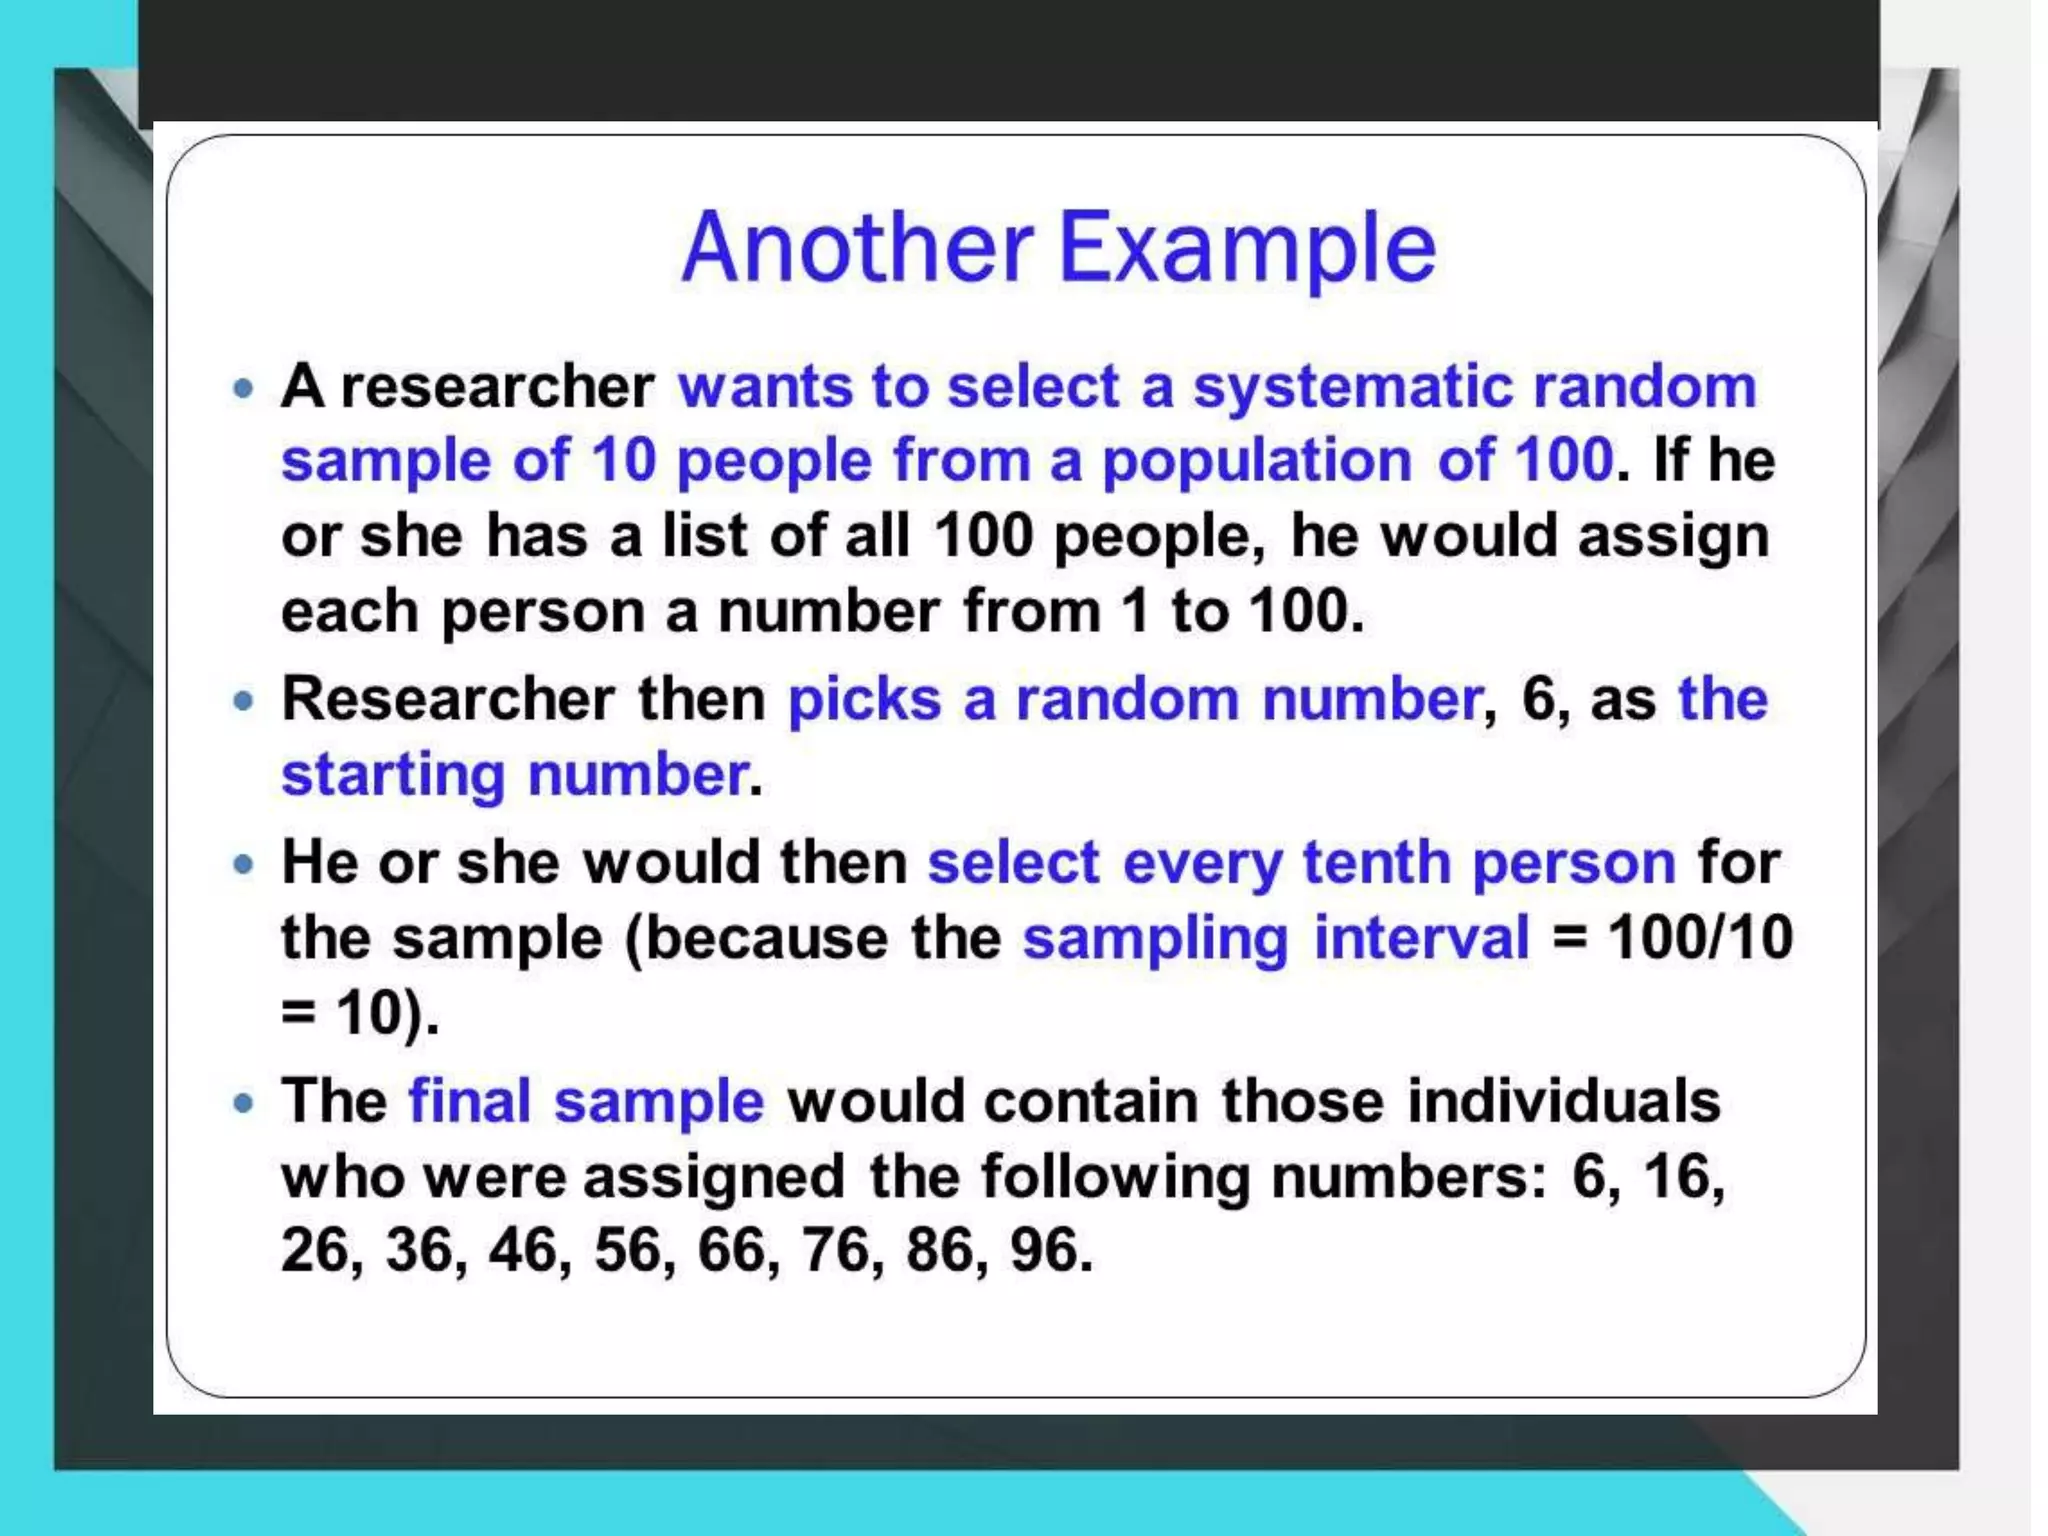
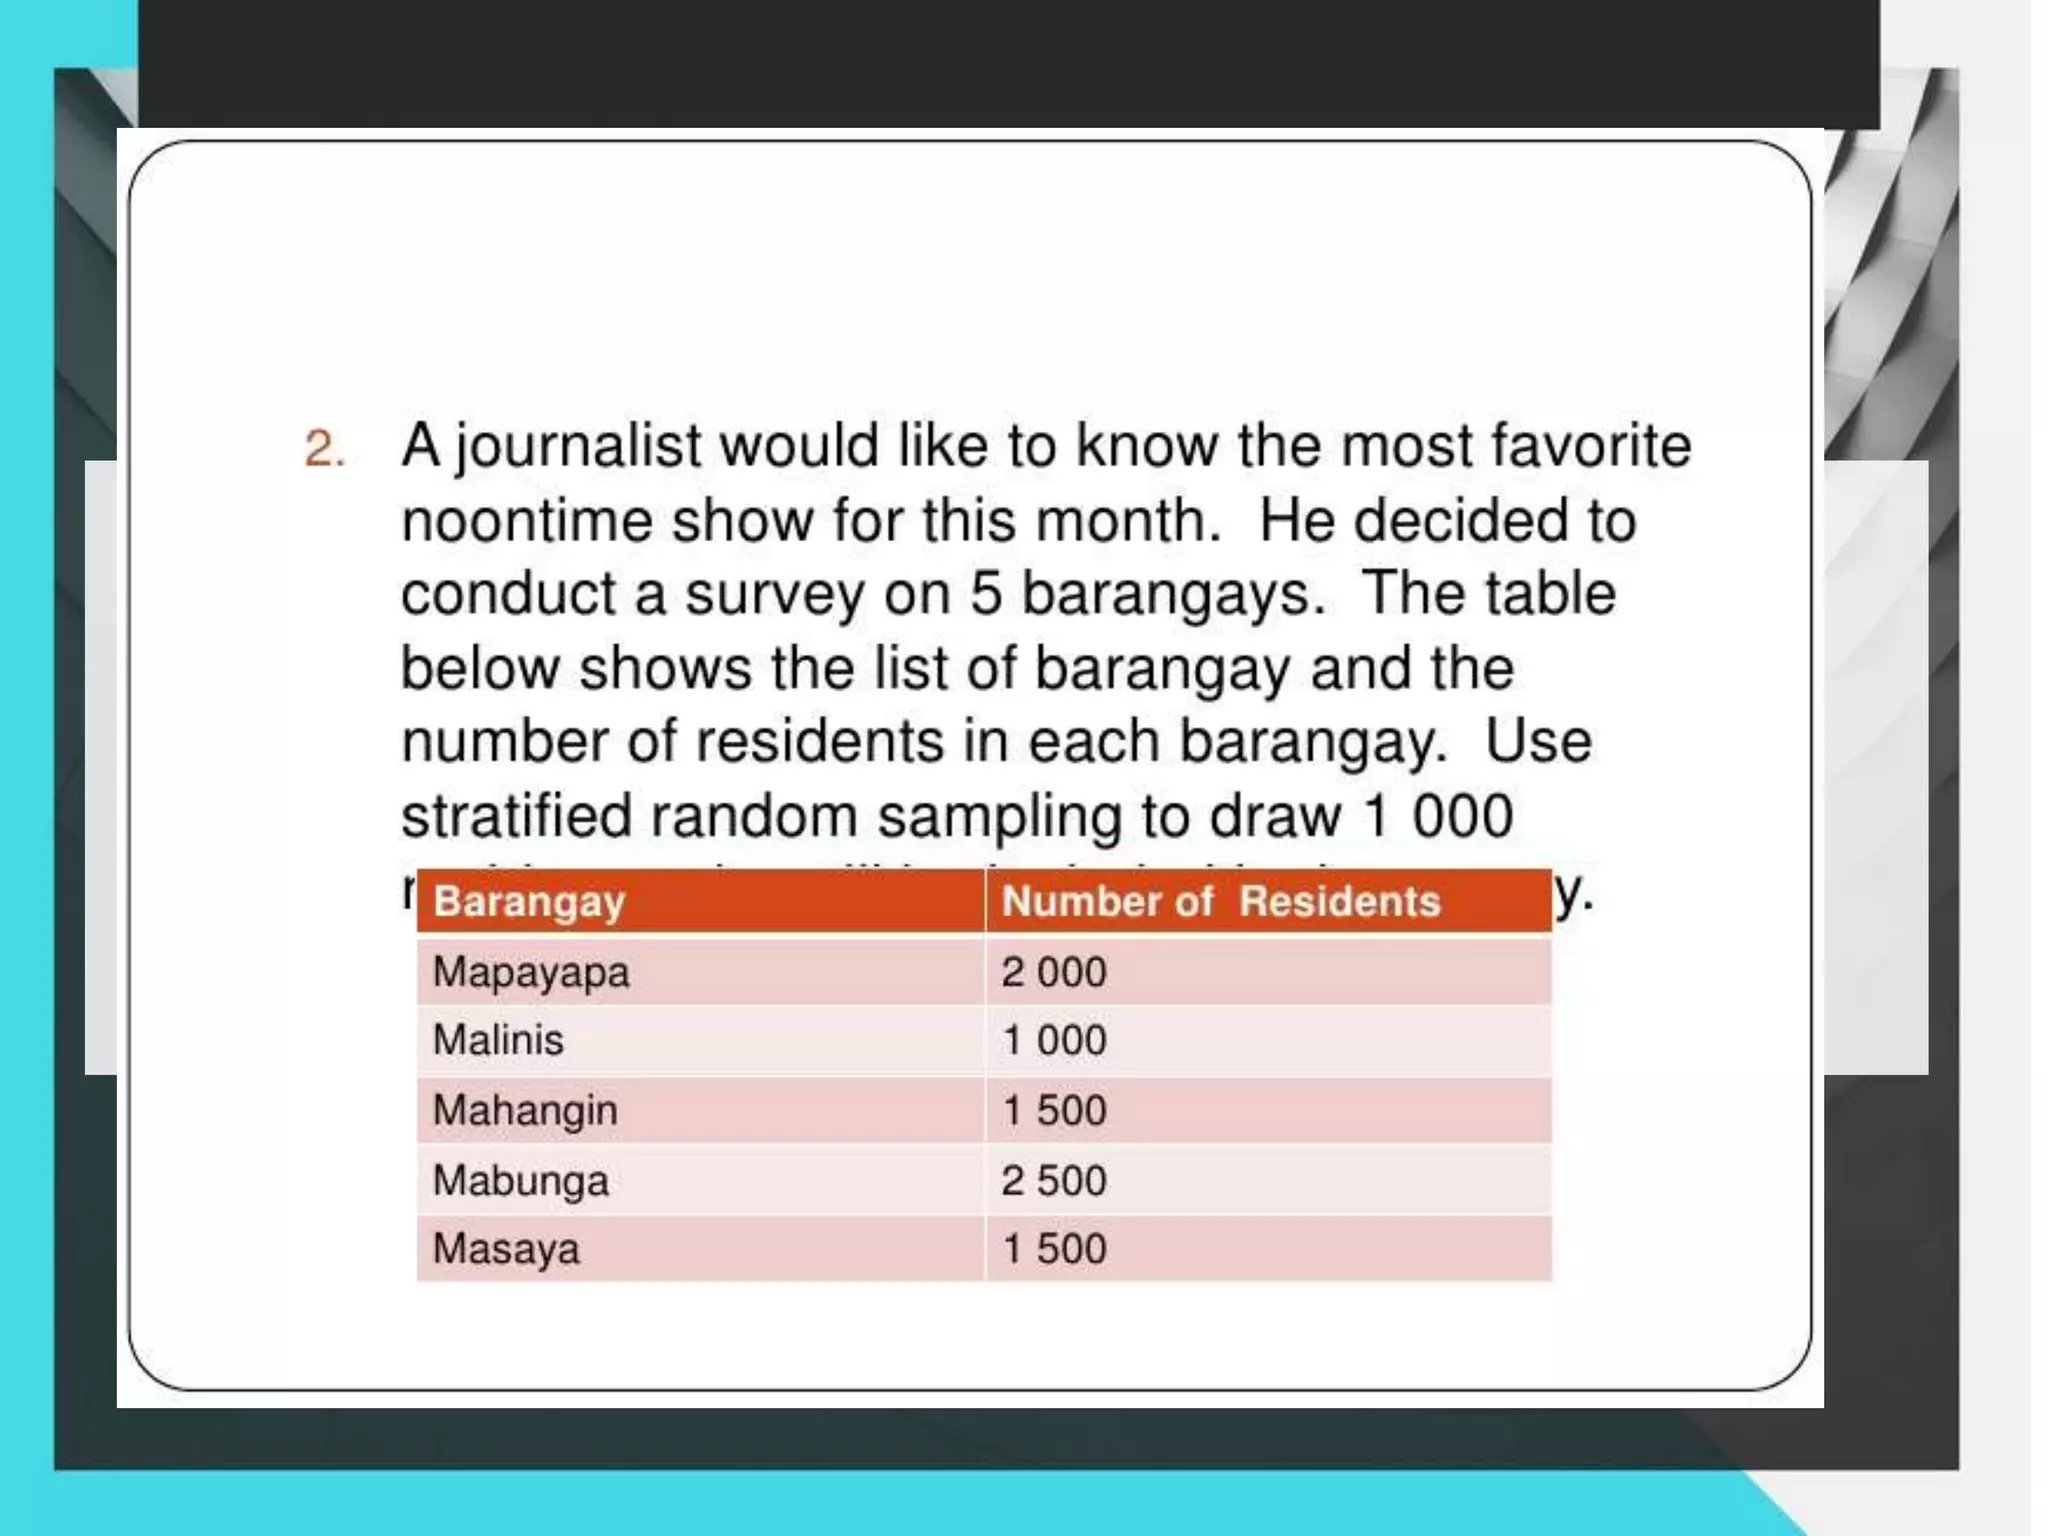
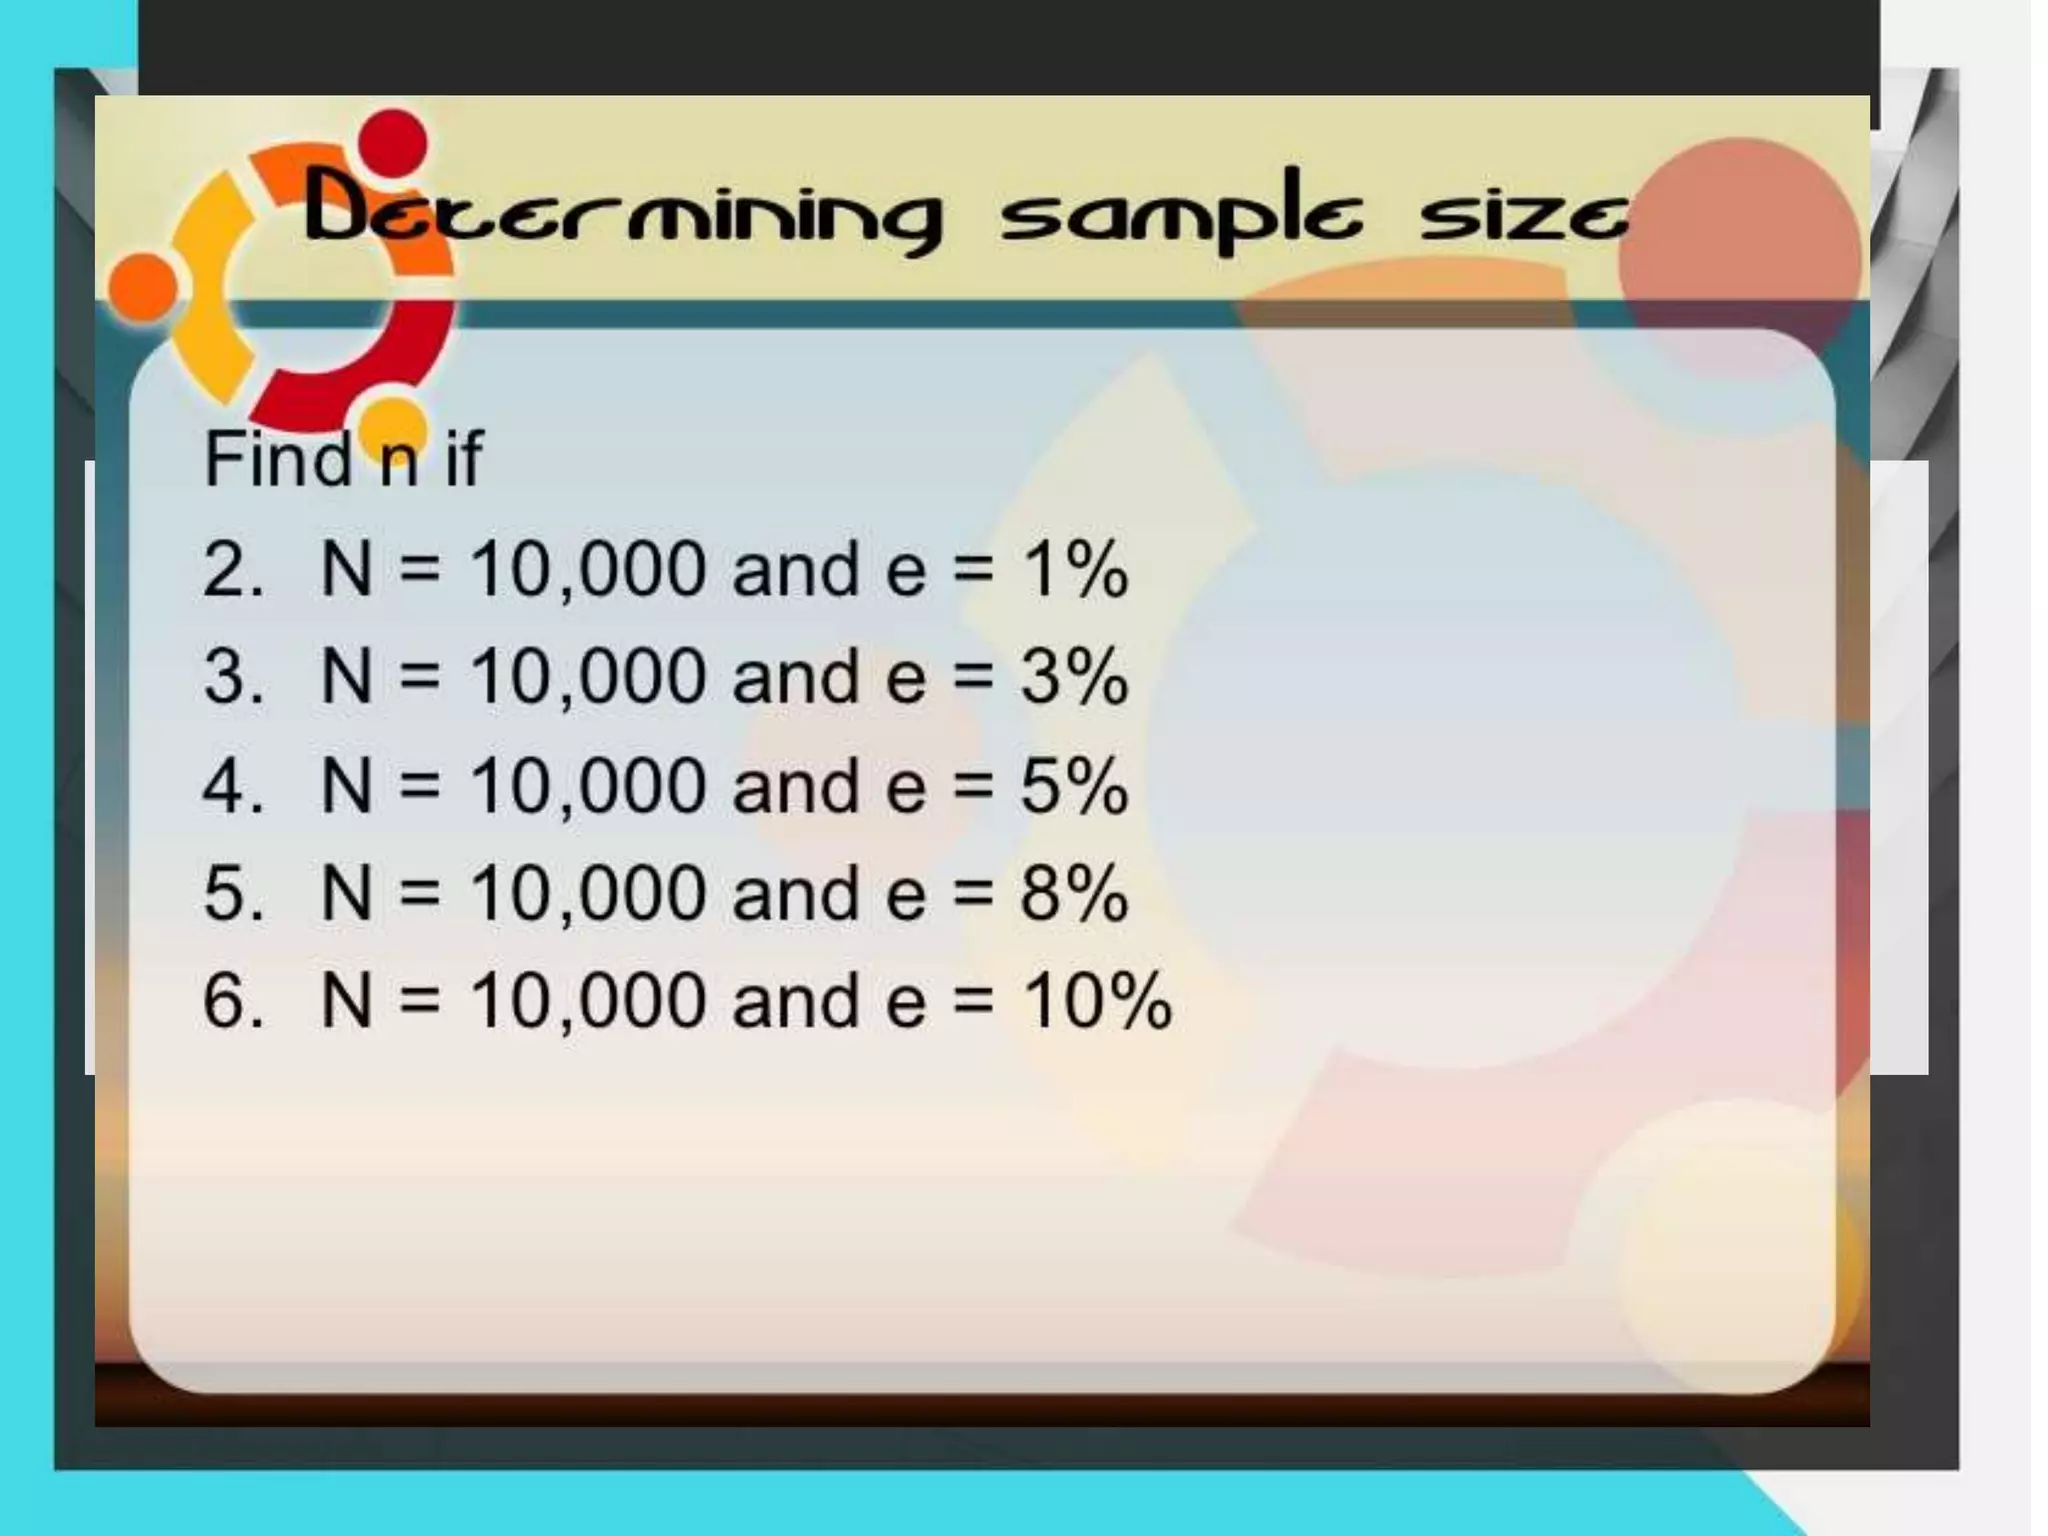
2. It provides examples of how each sampling method works and how samples are selected from the overall population.
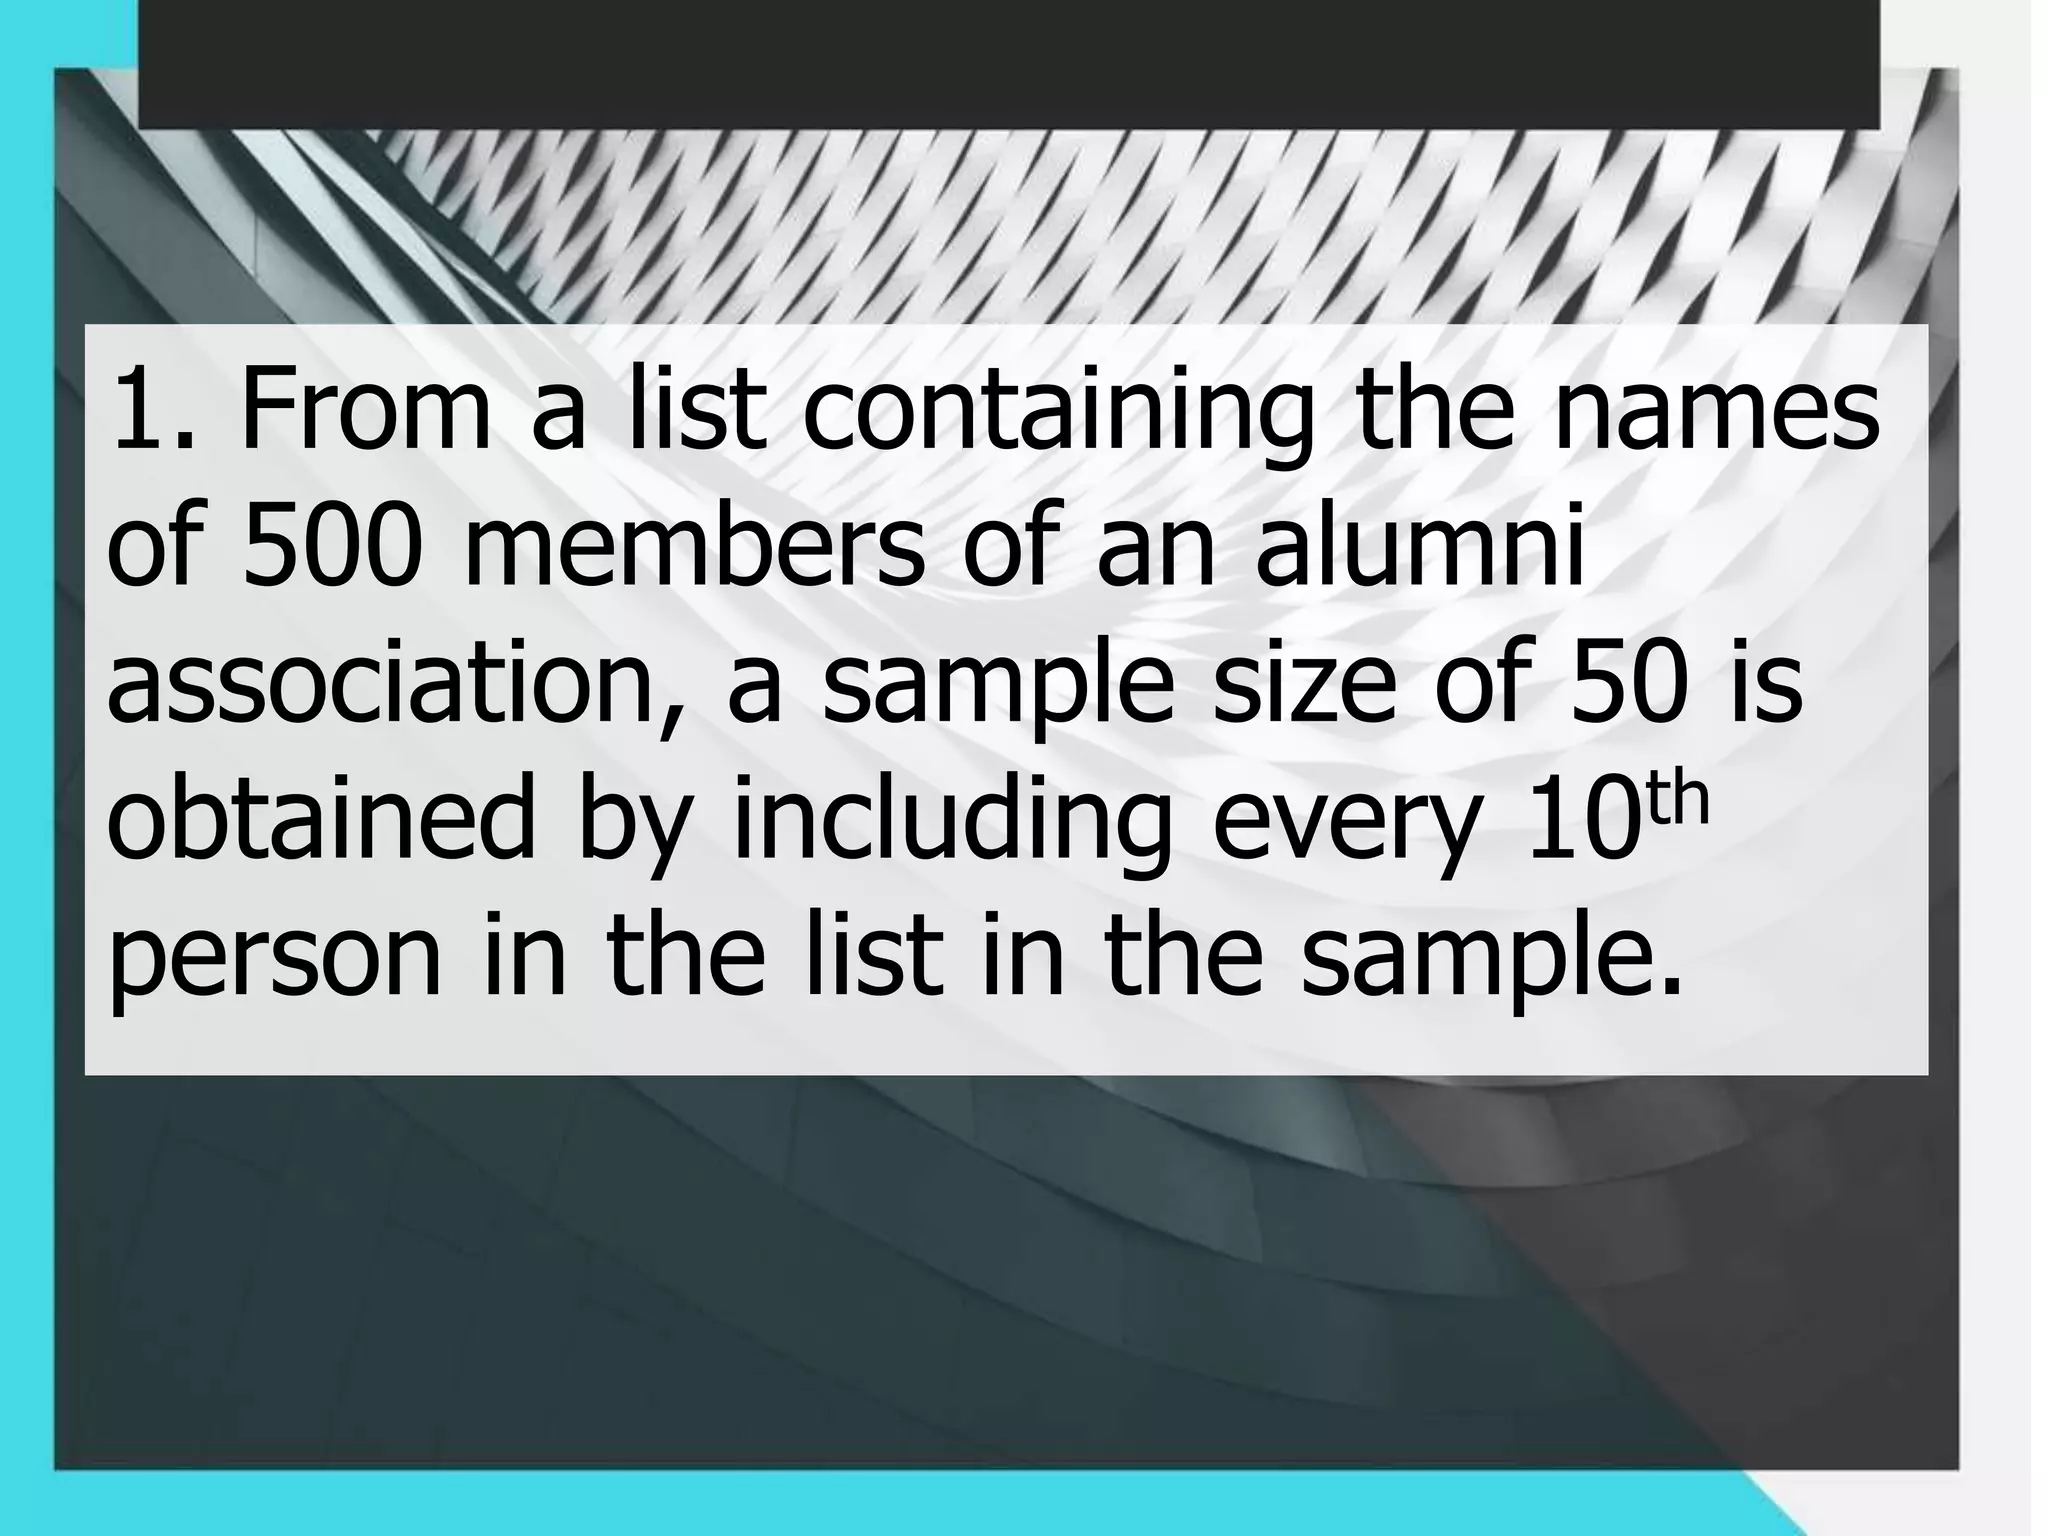
3. Exercises are provided to determine which sampling method should be used for different scenarios involving selecting samples from identified populations.


![Microsoft office excel_2010[1]](https://cdn.slidesharecdn.com/ss_thumbnails/microsoftofficeexcel20101-110514083700-phpapp01-thumbnail.jpg?width=640&height=640&fit=bounds)