![Shakehand with Life Promoting quality culture in every sphere of human life Page 9
www.shakehandwithlife.puzl.com
Interquartile Range and Quartile Deviation
We know about the median, which divide the whole data set into two equal parts, one part less than the
median and other half is greater than median.
In the same manner the quartiles ( divide the data into four parts. First part of the data is less
than , second part of the data lies between and the third part of the data is lies between
and fourth or the last part of the data is greater than is called lower quartile and is
called the upper quartile.
Formula for calculation of quartiles
[ ]
[ ]
[ ]
Second Quartile is also called the median because the second quartile or median divides the data into
two equal parts.
The Interquartile range and quartile deviation are another measure of dispersion which can be calculated
with help of quartiles and defined as below.
The difference between the upper quartile ( ) and lower quartile ( ) is called the
interquartile range. Symbolically,](https://image.slidesharecdn.com/measureofdispersionpart-i-130809020800-phpapp02/75/Measure-of-dispersion-part-I-Range-Quartile-Deviation-Interquartile-deviation-Mean-deviation-9-2048.jpg)
![Shakehand with Life Promoting quality culture in every sphere of human life Page 10
www.shakehandwithlife.puzl.com
The interquartile ranges covers dispersion of middle 50% of the items of the series.
Quartile deviation, also called Semi-interquartile Range is half of the difference between
the upper and lower quartile i.e. half of the interquartile range. Symbolically
Coefficient of quartile deviation (The relative measure of quartile deviation)
Calculation of Interquartile Range, Q.D., Coefficient of Q.D.
Individual Series
Example 4 Find interquartile range, quartile deviation and coefficient of quartile deviation from the
following data;
28, 18, 20, 24, 27, 30, 15
Solution: Arrange the data in ascending order;
15, 18, 20, 24, 27, 28, 30
[ ] [ ]
Discrete Series
Example 5 Calculate interquartile range, quartile deviation and the coefficient of quartile deviation from
the following data;
Earnings (₹) 10 20 30 40 50 60
No. of People 2 8 20 35 42 20
Solution : Calculation of Q.D.](https://image.slidesharecdn.com/measureofdispersionpart-i-130809020800-phpapp02/75/Measure-of-dispersion-part-I-Range-Quartile-Deviation-Interquartile-deviation-Mean-deviation-10-2048.jpg)

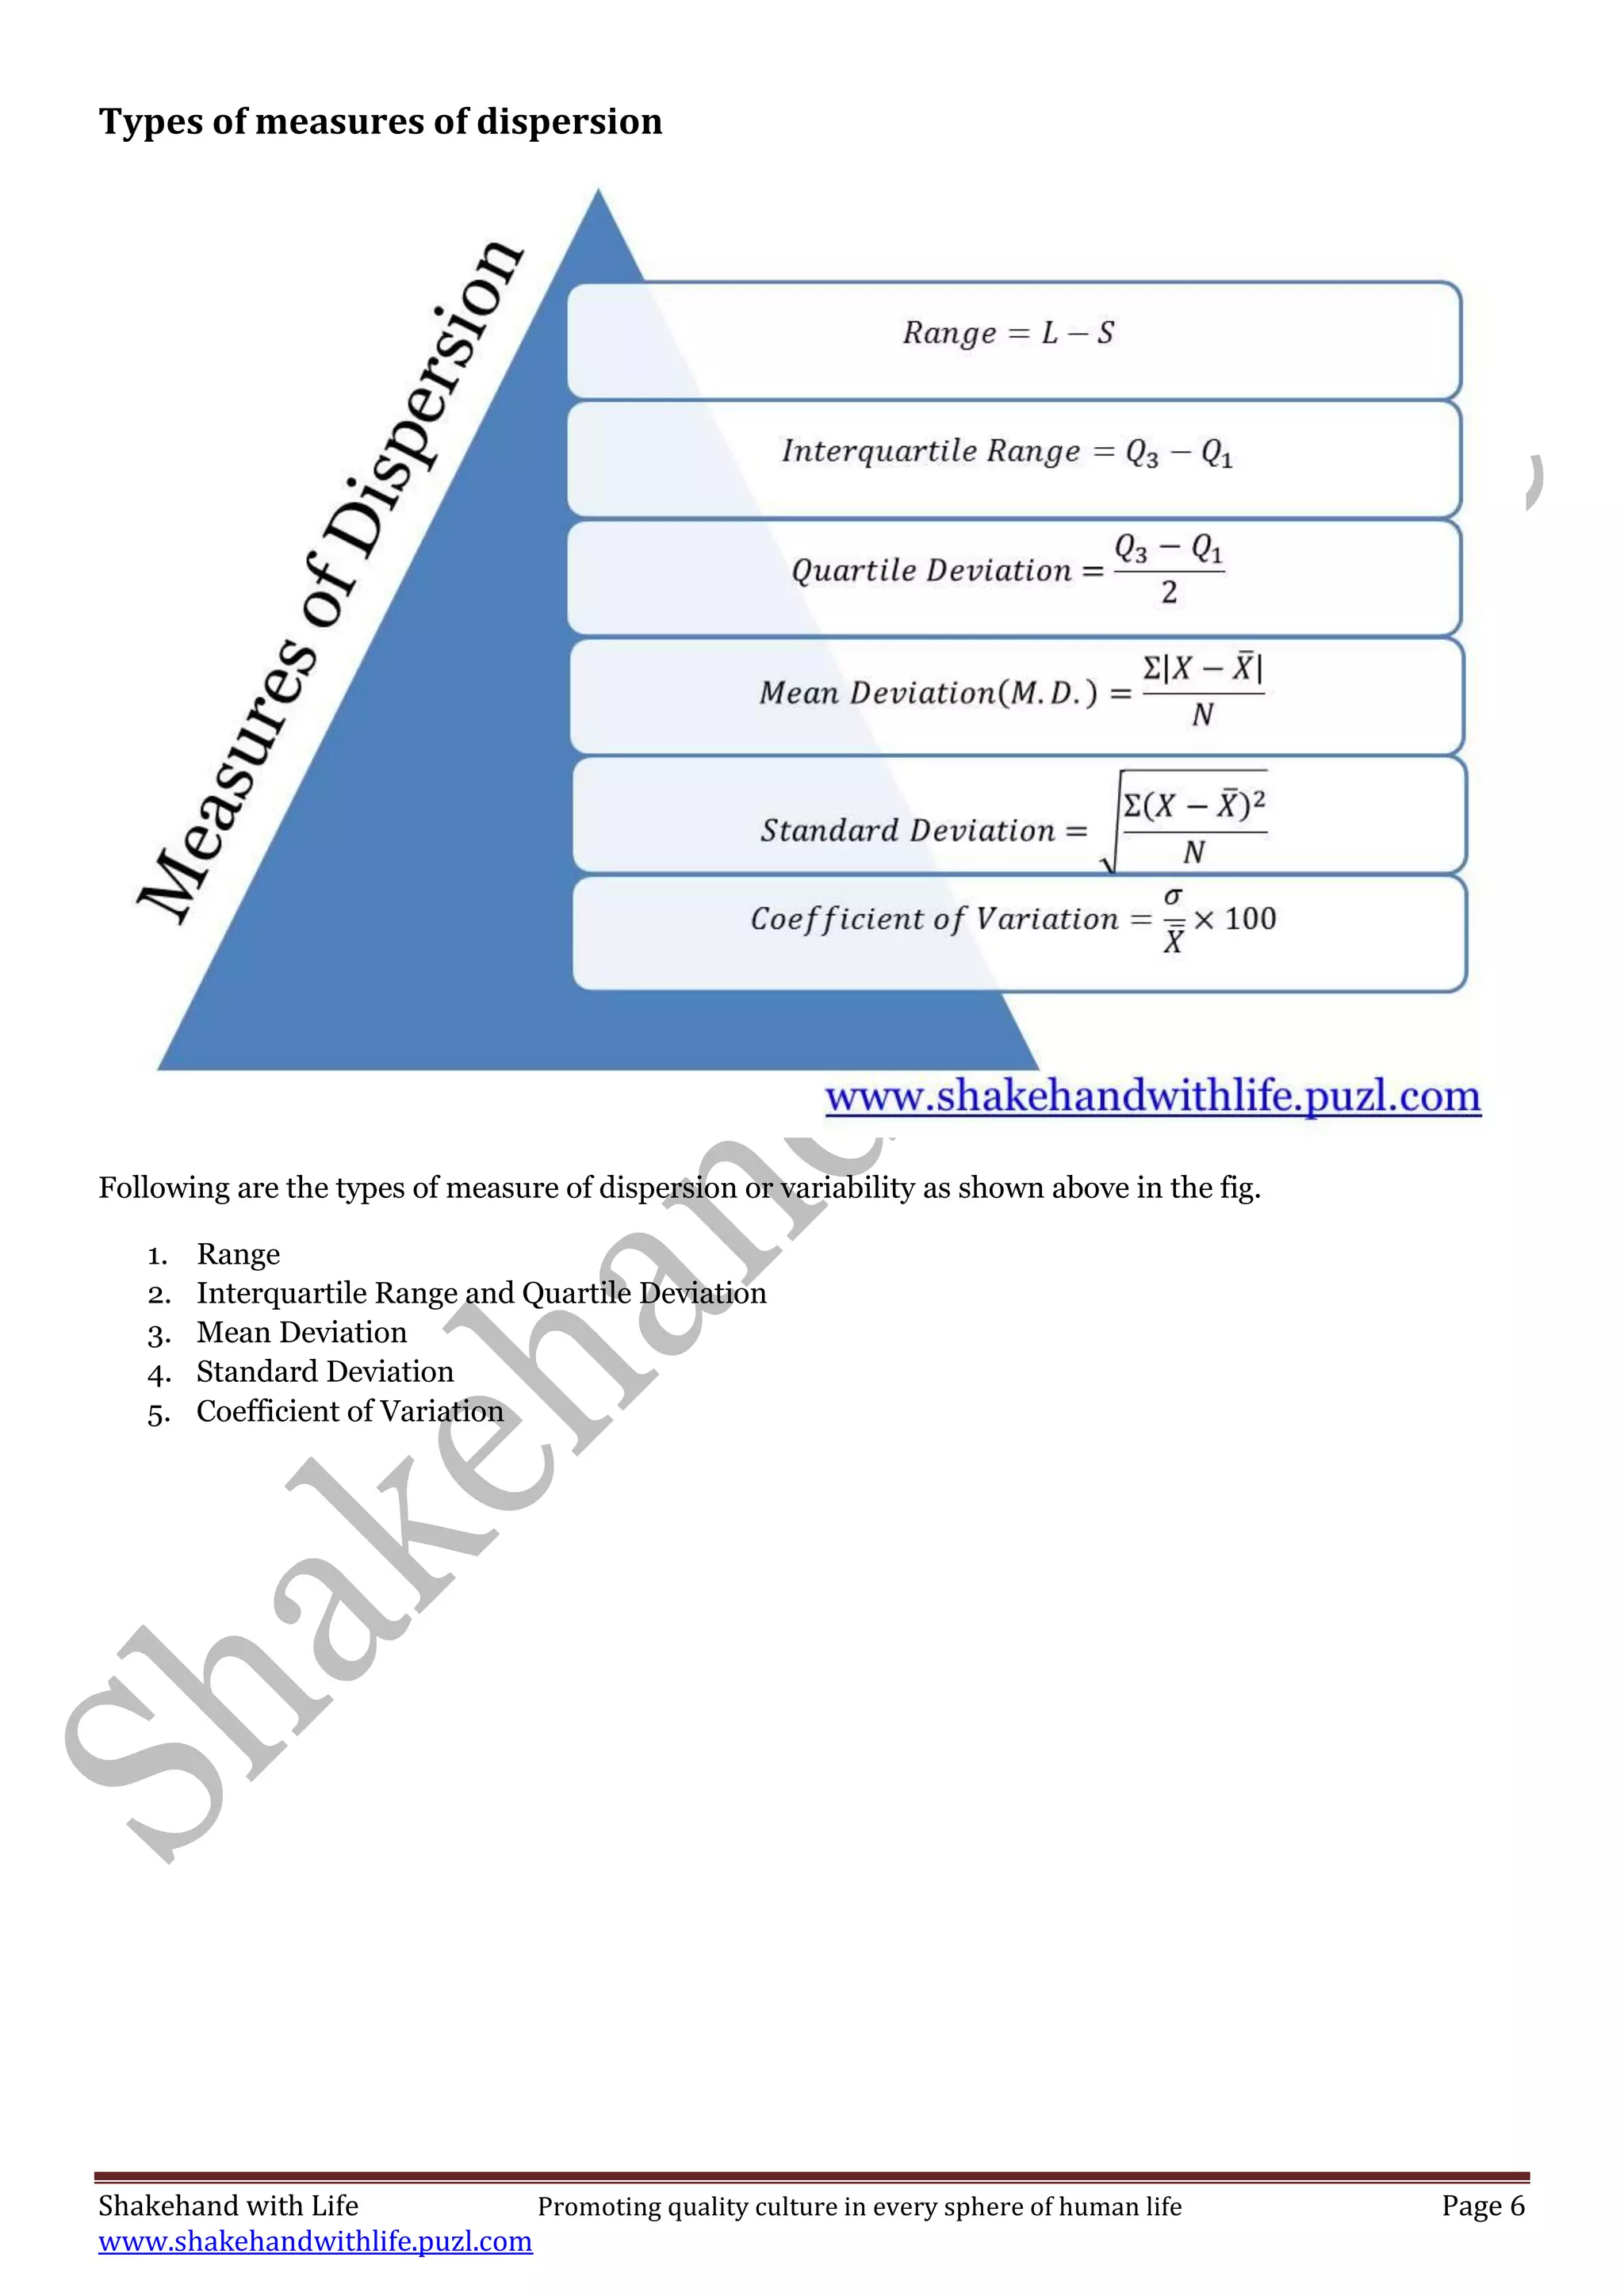
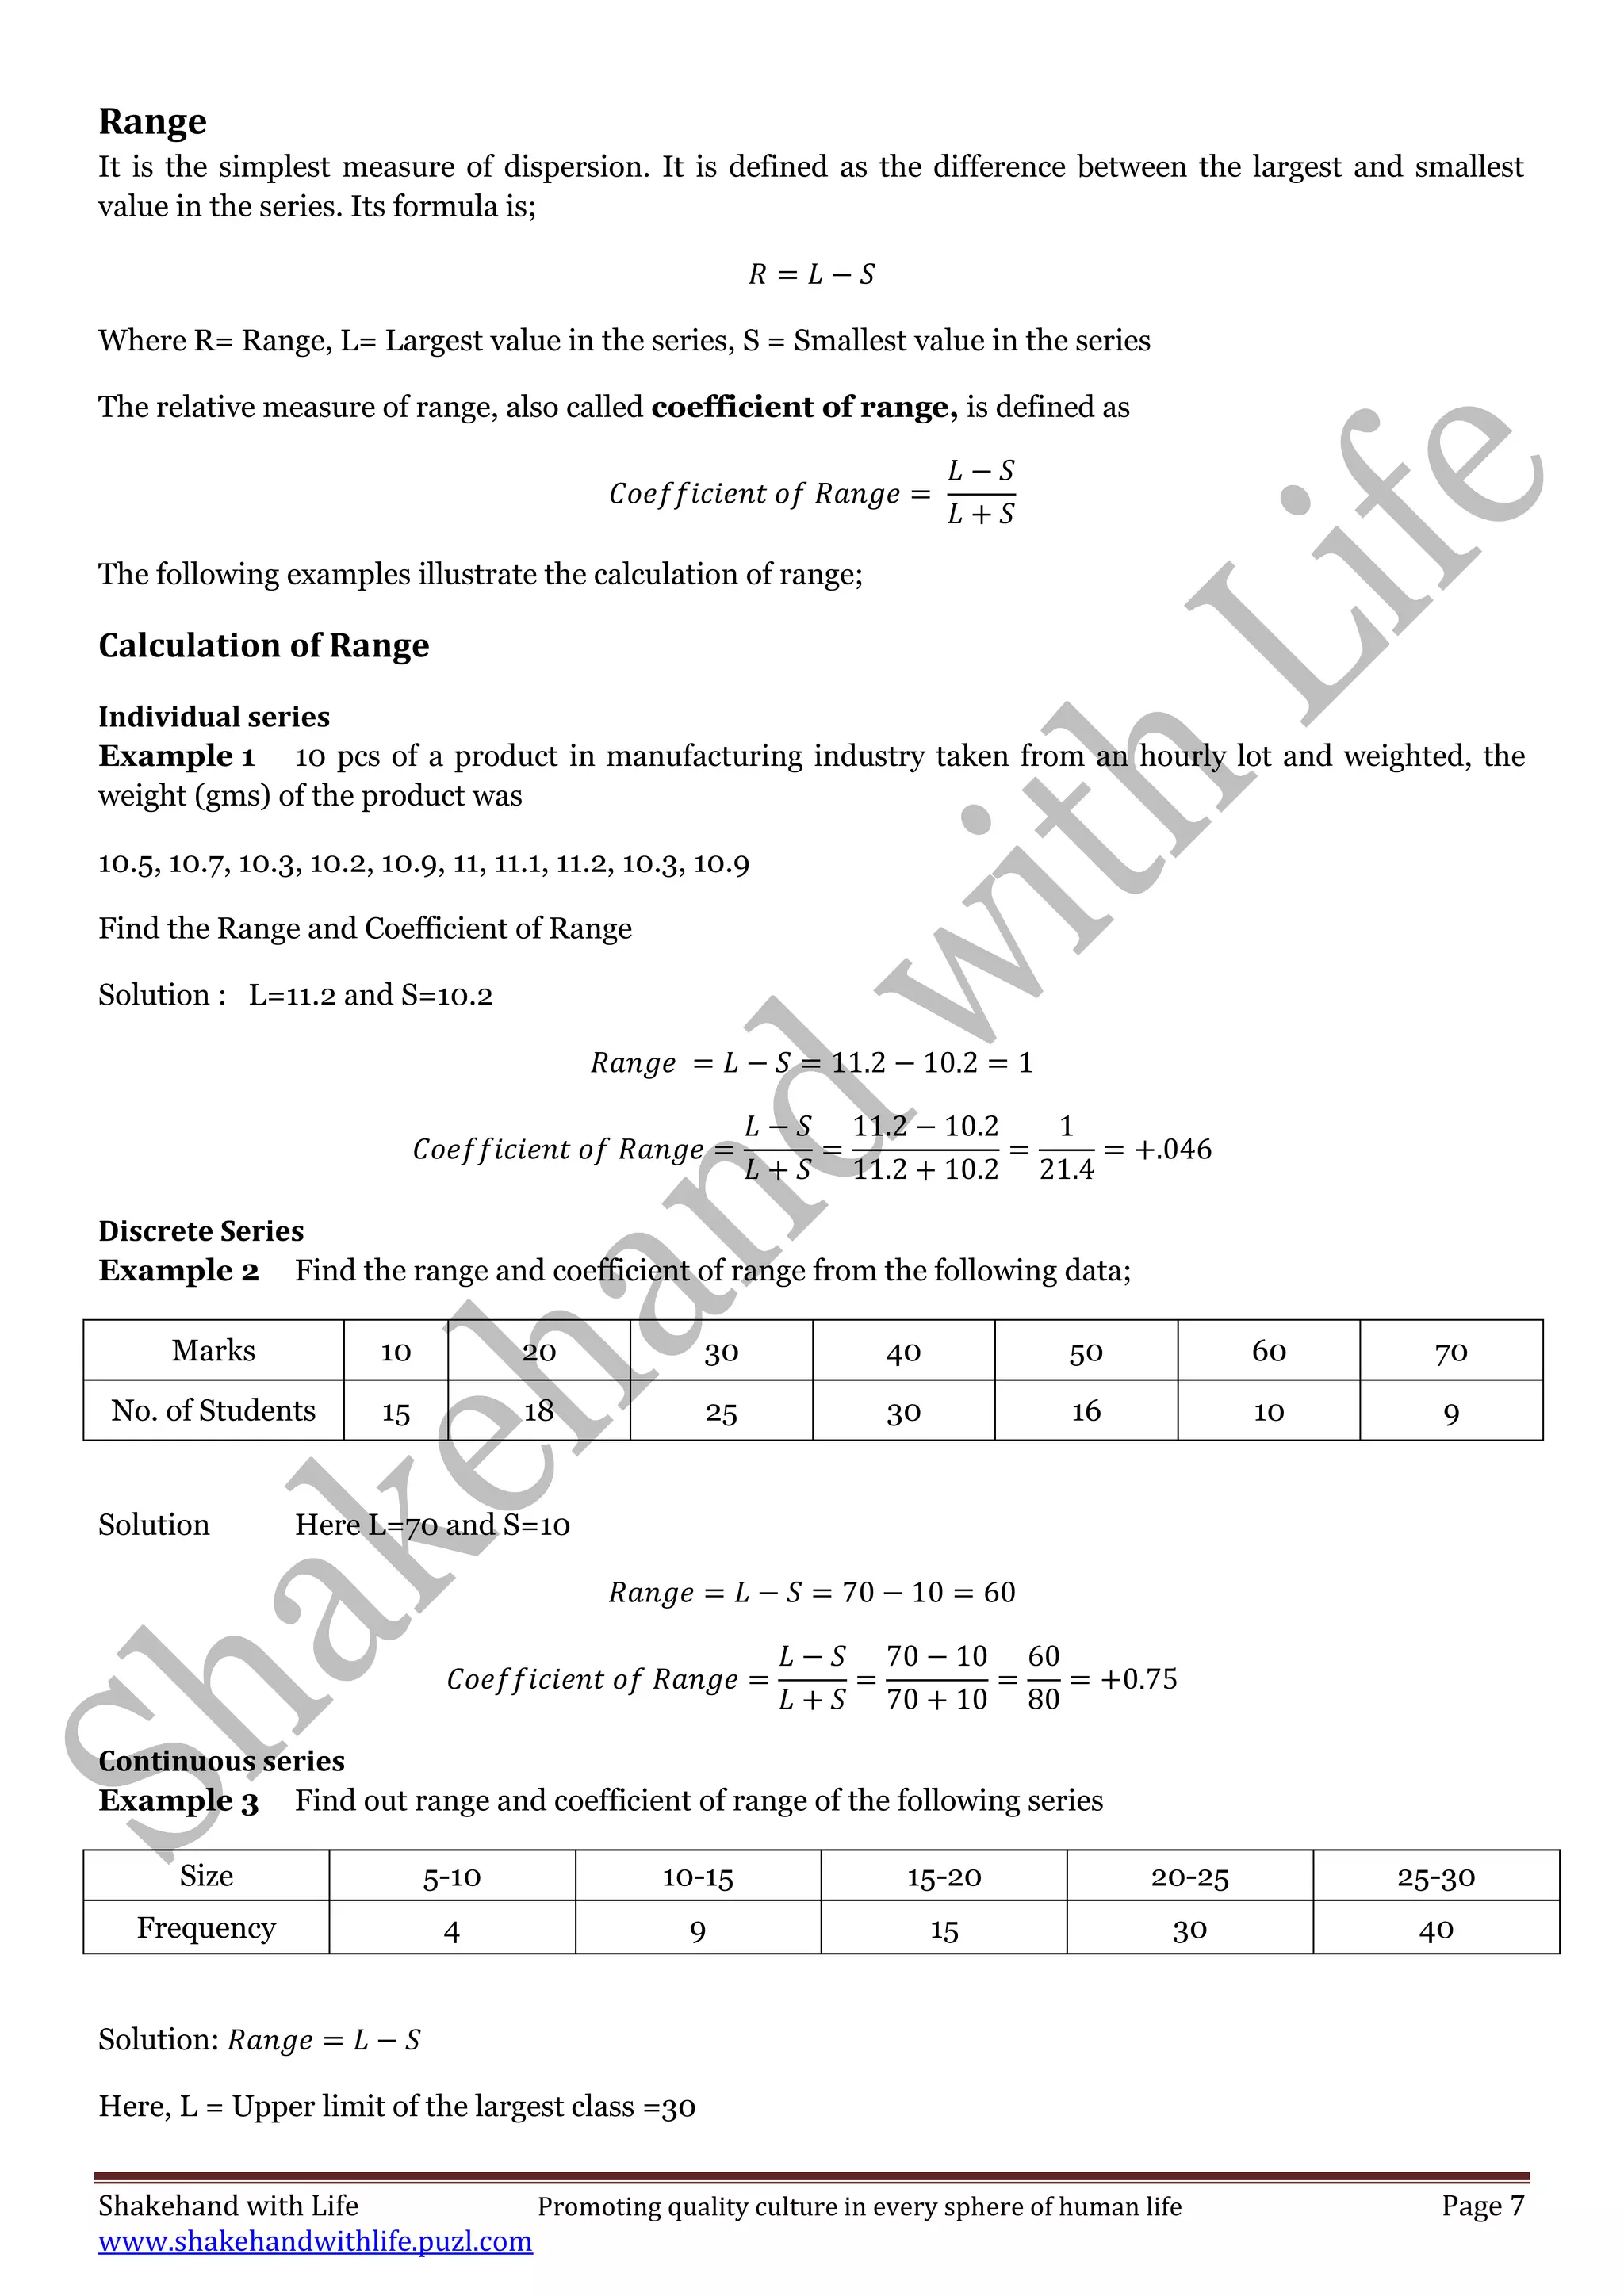
The document details methods of measuring variability or dispersion in data, including absolute and relative measures, and various specific types such as range, interquartile range, and mean deviation. It highlights the importance of these measures in evaluating the reliability of averages and consistency in data sets. Additionally, the document includes examples and calculations for these measures and their application in statistical quality control.


