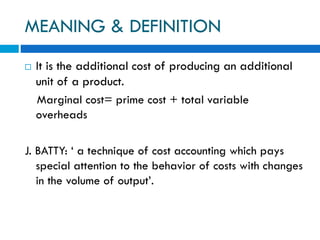
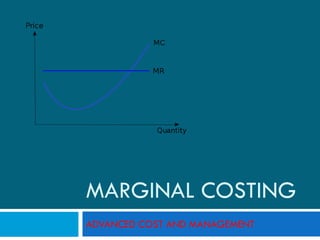
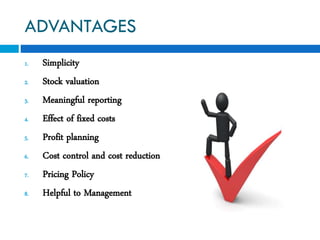
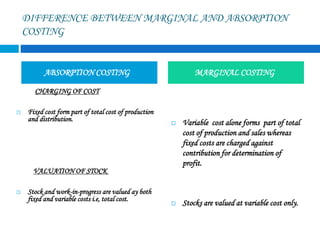
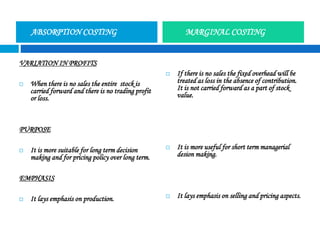
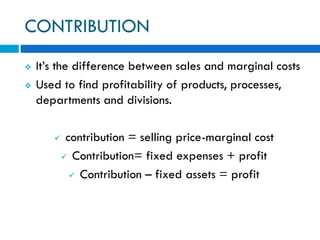
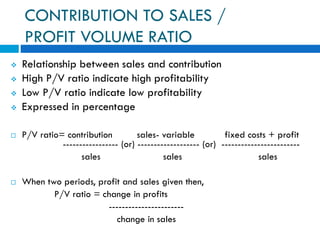
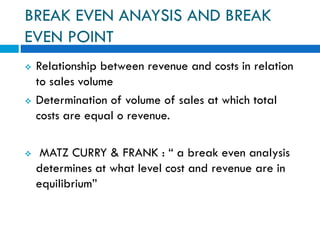
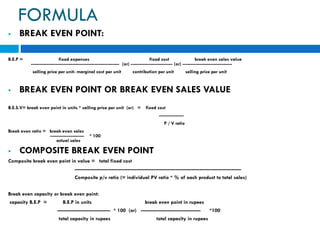
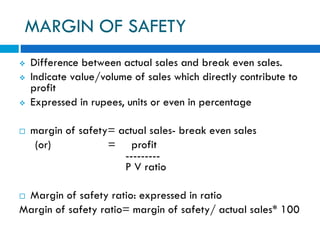
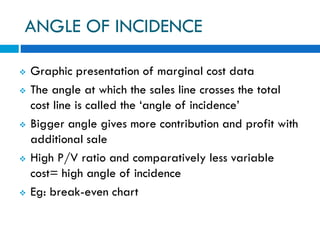
This document provides an overview of marginal costing and cost-volume-profit (CVP) analysis. It defines key terms like marginal cost, contribution, fixed and variable costs. It explains the differences between marginal and absorption costing approaches. The objectives and concepts of CVP analysis are outlined, including break-even point, margin of safety, contribution ratio and angle of incidence. Formulas for calculating items like break-even sales, break-even point and composite break-even point are presented. Advantages and limitations of marginal costing are listed.
Marginal costing is a costing technique wherein the marginal cost, i.e. variable cost is charged to units of cost, while the fixed cost for the period is completely written off against the contribution.
Responsibility accounting is a system of dividing an organization into similar units, each of which is to be assigned particular responsibilities. These units may be in the form of divisions, segments, departments, branches, product lines and so on. Each department is comprised of individuals who are responsible for particular tasks or managerial functions. The managers of various departments should ensure that the people in their department are doing well to achieve the goal. Responsibility accounting refers to the various concepts and tools used by managerial accountants to measure the performance of people and departments in order to ensure that the achievement of the goals set by the top management.
Responsibility accounting, therefore, represents a method of measuring the performances of various divisions of an organization. The test to identify the division is that the operating performance is separately identifiable and measurable in some way that is of practical significance to the management. Responsibility accounting collects and reports planned and actual accounting information about the inputs and outputs of responsibility centers.
A power point presentation describing some basic definitions, father of cost accounting, Indian aspect of cost accounting and Various Methods and Techniques of costing.
Presented by: Aquib Ali, Ajay Gupta and Ashwin Showi. (M.Com students)
at the Bhopal School of Social Sciences(BSSS) on 6 September, 2017
Management Accounting - Meaning, Definition, Characteristics, Scope, Objectiv...RajaKrishnan M
Meaning Definition Characteristics Scope Objectives and Function Financial accounting and Management accounting - Management accounting and Cost accounting - Cost accounting and Management accounting and Financial accounting - Tools and Technics- Advantages and limitations
Under this technique all costs are classified into fixed costs and variable costs. Only variable costs are considered product costs and are allocated to products manufactured. These costs include direct materials, direct labor, direct expenses and variable overhead. Fixed costs are not considered for computing the cost of products or valuation of inventory.
This power point presentation related to process costing. which is useful to students who studying B.com, BBA,M.COM MBA etc.
It involves short notes on definition of process costing,its features,applications,difference between process costing and job costing, advantages and disadvantageous of process costing, procedure of process costing,format of process account, process losses and abnormal gain.
This ppt covers the following points :-
1. introduction of management accounting
2. Definition of management accounting
3. Nature, objective, tools and techniques, significance and limitations of management accounting
4. difference between financial and management accounting and also includes difference between cost and management accounting
5. management accountant and its roles
6. Management accounting organisation
Imprint and the BCC Present: Social Media Makeover with Julio ViskovichAlexandra Lam
A social media workshop presented by the Sauder BCC and Imprint conference, with guest speaker Julio Viskovich from HootSuite. Includes pro-tips and best practices on maximizing LinkedIn and Twitter to build your personal brand. Workshop occurred on Oct. 17, 2013 at the University of British Columbia's Sauder School of Business. The second in a pre-conference workshop series on personal branding for the Imprint conference, UBC's premiere conference on personal and corporate branding.
1. MEANING & DEFINITION
It is the additional cost of producing an additional
unit of a product.
Marginal cost= prime cost + total variable
overheads
J. BATTY: ‘ a technique of cost accounting which pays
special attention to the behavior of costs with changes
in the volume of output’.
6. DIFFERENCE BETWEEN MARGINAL AND ABSORPTION
COSTING
CHARGING OF COST
Fixed cost form part of total cost of production
and distribution.
VALUATION OF STOCK
Stock and work-in-progress are valued ay both
fixed and variable costs i.e, total cost.
Variable cost alone forms part of total
cost of production and sales whereas
fixed costs are charged against
contribution for determination of
profit.
Stocks are valued at variable cost only.
ABSORPTION COSTING MARGINAL COSTING
7. VARIATION IN PROFITS
When there is no sales the entire stock is
carried forward and there is no trading profit
or loss.
PURPOSE
It is more suitable for long term decision
making and for pricing policy over long term.
EMPHASIS
It lays emphasis on production.
If there is no sales the fixed overhead will be
treated as loss in the absence of contribution.
It is not carried forward as a part of stock
value.
It is more useful for short term managerial
desion making.
It lays emphasis on selling and pricing aspects.
ABSORPTION COSTING MARGINAL COSTING
8. COST-VOLUME-PROFIT ANALYSIS
Cost-Volume-Profit analysis is the analysis of three
variables, i.e. cost, volume and profit.
Cost-Volume-Profit analysis helps the management in
profit planning.
Profit of a concern can be increased by increasing the
output and sales or reducing cost.
“The most significant single factor in planning of the
average business is the relationship between the volume
of business, its costs and profit.”
-HEISER
9. OBJECTIVES
Cost-Volume-Profit analysis is made with the objective
of ascertaining the following:
The cost for various levels of production
The desirable volume of production
The profit at various levels of production
The difference between sales revenue and variable
cost.
10. CONCEPTS AND TERMS
1. FIXED COST
2. VARIABLE COST
3. CONTRIBUTION
4. CONTRIBUTION TO SALES/ PRROFIT VOLUME
RATIO
5. BREAK EVEN ANALYSIS
6. MARGIN OF SAFETY
7. ANGLE OF INCIDENCE
8. BREAK EVEN CHARTS
11. FIXED COST
Total of cost like “period cost” or “time costs”
Does not depend on volume of production and sales
Fixed costs remain constant
Fixed cost are fixed in total but variable in unit.
Eg: salary rent, manager’s salary etc known as
fixed overheads
12. VARIABLE COST
Increase or decrease in proportion to sales and
output.
Called as ‘product costs’ or ‘marginal costs’
Vary in direct proportion to output.
Variable costs vary in total but they remain constant
per unit.
Eg: direct material, direct wages etc
13. CONTRIBUTION
It’s the difference between sales and marginal costs
Used to find profitability of products, processes,
departments and divisions.
contribution = selling price-marginal cost
Contribution= fixed expenses + profit
Contribution – fixed assets = profit
14. CONTRIBUTION TO SALES /
PROFIT VOLUME RATIO
Relationship between sales and contribution
High P/V ratio indicate high profitability
Low P/V ratio indicate low profitability
Expressed in percentage
P/V ratio= contribution sales- variable fixed costs + profit
----------------- (or) ------------------- (or) ------------------------
sales sales sales
When two periods, profit and sales given then,
P/V ratio = change in profits
-----------------------
change in sales
15. BREAK EVEN ANAYSIS AND BREAK
EVEN POINT
Relationship between revenue and costs in relation
to sales volume
Determination of volume of sales at which total
costs are equal o revenue.
MATZ CURRY & FRANK : “ a break even analysis
determines at what level cost and revenue are in
equilibrium”
16. FORMULA
BREAK EVEN POINT:
B.E.P = fixed expenses fixed cost break even sales value
--------------------------------------------------------- (or) --------------------------- (or) --------------------------------
selling price per unit- marginal cost per unit contribution per unit selling price per unit
BREAK EVEN POINT OR BREAK EVEN SALES VALUE
B.E.S.V= break even point in units * salling price per unit (or) = fixed cost
----------------
P / V ratio
Break even ratio = break even sales
---------------------- * 100
actual sales
COMPOSITE BREAK EVEN POINT
Composite break even point in value = total fixed cost
----------------------------------------------------------------------------------------------------
Composite p/v ratio (= individual PV ratio * % of each product to total sales)
Break even capacity or break even point:
capacity B.E.P = B.E.P in units break even point in rupees
-------------------------------- * 100 (or) ------------------------------------ *100
total capacity in rupees total capacity in rupees
17. MARGIN OF SAFETY
Difference between actual sales and break even sales.
Indicate value/volume of sales which directly contribute to
profit
Expressed in rupees, units or even in percentage
margin of safety= actual sales- break even sales
(or) = profit
---------
P V ratio
Margin of safety ratio: expressed in ratio
Margin of safety ratio= margin of safety/ actual sales* 100
18. ANGLE OF INCIDENCE
Graphic presentation of marginal cost data
The angle at which the sales line crosses the total
cost line is called the ‘angle of incidence’
Bigger angle gives more contribution and profit with
additional sale
High P/V ratio and comparatively less variable
cost= high angle of incidence
Eg: break-even chart
19. BREAK EVEN CHARTS
Graphical representation of marginal costing
Show inter-relation between cost, volume & profit