Downloaded 152 times
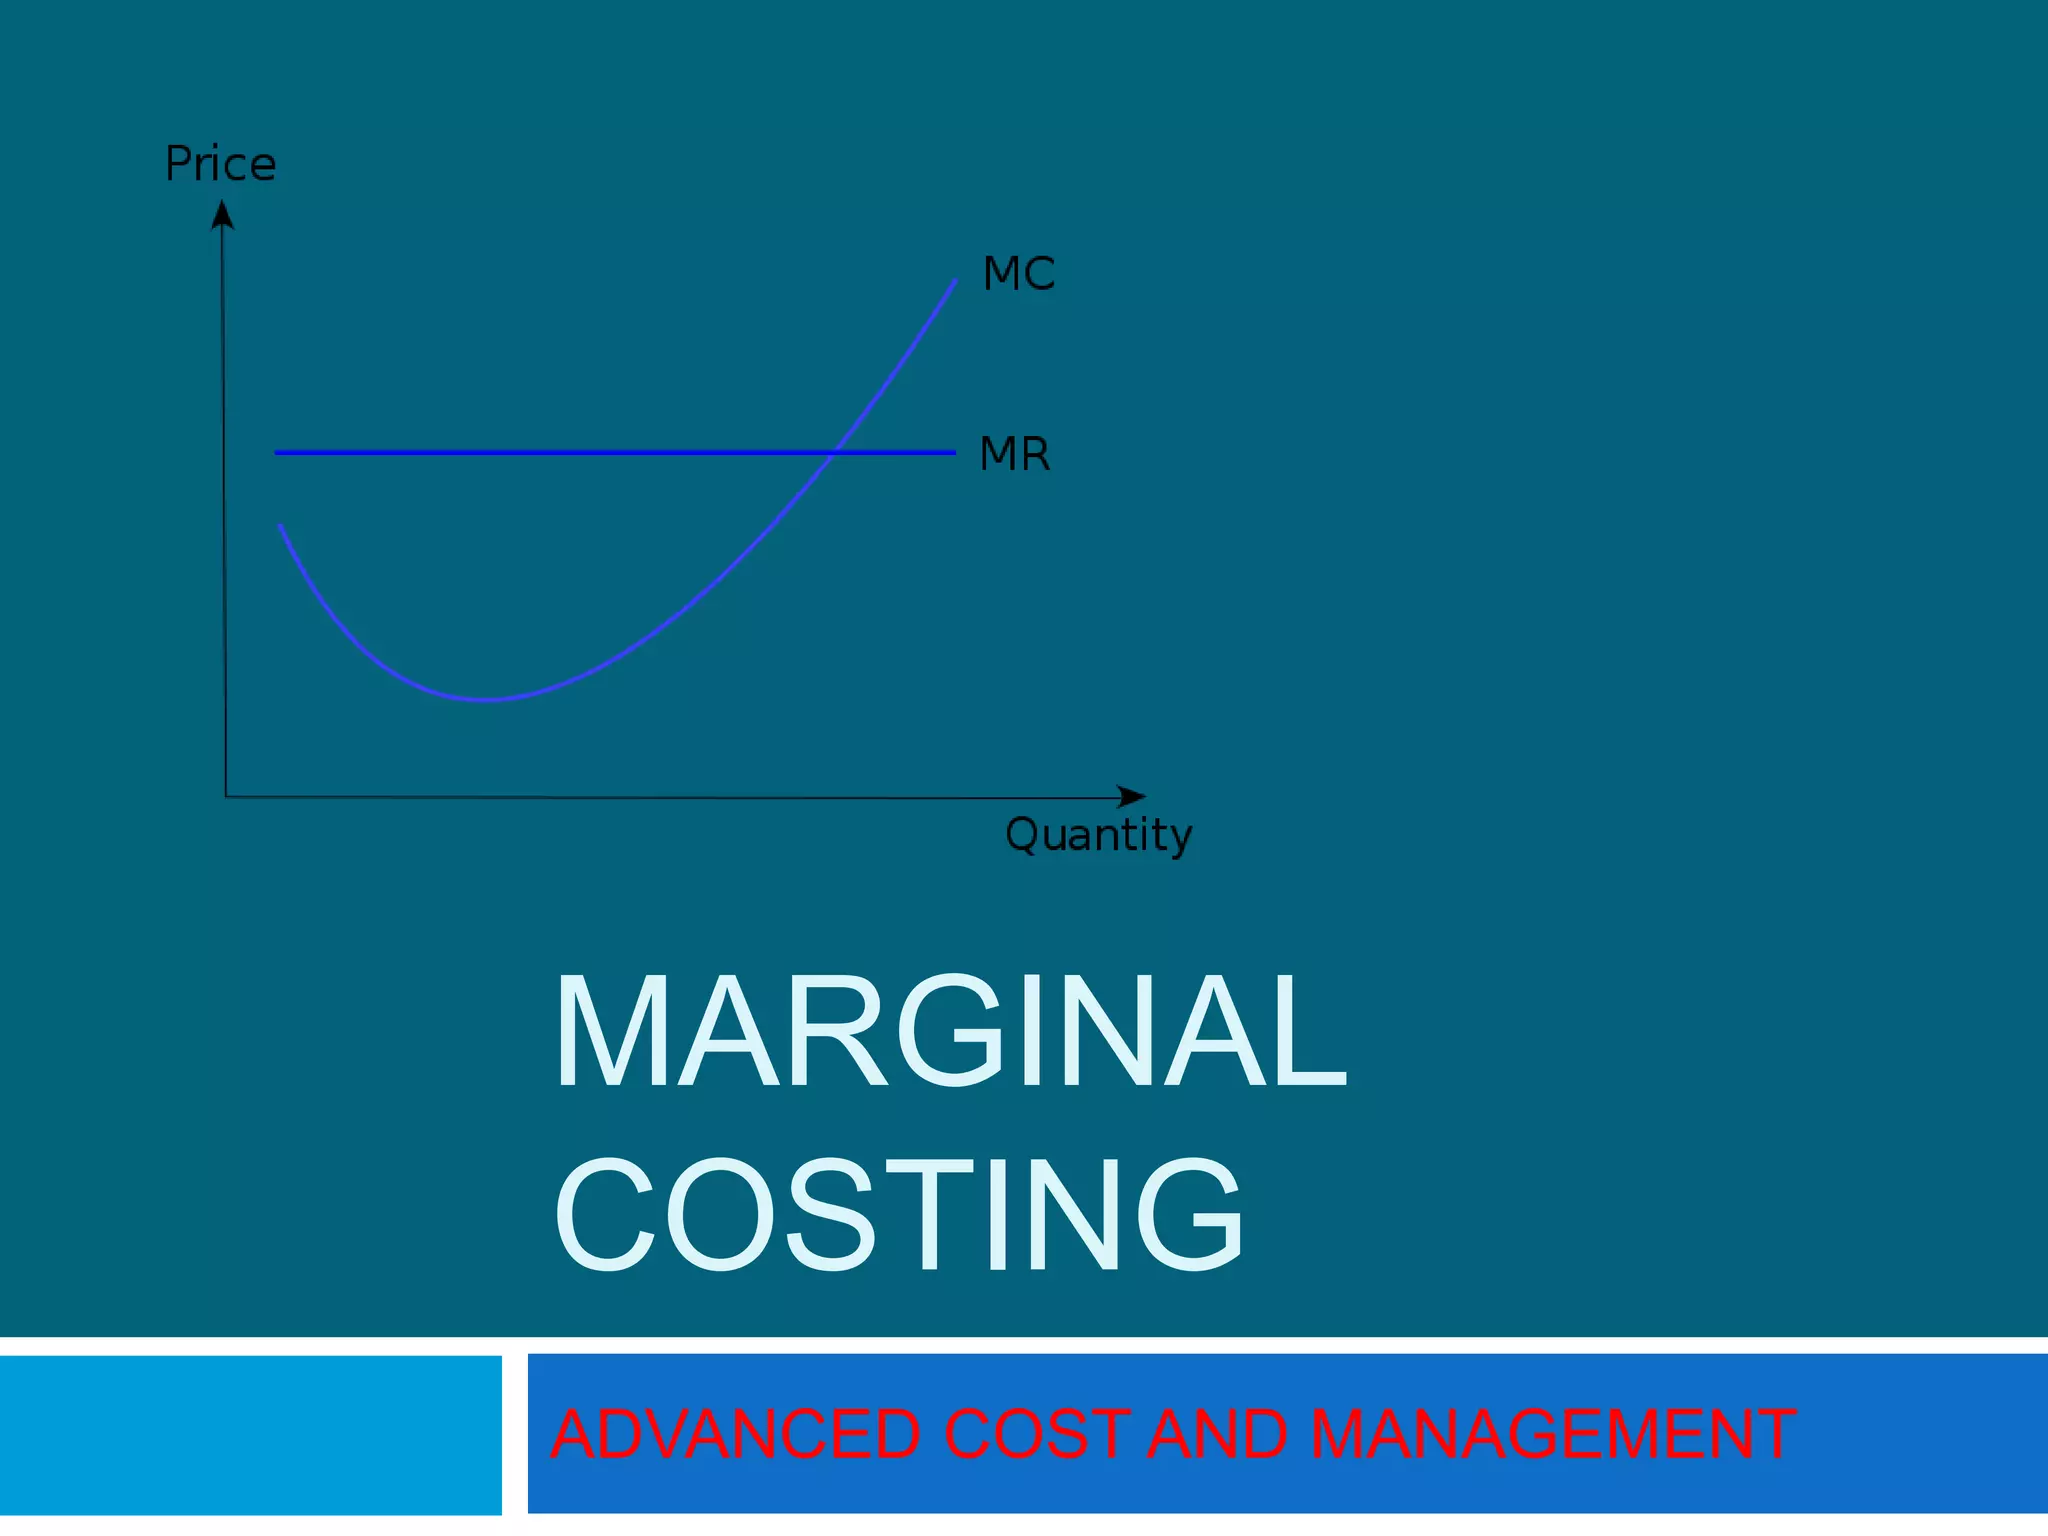
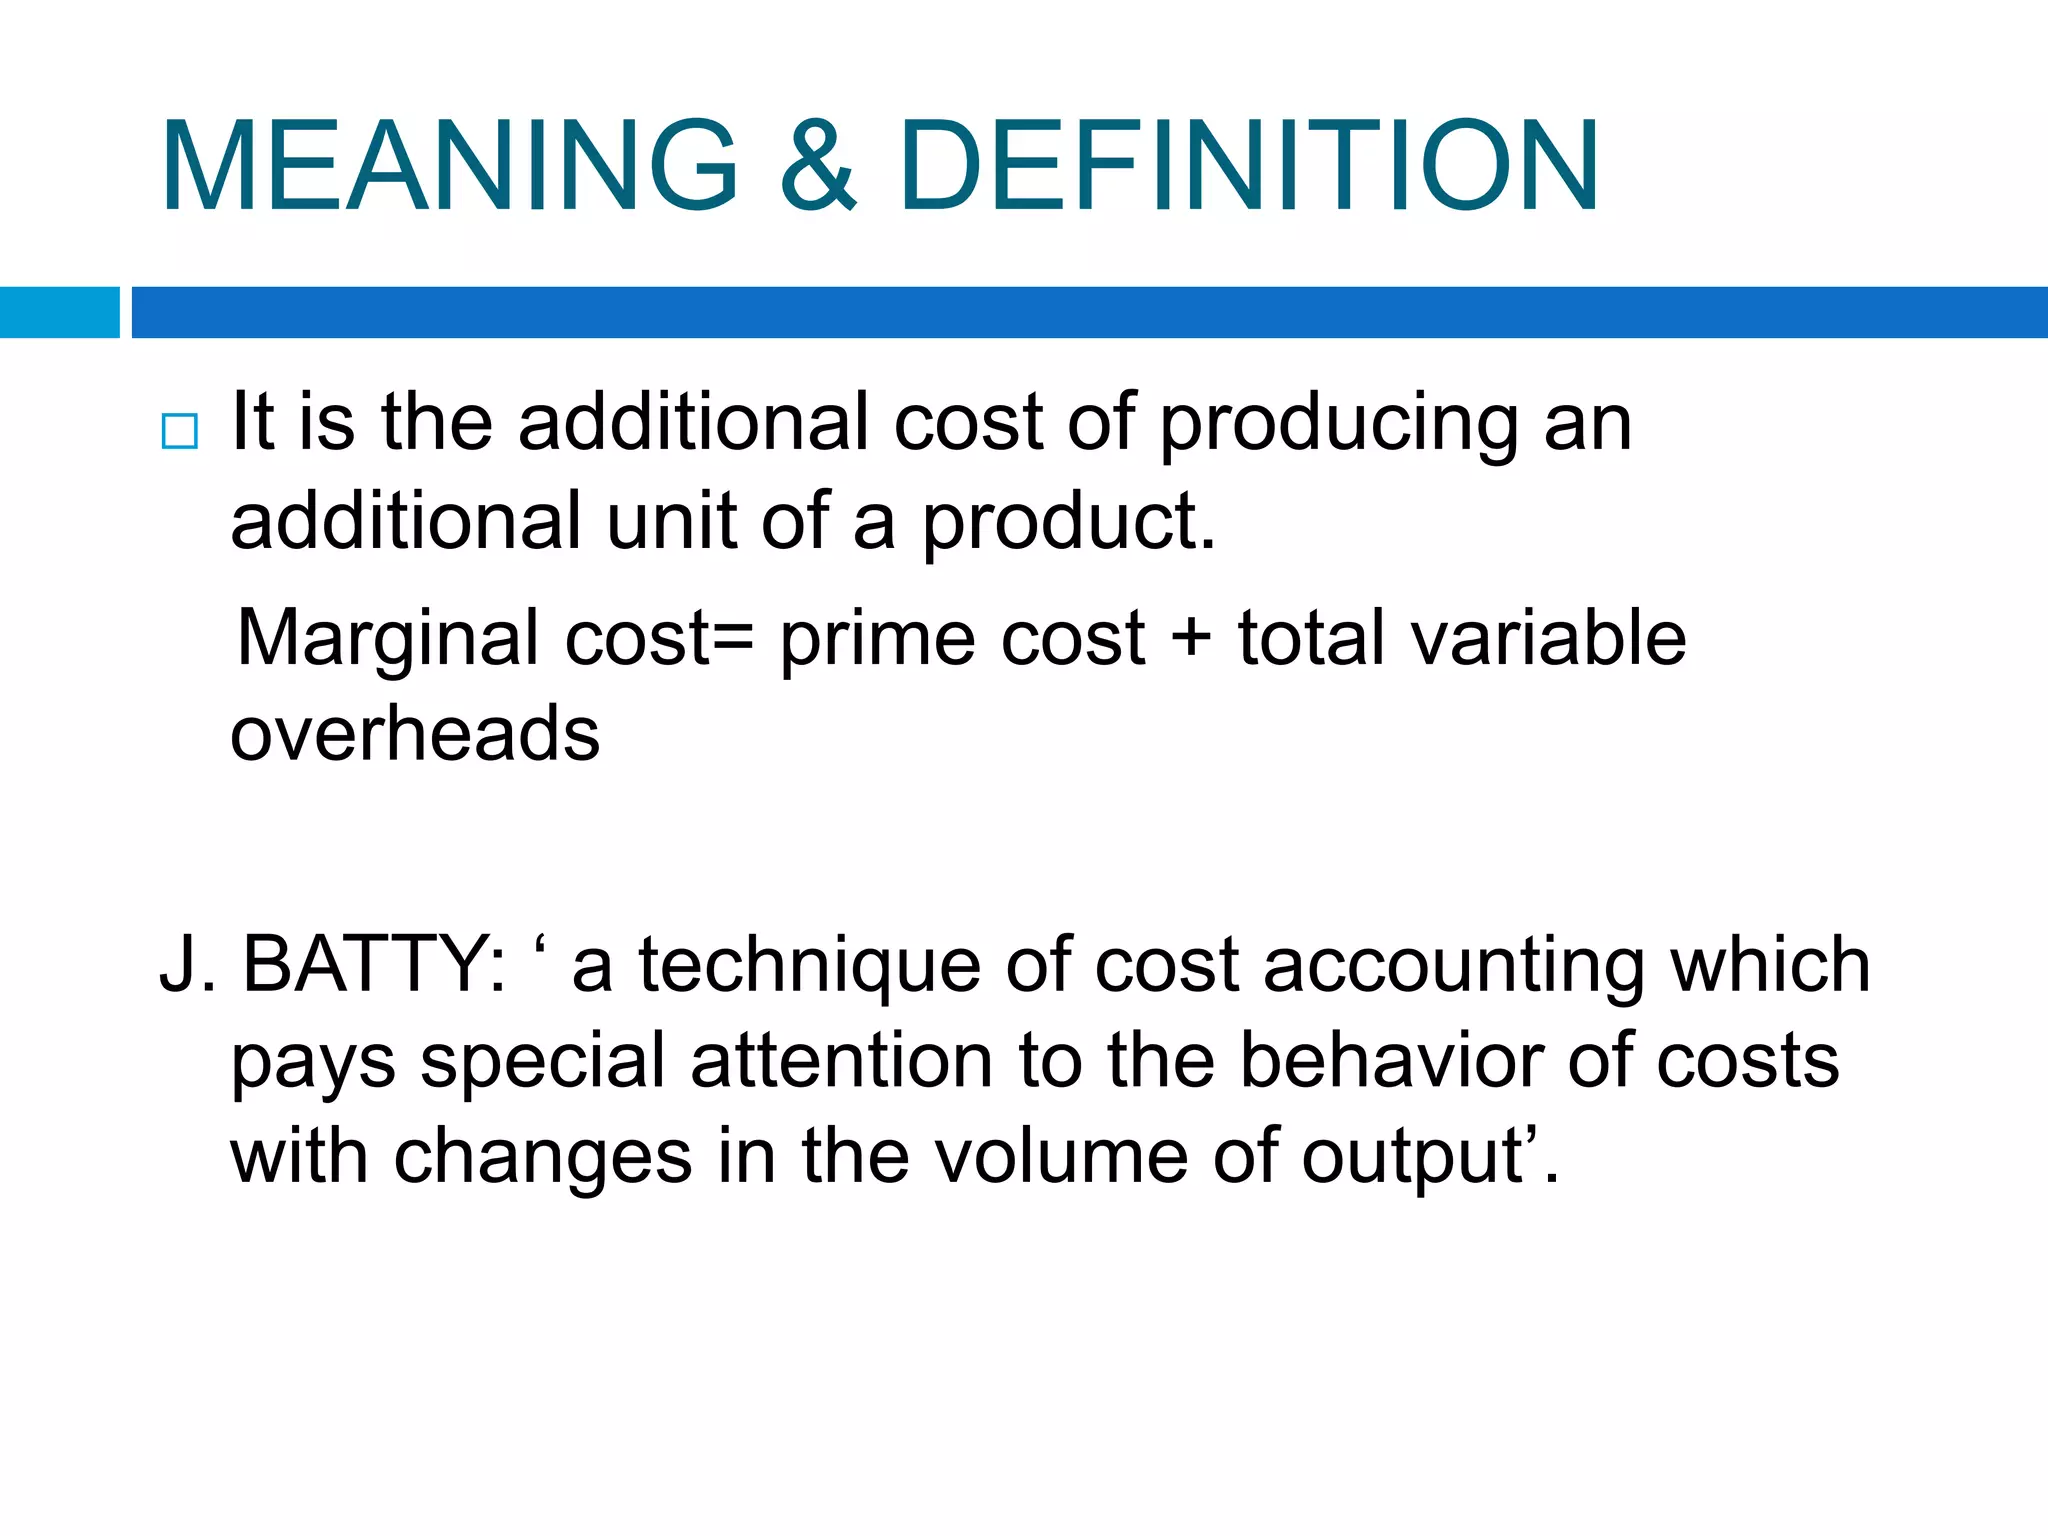
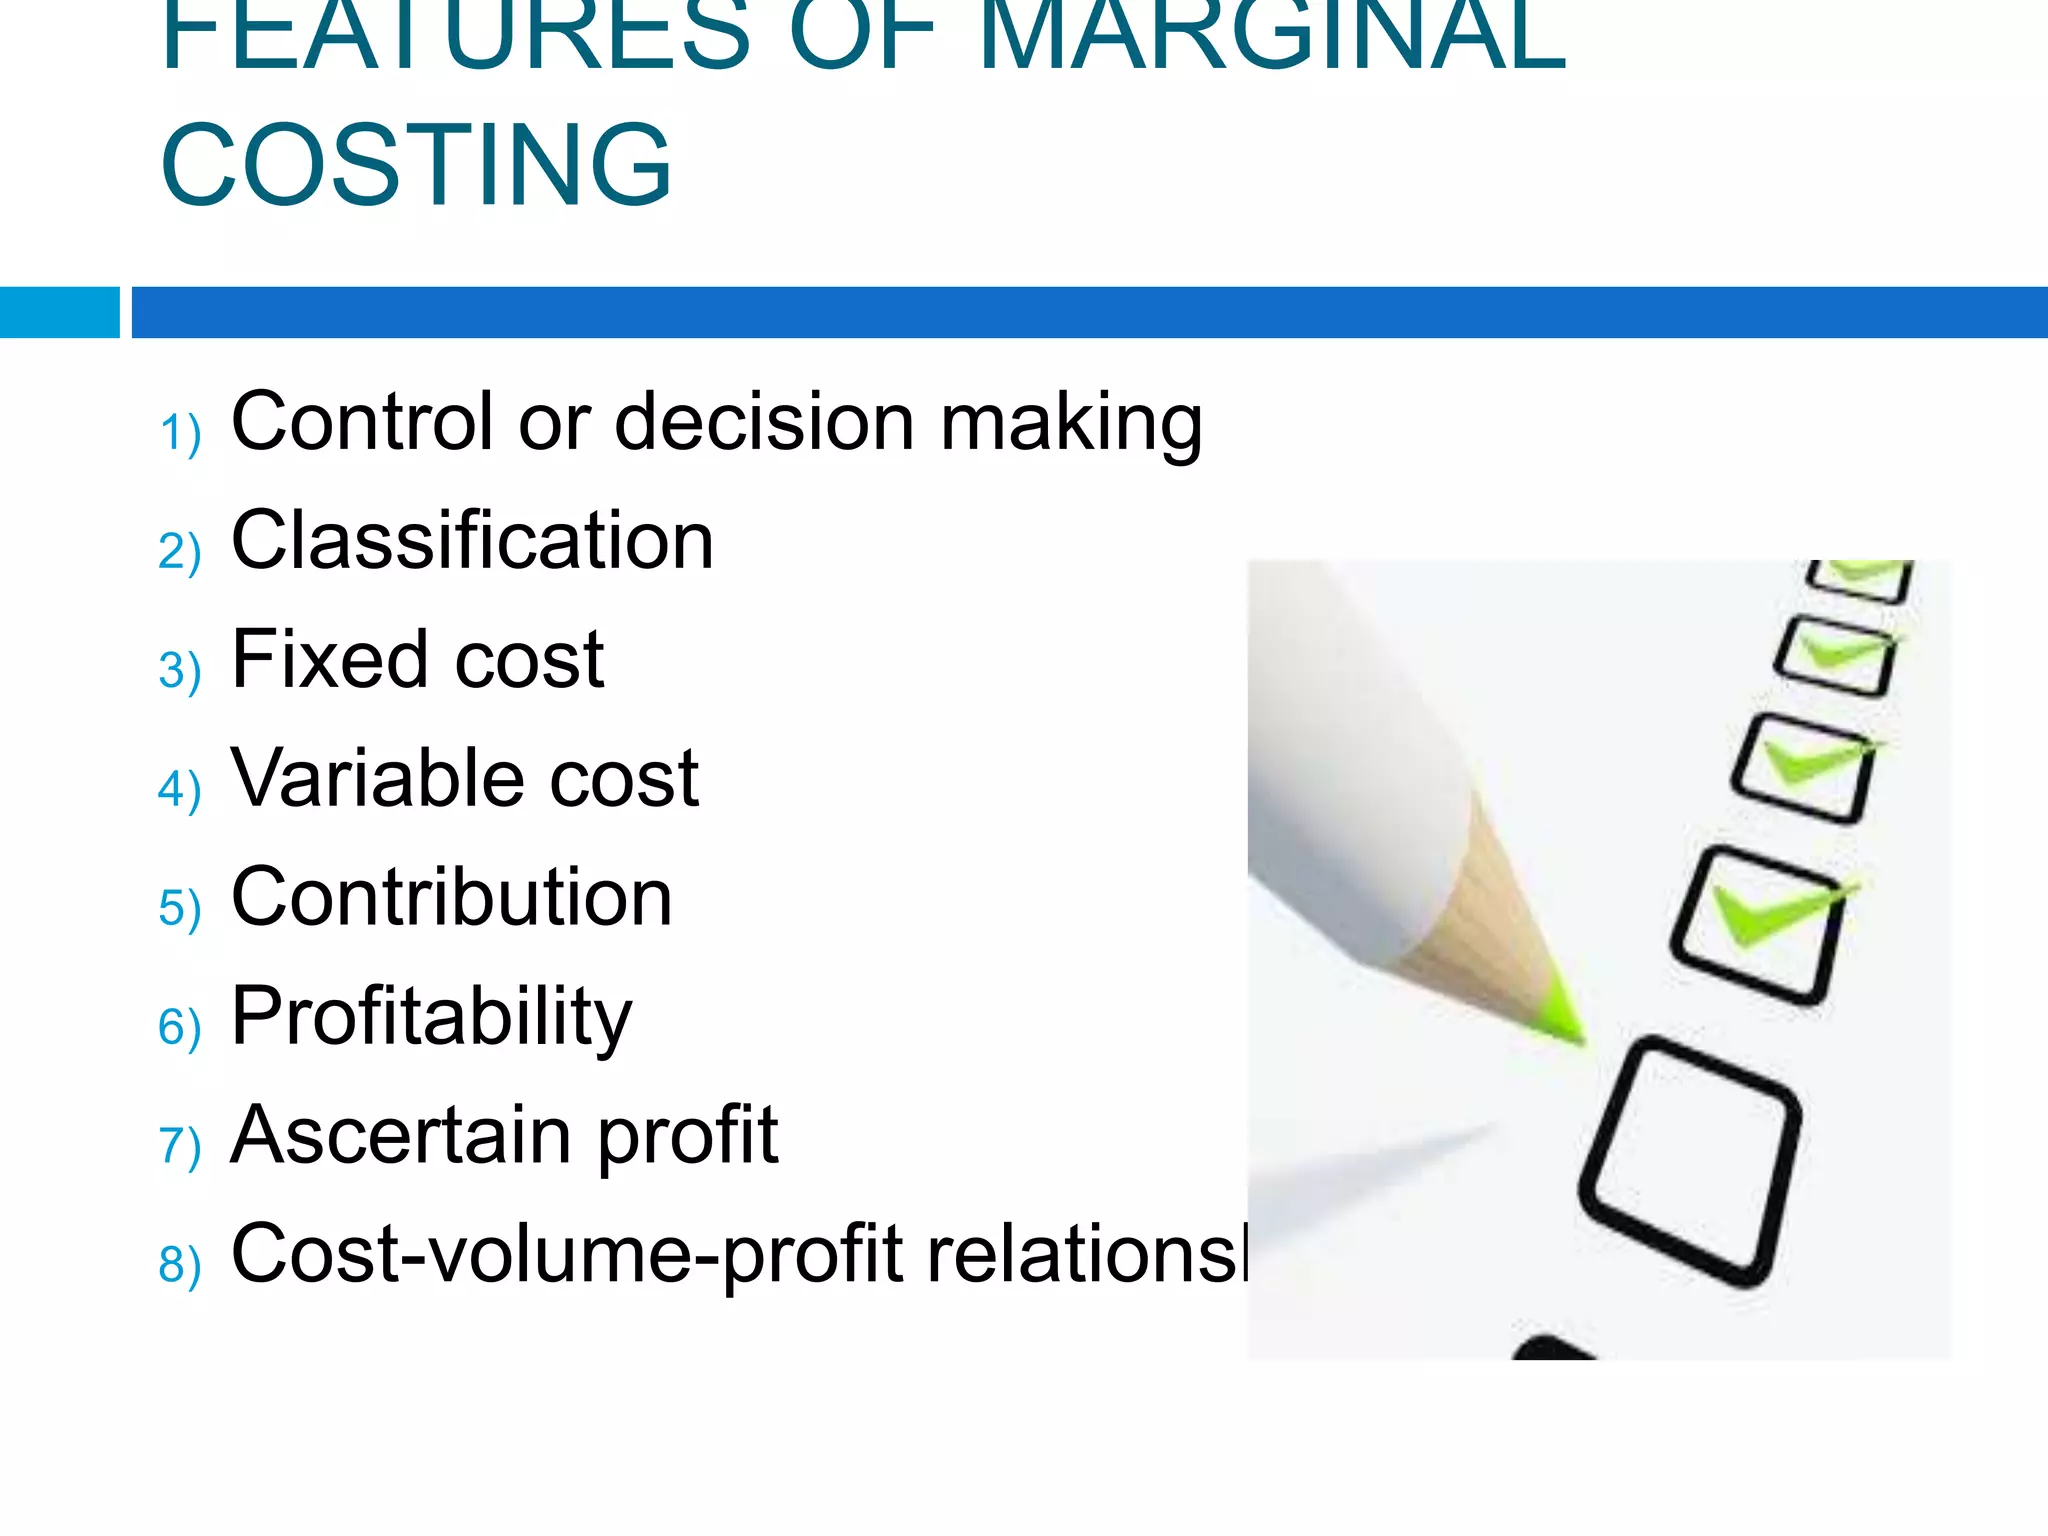


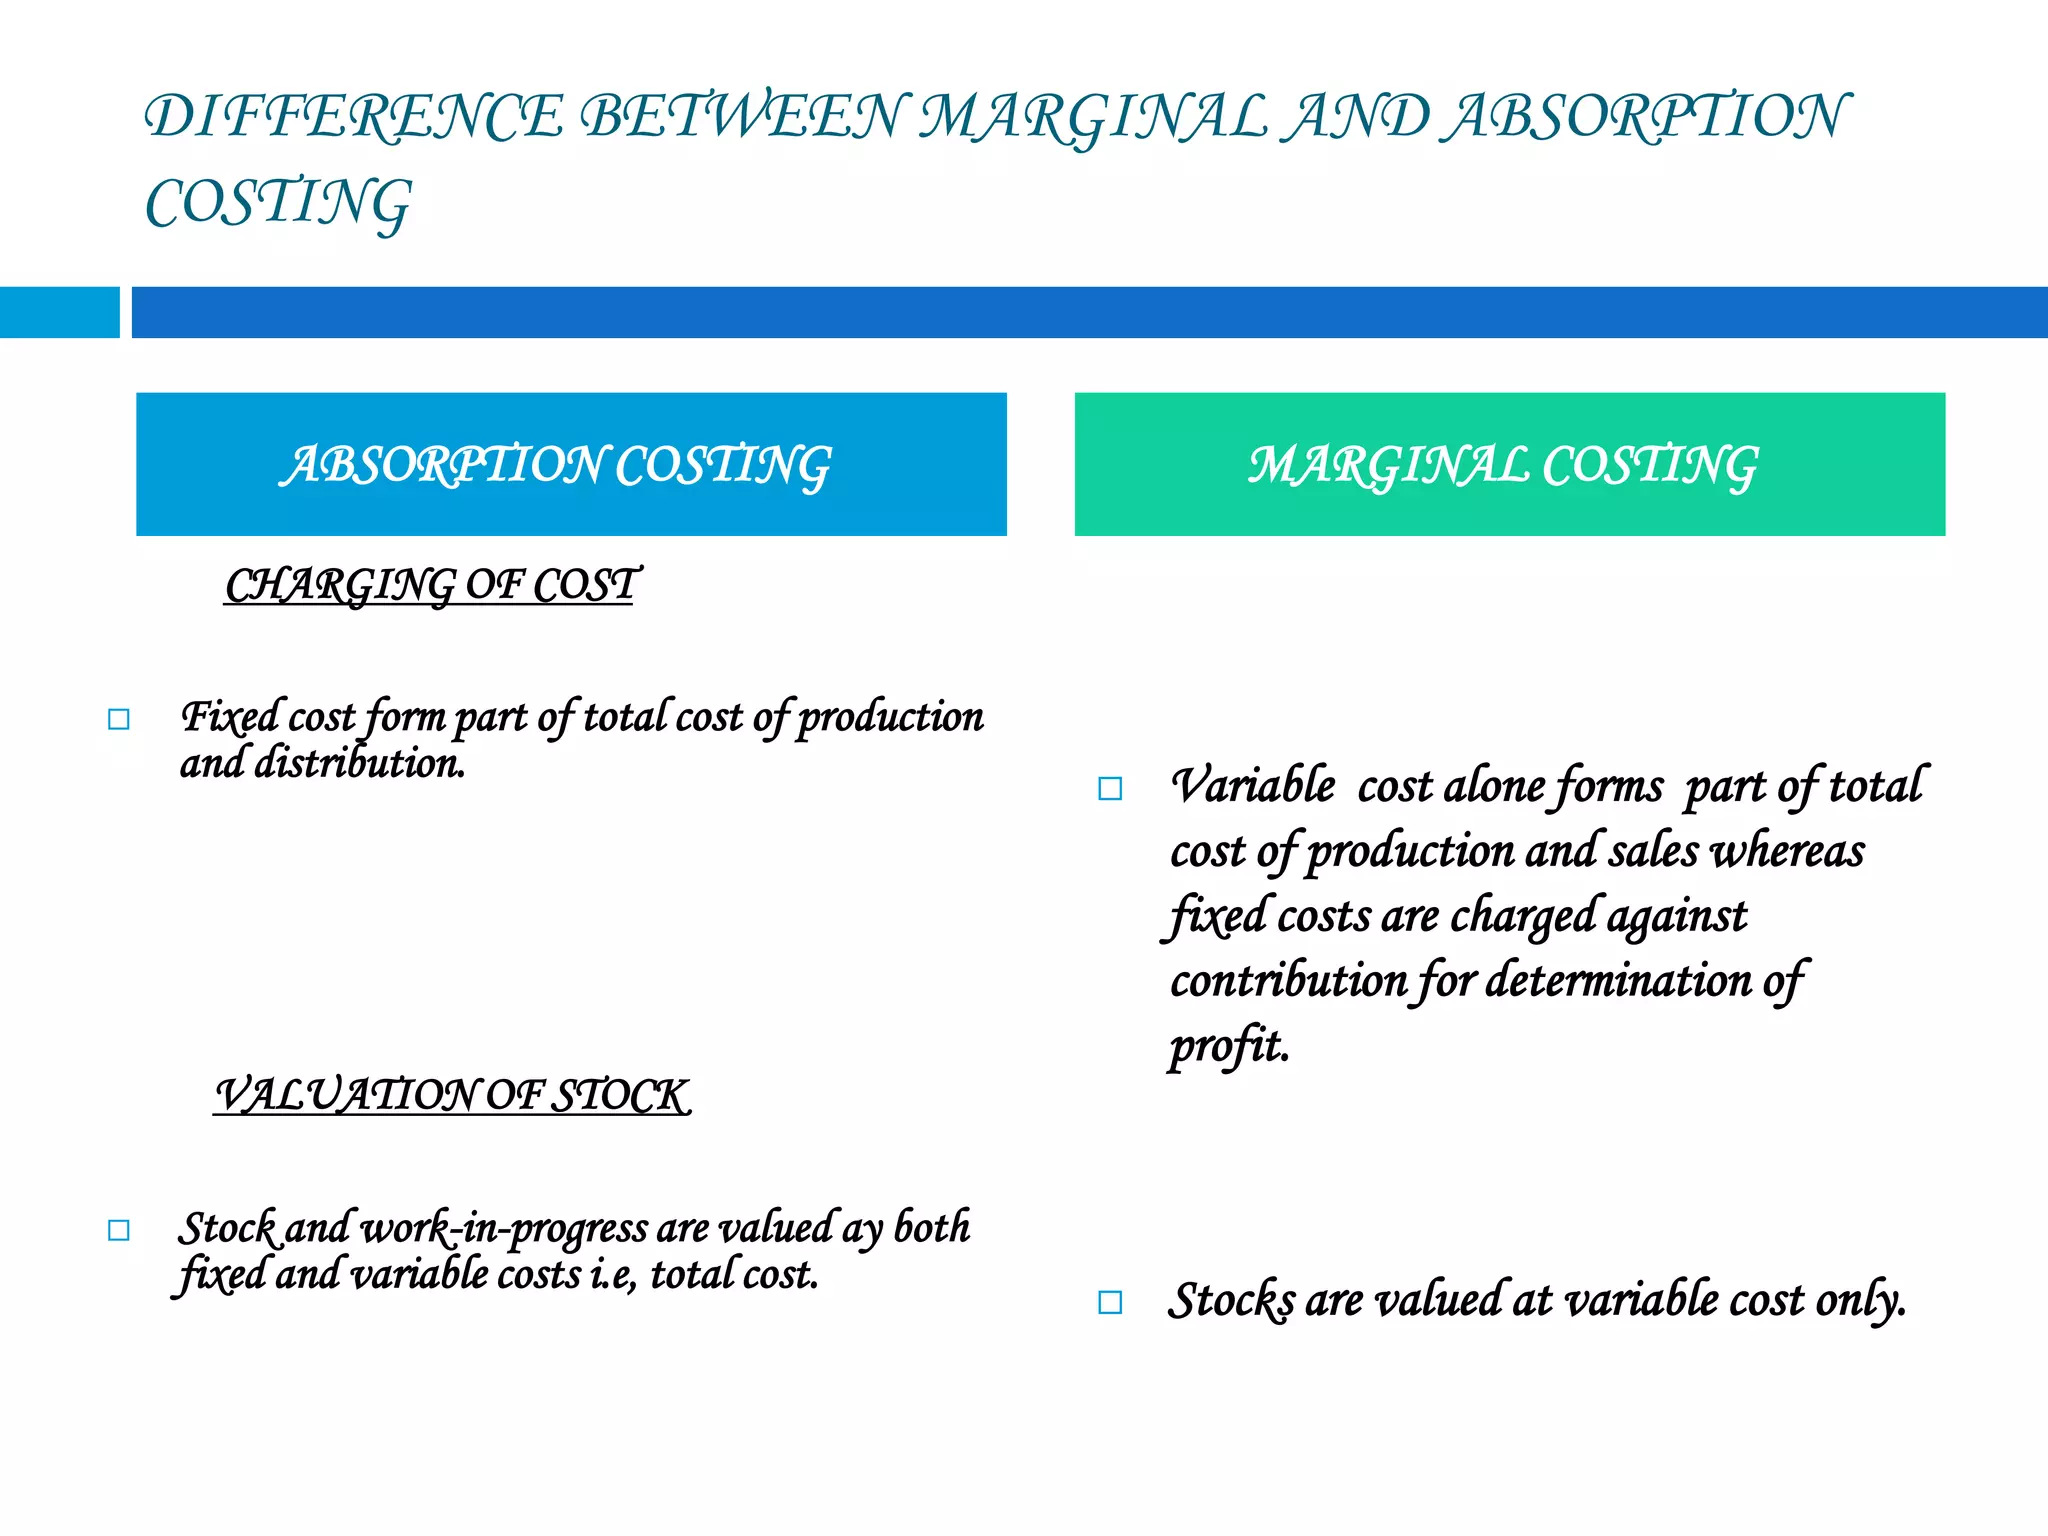


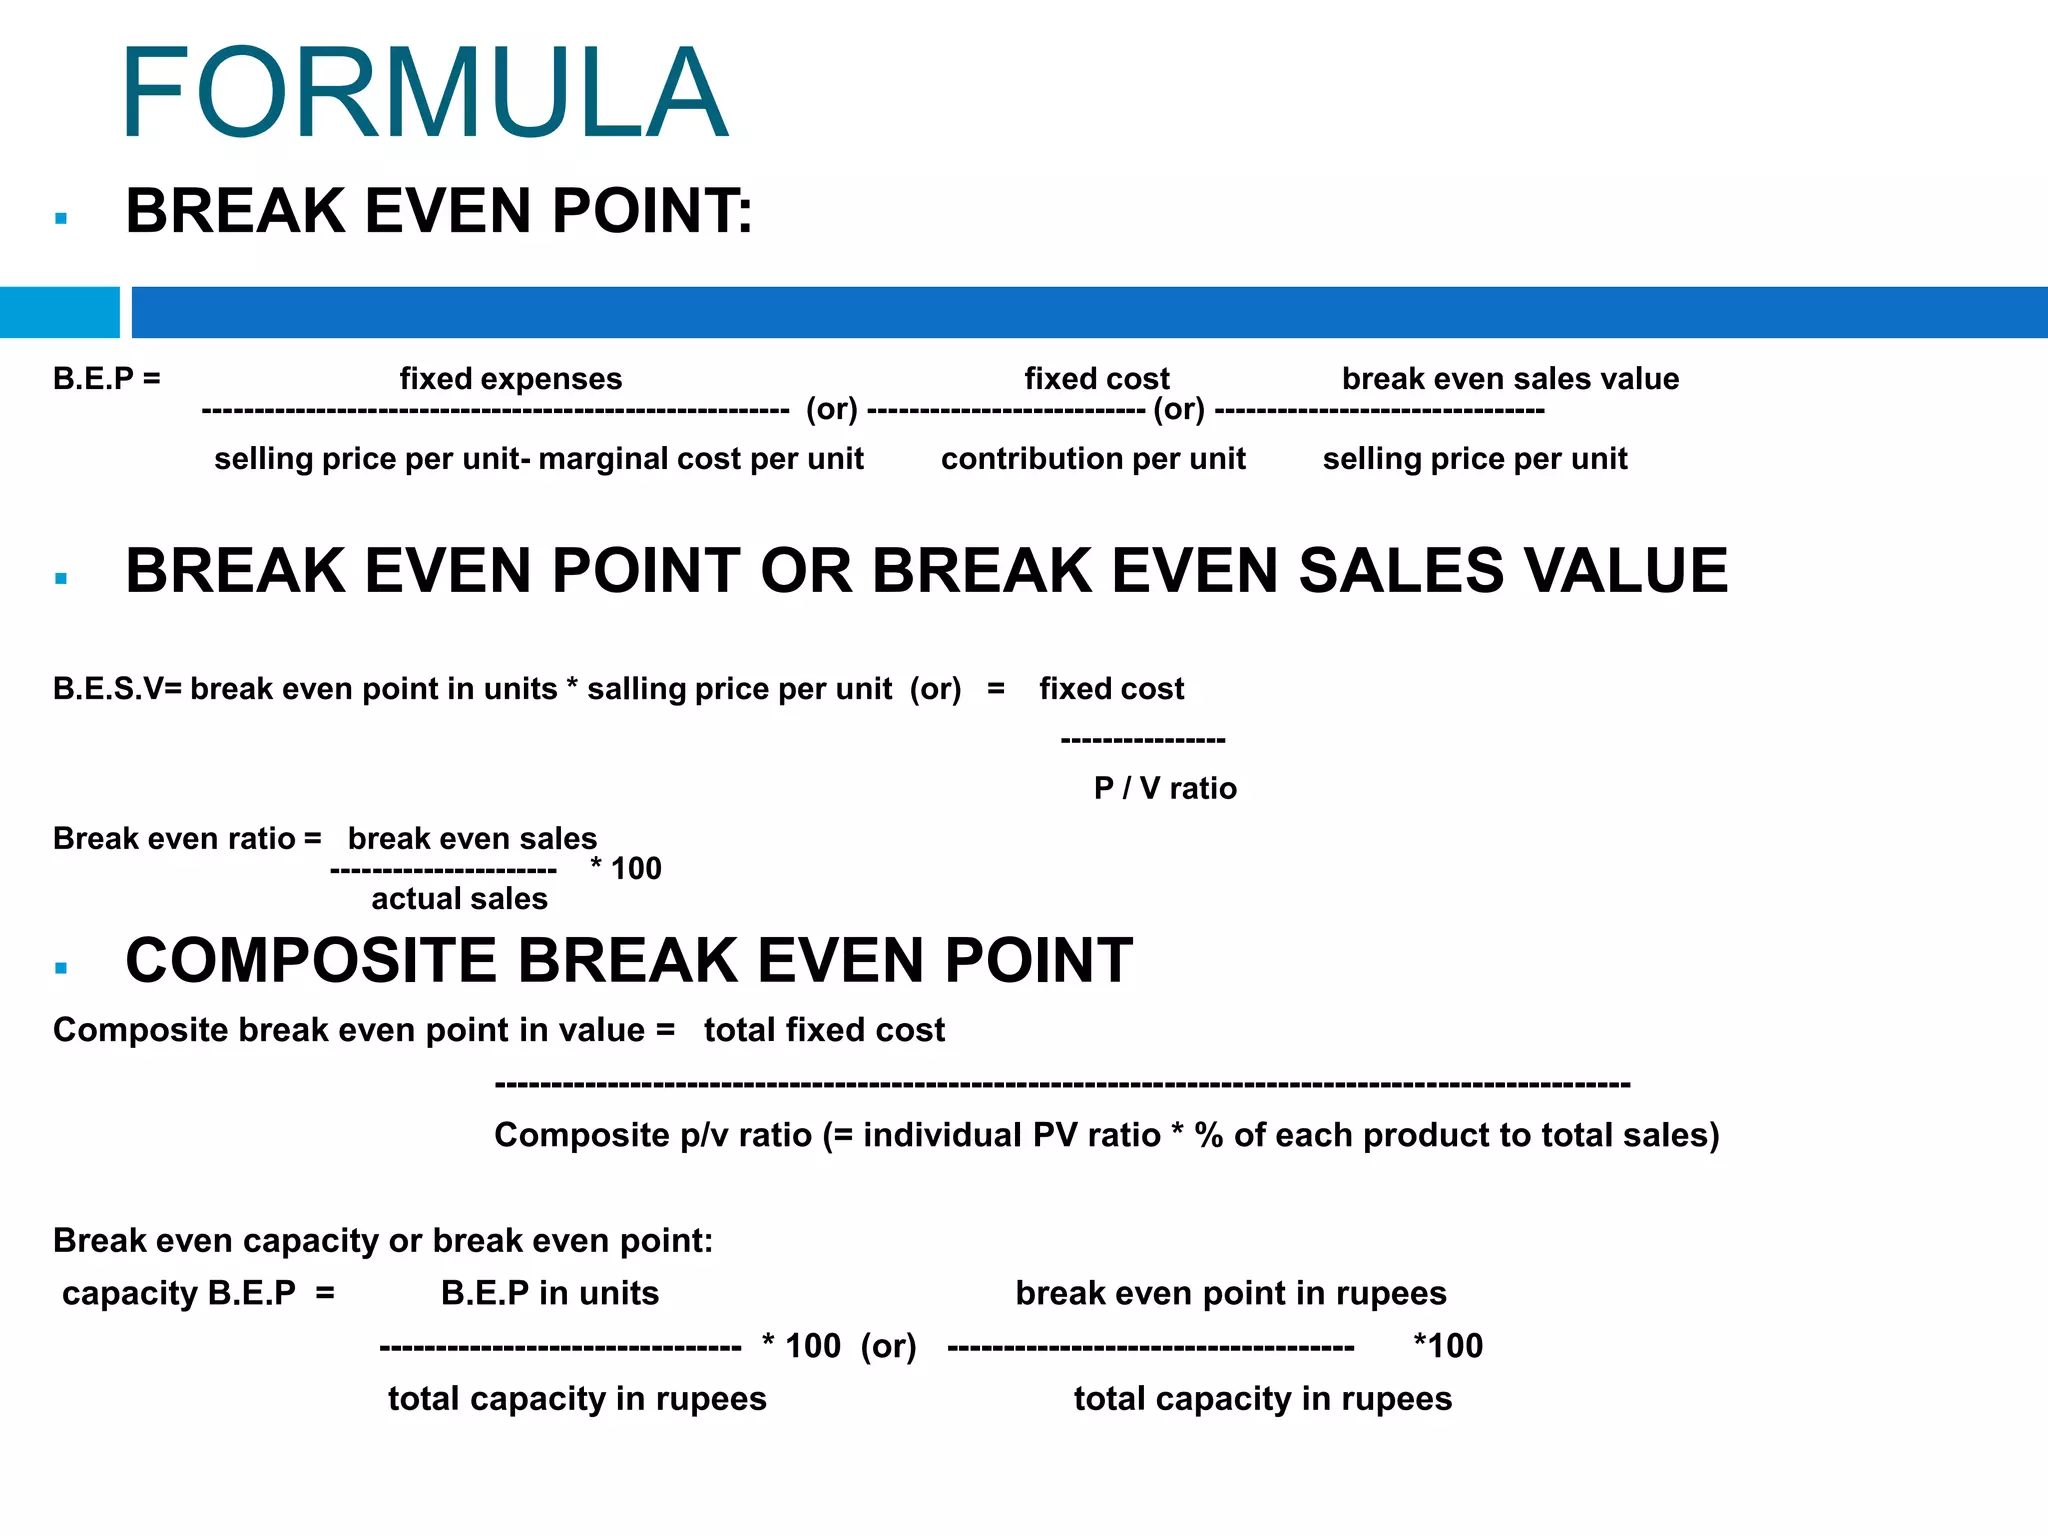

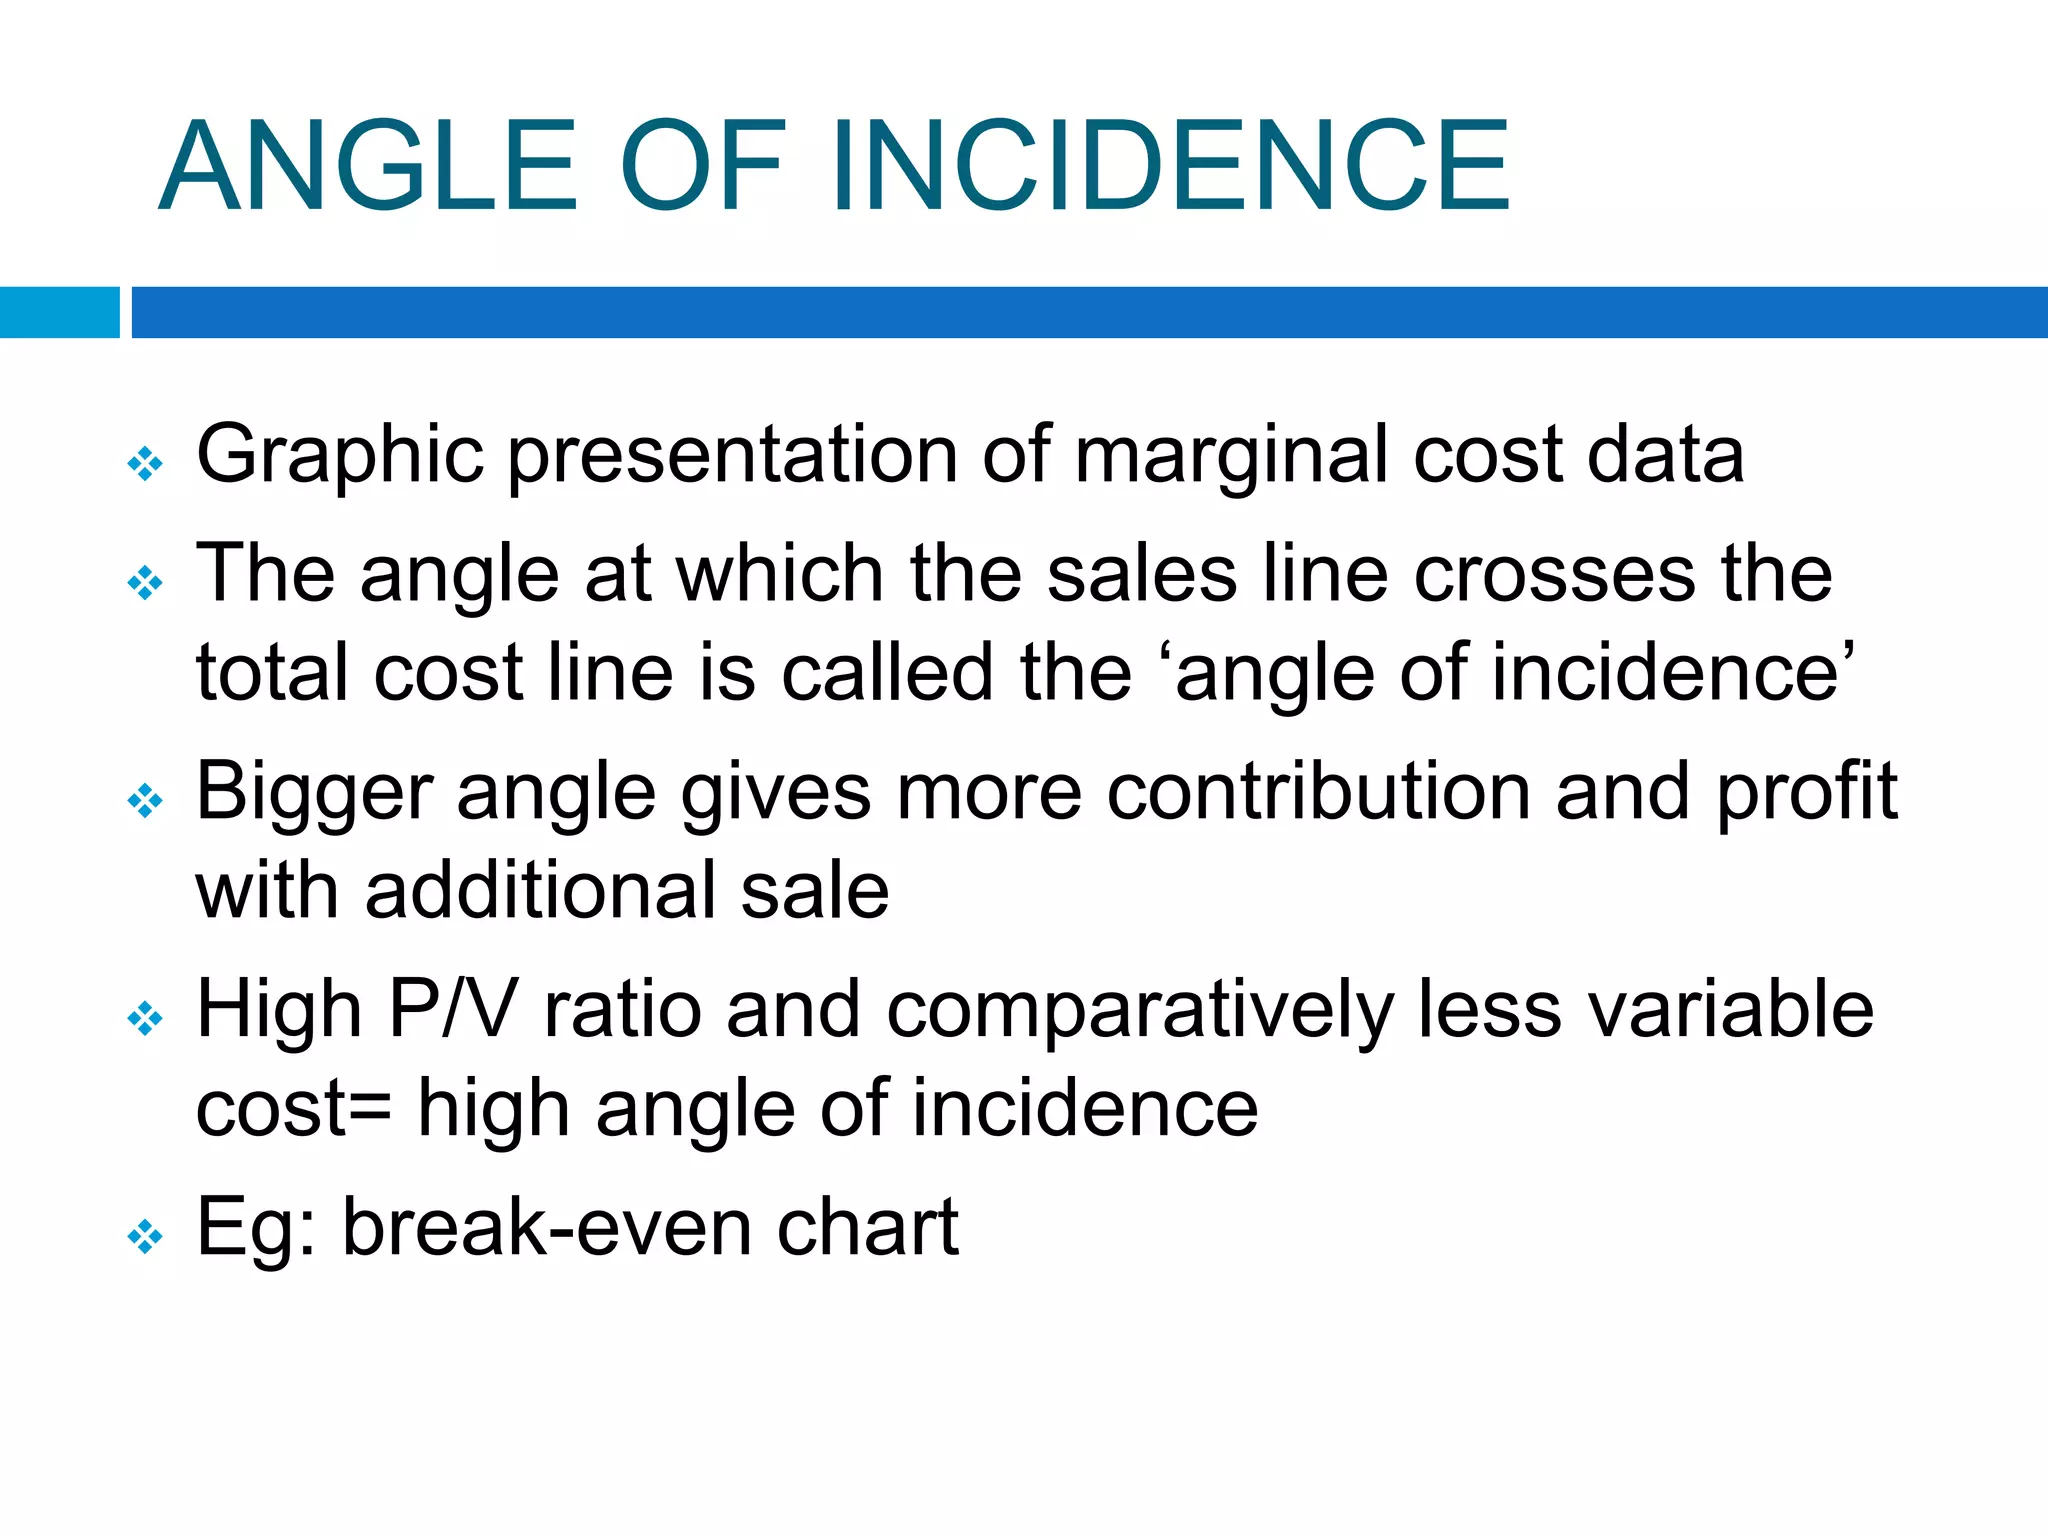


This document provides an overview of marginal costing, including definitions, features, advantages, limitations, and differences from absorption costing. It also covers cost-volume-profit analysis, including concepts like fixed costs, variable costs, contribution, break-even point, margin of safety, and angle of incidence. Key points include: - Marginal costing focuses on additional cost of producing one more unit and is useful for short-term decision making. - It involves classifying costs as fixed or variable and calculating contribution. - Cost-volume-profit analysis examines the relationship between costs, sales volume, and profits using various metrics like break-even point. - Graphs like break-even charts can visually depict


